Financial Markets Report: Qantas and Virgin Analysis
VerifiedAdded on 2019/10/31
|18
|4109
|183
Report
AI Summary
This report provides a comprehensive analysis of the airline industry in Australia, focusing on Qantas and Virgin airlines. It examines the impact of economic factors such as GDP, interest rates, and inflation on the profitability of these companies. The report also conducts a detailed financial analysis using various ratios, including profitability, efficiency, capital structure, liquidity, and market value ratios. The analysis compares the financial health of Qantas and Virgin, concluding that Virgin has a stronger financial position. The report also offers recommendations for Qantas to improve its financial performance.
Principles of Financial Markets 1
“Principles of Financial Market”
“Principles of Financial Market”
Paraphrase This Document
Need a fresh take? Get an instant paraphrase of this document with our AI Paraphraser
Principles of Financial Markets 2
Executive Summary
The report analyses the impact of economic factors such as GDP, interest rate and inflation rate
on the profitability level of airline industry and air companies in Australia. The financial health
of Qantas and Virgin airlines is calculated on the basis of various ratios such as profitability,
efficiency, capital structure, liquidity ratios and market value ratios. These ratios are helpful for
an organization to evaluate the structural position in the financial market.
Principles of Financial Markets 3
Table of Contents
Executive Summary.........................................................................................................................2
Introduction......................................................................................................................................4
Brief History of Air Travel Industry................................................................................................5
History and Mission statement of Companies.................................................................................5
Virgin Atlantic.............................................................................................................................5
Qantas Airways............................................................................................................................5
Top-down Analysis..........................................................................................................................6
Current GDP rates........................................................................................................................6
Current Interest Rate....................................................................................................................6
Current Value of $AUD...............................................................................................................7
Inflation rate.................................................................................................................................7
Personal Disposable Income........................................................................................................8
Bottom up Analysis:........................................................................................................................8
Liquidity Ratios............................................................................................................................8
Profitability Ratio.......................................................................................................................10
Efficiency Ratios........................................................................................................................11
Capital Structure Ratios.............................................................................................................13
Market Value Ratios..................................................................................................................14
Overall analysis of Qantas and Virgin...........................................................................................15
Conclusion and Recommendations................................................................................................16
References......................................................................................................................................17
⊘ This is a preview!⊘
Do you want full access?
Subscribe today to unlock all pages.
Trusted by 1+ million students worldwide
Principles of Financial Markets 4
Introduction
The aim of this report is to provide an understanding of fundamental analysis of airline industry
as well as the selected companies that are Virgin airline and Qantas Airways. In addition to this,
the report conducts a top-down analysis of the overall economic environment of the selected
companies that includes the fundamental impact on the performance of selected industry and
companies. For this, the report analysis the current Gross domestic product, inflation rate,
interest rate, exchange rate and personal disposable income in Australia. On the other hand, the
report also conducts bottom down analysis of the financial situation of the companies and airline
industry. The ratios analyze the performance of the selected companies. The bottom down
analysis helps in the comparative analysis and to finding out the more profitable company.
Paraphrase This Document
Need a fresh take? Get an instant paraphrase of this document with our AI Paraphraser
Principles of Financial Markets 5
Brief History of Air Travel Industry
One of the strong industries is air travel industry in Australia. The air travel industry facilities the
economic growth, international investment, tourism and world trade and it will increase by 7%
per year. In addition to this, business travel has been developed the companies on an
international level in terms of supply and production chain and investment that will also
contribute to the economic growth. In terms of value, airlines industry shows a valuable growth
with $14.2 billion from 2012 to 2017 and annual growth rate 0.4%. The air travel industry exists
in the increasing competitive market that was affected by recent trend by expanding domestic as
well as international service ((IBIS, 2016).).
History and Mission statement of Companies
Virgin Atlantic
The Virgin Atlantic was founded in 1984 in the UK and headquarter of this company is in
Crawley and England. The company has a great goodwill and popularity so it enjoyed various
trade awards across the world. The mission statement of the Virgin Atlantic is “to embrace the
human spirit and let it fly”. After the expansion of the company, the Virgin Atlantic sold its 49%
share to Singapore Airlines in £600.25 million (Virgin Atlantic, 2016).
Qantas Airways
The Qantas Airlines is one of the oldest airlines in the world that was founded in 1920 at
Queensland. Initially, the Qantas Airways operates the service of Airmails that has been
subsidized by the Australian government. It was the largest company, which provides
transportation service to the different countries. The company holds 65% shares of the domestic
Principles of Financial Markets 6
market in Australia (Qantas, 2017). The mission statement of this company is that the company
is dedicated towards work to being best and become an Australian leading premium airline
company. In addition to this, the company wants to meet the expectation every time when
passengers fly.
Top-down Analysis
Top-down analysis is used to look for the big picture firstly and after that it will analysis the
other small component in detail. In addition to this, the investor has calculated the share in the
market by determining the total market (Mao et al., 2013). The investor starts the analysis with
the help of economic indicator like interest rates, inflation, energy price, gross domestic
production and exchange rates, which helps the investor for choosing the right stock. Some of
the economic indicators are described as below-
Current GDP rates
To measure the economic activity of the nation gross domestic production is an effective
indicator. In June quarter of 2017, the GDP rate of Australian is increased .80% in compare to
previous year and stronger than first quarter of the same financial year. The contribution of all
the service industries including the airline industry in gross domestic product is 52% (Trading
Economics, 2017). In the economic environment, the revenue from the airways is increasing day
by day, which means the Australian economic activities rises. The disposable income of the
Virgin Atlantic and Qantas Airways is increased that means the demand for air travel is increase
for business as well as leisure purpose.
⊘ This is a preview!⊘
Do you want full access?
Subscribe today to unlock all pages.
Trusted by 1+ million students worldwide
Principles of Financial Markets 7
Current Interest Rate
The interest rate is an amount that was expressed as a percentage of principal by the loan taker to
the borrower for using the assets. In addition to this, it was the amount that has been paid by the
borrower to a lender for a specific period of time with the particular percentage. The interest of
Australia in 2017 is 1.5%, which is unchanged (Reserve Bank of Australia, 2017). The value of
Australian dollar is decreased as compare to 2016 therefore, the airline's industry take the benefit
of the decreased value of Australian dollar. In favor to this, due to the implementation of current
interest rate the cost of ownership is reduced by $7.4m. Hence, it supports the Australian airlines
such as Virgin Atlantic and Qantas Airways.
Current Value of $AUD
In the present context, the value of 1AUD is equal to 0.77US Dollar. It analyses that the value of
Australian dollar is lower as compare to US dollar (Parliament of Australia, 2016). There is
positive and negative impact on the airline's industry with the fluctuation in currency. There is a
need in airline industry to translate the cash flow in the different currencies so it will affect the
decision of customer, airline decision and the financial accounts of the airlines. The lower value
of the exchange rate has created a problem for both companies such as Qantas and Virgin airlines
related to fuel hedging.
Inflation rate
The inflation rate is the measurement of the increase in the price of goods and service over a
particular period of time that is replicated as a percentage. It is usually measured on monthly and
annually basis in the Australia. The inflation rate in Australia has been increased 1.9% in the
June quarter of 2017 (Trading Economics, 2017). It was increased the price of food and housing
offset in Australia. The Airlines industry is not able to take benefit because of the high inflation
Paraphrase This Document
Need a fresh take? Get an instant paraphrase of this document with our AI Paraphraser
Principles of Financial Markets 8
rate. It will impact on the demand for airlines services that is provided by the airline's companies
such as Virgin and Qantas Airlines.
Personal Disposable Income
Personal disposable income is the amount of money that has been available for households for
spending and saving that has been calculated after paying income tax to the government. It is
known as the economic indicator that is used to provide a framework the overall state of the
economy. In addition to this, the personal disposal income increased to 287837 AUD million in
2016 third quarter from the second quarter of 2016 that is 287139 AUD million (Trading
Economics, 2016). It analyzed that personal disposable income of Australian people is increased
that makes a positive impact on the Airlines industry. The oil price carries an effective
improvement for Airline companies like Virgin and Qantas Airlines; it will reduce the fair of air
traveling. With the increasing personal disposable income, it will increase the spending power of
customers.
Bottom up Analysis:
In finance and accounting, bottom-up analysis is a defined as an investment approach which is
used to analyze an individual stock on the basis of different factors. These factors involve an
organization’s overall financial statements, financial strength and other individual indicators of
performance (Sternberg, 2013). In this way, bottom-up analysis of Qantas and Virgin through
different ratios is as below:
Liquidity Ratios
These ratios are used to analyze the ability of a company to pay debt obligations or current
liabilities through the calculation of current ratio, acid test ratio, and cash ratio (Rist et al, 2014).
Principles of Financial Markets 9
Name of the
ratio
Formula of the Ratio Qantas (30/6/2016) Virgin (30/6/2016) Industry
average
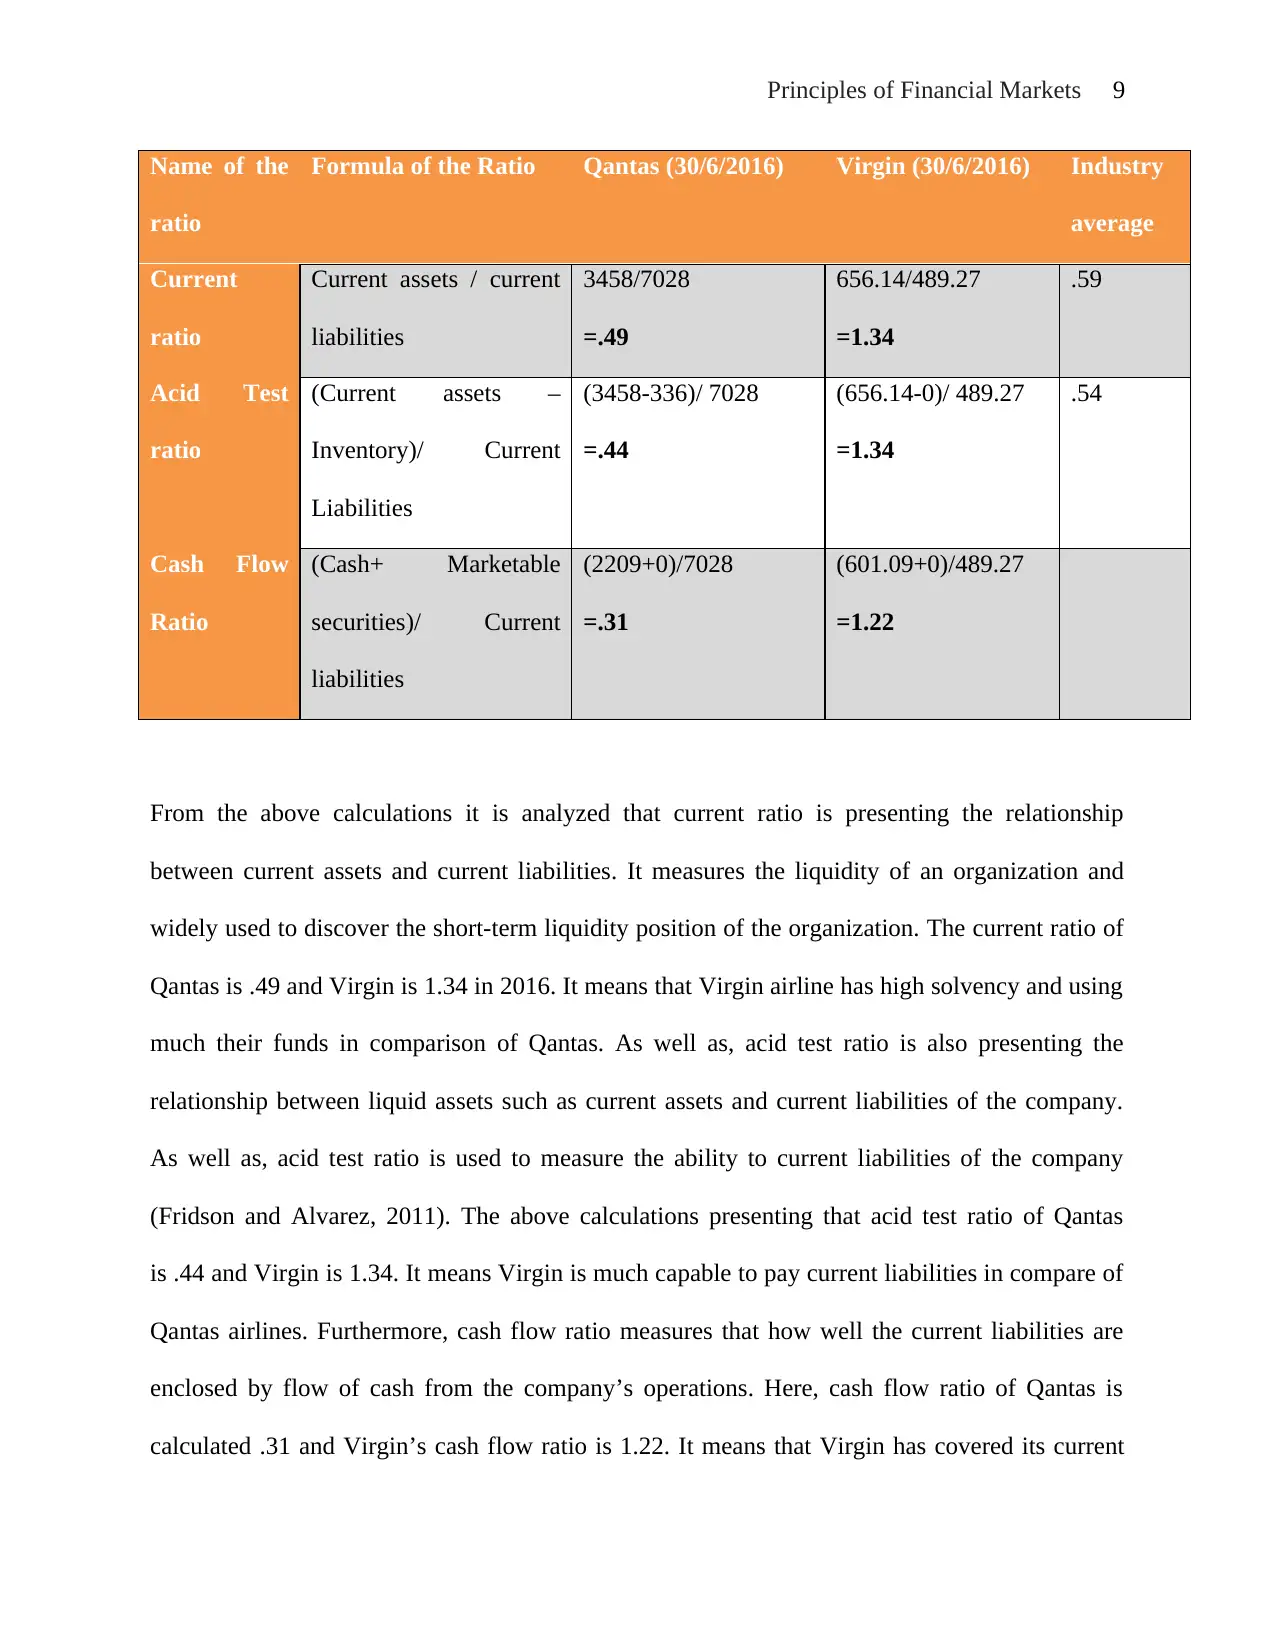
Current
ratio
Current assets / current
liabilities
3458/7028
=.49
656.14/489.27
=1.34
.59
Acid Test
ratio
(Current assets –
Inventory)/ Current
Liabilities
(3458-336)/ 7028
=.44
(656.14-0)/ 489.27
=1.34
.54
Cash Flow
Ratio
(Cash+ Marketable
securities)/ Current
liabilities
(2209+0)/7028
=.31
(601.09+0)/489.27
=1.22
From the above calculations it is analyzed that current ratio is presenting the relationship
between current assets and current liabilities. It measures the liquidity of an organization and
widely used to discover the short-term liquidity position of the organization. The current ratio of
Qantas is .49 and Virgin is 1.34 in 2016. It means that Virgin airline has high solvency and using
much their funds in comparison of Qantas. As well as, acid test ratio is also presenting the
relationship between liquid assets such as current assets and current liabilities of the company.
As well as, acid test ratio is used to measure the ability to current liabilities of the company
(Fridson and Alvarez, 2011). The above calculations presenting that acid test ratio of Qantas
is .44 and Virgin is 1.34. It means Virgin is much capable to pay current liabilities in compare of
Qantas airlines. Furthermore, cash flow ratio measures that how well the current liabilities are
enclosed by flow of cash from the company’s operations. Here, cash flow ratio of Qantas is
calculated .31 and Virgin’s cash flow ratio is 1.22. It means that Virgin has covered its current
Name of the
ratio
Formula of the Ratio Qantas (30/6/2016) Virgin (30/6/2016) Industry
average
Current
ratio
Current assets / current
liabilities
3458/7028
=.49
656.14/489.27
=1.34
.59
Acid Test
ratio
(Current assets –
Inventory)/ Current
Liabilities
(3458-336)/ 7028
=.44
(656.14-0)/ 489.27
=1.34
.54
Cash Flow
Ratio
(Cash+ Marketable
securities)/ Current
liabilities
(2209+0)/7028
=.31
(601.09+0)/489.27
=1.22
From the above calculations it is analyzed that current ratio is presenting the relationship
between current assets and current liabilities. It measures the liquidity of an organization and
widely used to discover the short-term liquidity position of the organization. The current ratio of
Qantas is .49 and Virgin is 1.34 in 2016. It means that Virgin airline has high solvency and using
much their funds in comparison of Qantas. As well as, acid test ratio is also presenting the
relationship between liquid assets such as current assets and current liabilities of the company.
As well as, acid test ratio is used to measure the ability to current liabilities of the company
(Fridson and Alvarez, 2011). The above calculations presenting that acid test ratio of Qantas
is .44 and Virgin is 1.34. It means Virgin is much capable to pay current liabilities in compare of
Qantas airlines. Furthermore, cash flow ratio measures that how well the current liabilities are
enclosed by flow of cash from the company’s operations. Here, cash flow ratio of Qantas is
calculated .31 and Virgin’s cash flow ratio is 1.22. It means that Virgin has covered its current
⊘ This is a preview!⊘
Do you want full access?
Subscribe today to unlock all pages.
Trusted by 1+ million students worldwide
Principles of Financial Markets 10
liabilities well in compare of Qantas. Moreover, the above calculations are presenting that
liquidity ratios of Qantas is less than industry average but these ratios of Virgin company is
higher than industry average. It presents that Virgin is much capable in paying debt obligations
in compare of industry average and Qantas Company.
Profitability Ratio
In accounting profitability ratio is used to compare the income to expanses during a specific time
of period. This ratio focuses on return of a company’s investment on assets and inventory. In
other words, profitability ratios are important element to compute overall efficiency of the
company which may be either in relation to investment or sales (Nelson, 2014).
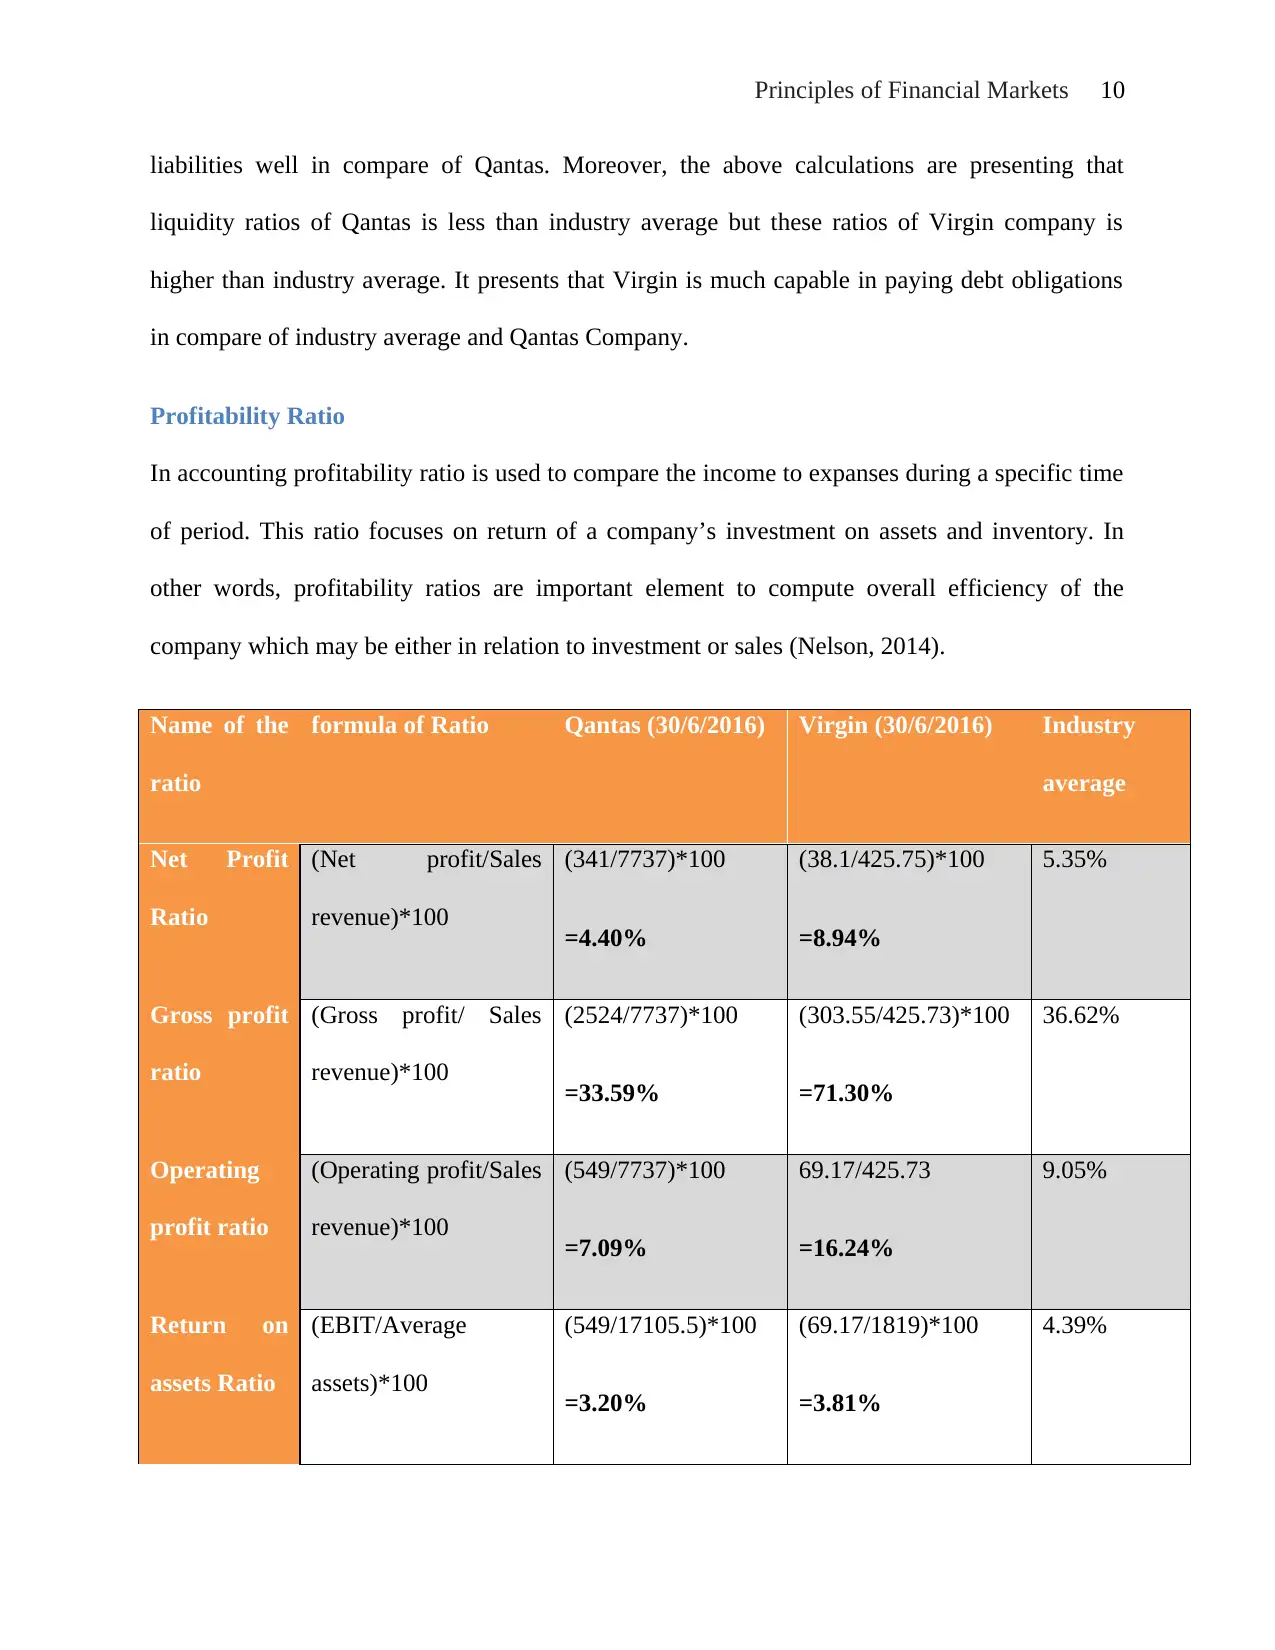
Name of the
ratio
formula of Ratio Qantas (30/6/2016) Virgin (30/6/2016) Industry
average
Net Profit
Ratio
(Net profit/Sales
revenue)*100
(341/7737)*100
=4.40%
(38.1/425.75)*100
=8.94%
5.35%
Gross profit
ratio
(Gross profit/ Sales
revenue)*100
(2524/7737)*100
=33.59%
(303.55/425.73)*100
=71.30%
36.62%
Operating
profit ratio
(Operating profit/Sales
revenue)*100
(549/7737)*100
=7.09%
69.17/425.73
=16.24%
9.05%
Return on
assets Ratio
(EBIT/Average
assets)*100
(549/17105.5)*100
=3.20%
(69.17/1819)*100
=3.81%
4.39%
liabilities well in compare of Qantas. Moreover, the above calculations are presenting that
liquidity ratios of Qantas is less than industry average but these ratios of Virgin company is
higher than industry average. It presents that Virgin is much capable in paying debt obligations
in compare of industry average and Qantas Company.
Profitability Ratio
In accounting profitability ratio is used to compare the income to expanses during a specific time
of period. This ratio focuses on return of a company’s investment on assets and inventory. In
other words, profitability ratios are important element to compute overall efficiency of the
company which may be either in relation to investment or sales (Nelson, 2014).
Name of the
ratio
formula of Ratio Qantas (30/6/2016) Virgin (30/6/2016) Industry
average
Net Profit
Ratio
(Net profit/Sales
revenue)*100
(341/7737)*100
=4.40%
(38.1/425.75)*100
=8.94%
5.35%
Gross profit
ratio
(Gross profit/ Sales
revenue)*100
(2524/7737)*100
=33.59%
(303.55/425.73)*100
=71.30%
36.62%
Operating
profit ratio
(Operating profit/Sales
revenue)*100
(549/7737)*100
=7.09%
69.17/425.73
=16.24%
9.05%
Return on
assets Ratio
(EBIT/Average
assets)*100
(549/17105.5)*100
=3.20%
(69.17/1819)*100
=3.81%
4.39%
Paraphrase This Document
Need a fresh take? Get an instant paraphrase of this document with our AI Paraphraser
Principles of Financial Markets 11
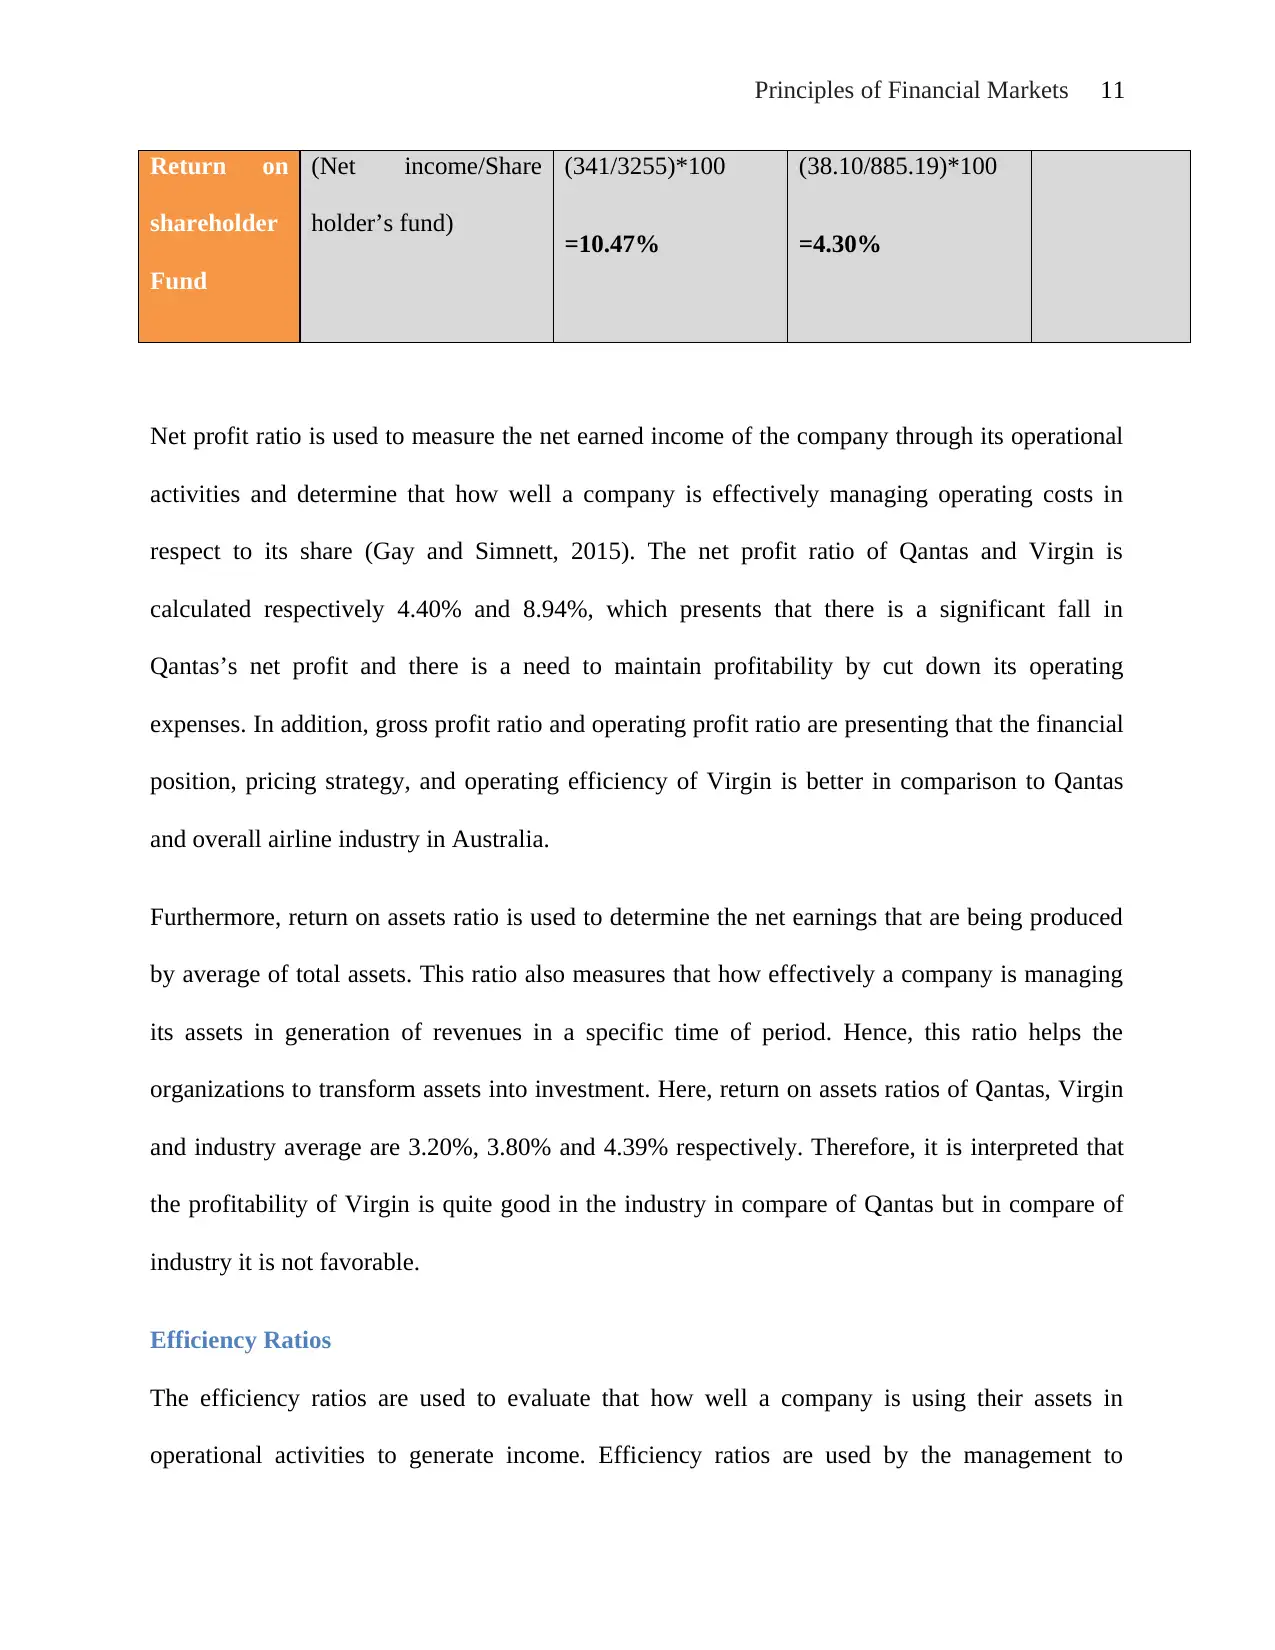
Return on
shareholder
Fund
(Net income/Share
holder’s fund)
(341/3255)*100
=10.47%
(38.10/885.19)*100
=4.30%
Net profit ratio is used to measure the net earned income of the company through its operational
activities and determine that how well a company is effectively managing operating costs in
respect to its share (Gay and Simnett, 2015). The net profit ratio of Qantas and Virgin is
calculated respectively 4.40% and 8.94%, which presents that there is a significant fall in
Qantas’s net profit and there is a need to maintain profitability by cut down its operating
expenses. In addition, gross profit ratio and operating profit ratio are presenting that the financial
position, pricing strategy, and operating efficiency of Virgin is better in comparison to Qantas
and overall airline industry in Australia.
Furthermore, return on assets ratio is used to determine the net earnings that are being produced
by average of total assets. This ratio also measures that how effectively a company is managing
its assets in generation of revenues in a specific time of period. Hence, this ratio helps the
organizations to transform assets into investment. Here, return on assets ratios of Qantas, Virgin
and industry average are 3.20%, 3.80% and 4.39% respectively. Therefore, it is interpreted that
the profitability of Virgin is quite good in the industry in compare of Qantas but in compare of
industry it is not favorable.
Efficiency Ratios
The efficiency ratios are used to evaluate that how well a company is using their assets in
operational activities to generate income. Efficiency ratios are used by the management to
Principles of Financial Markets 12
improve the growth of the company as well as outside creditors and investors. Usually, the funds
are invested in various assets to generate revenue and sales in the business. These ratios represent
that all the generated revenues and profits are dependent upon how the assets are being managed
(Kaufman, 2013). Efficiency ratios show the time period in which assets can be converted
efficiently into income.
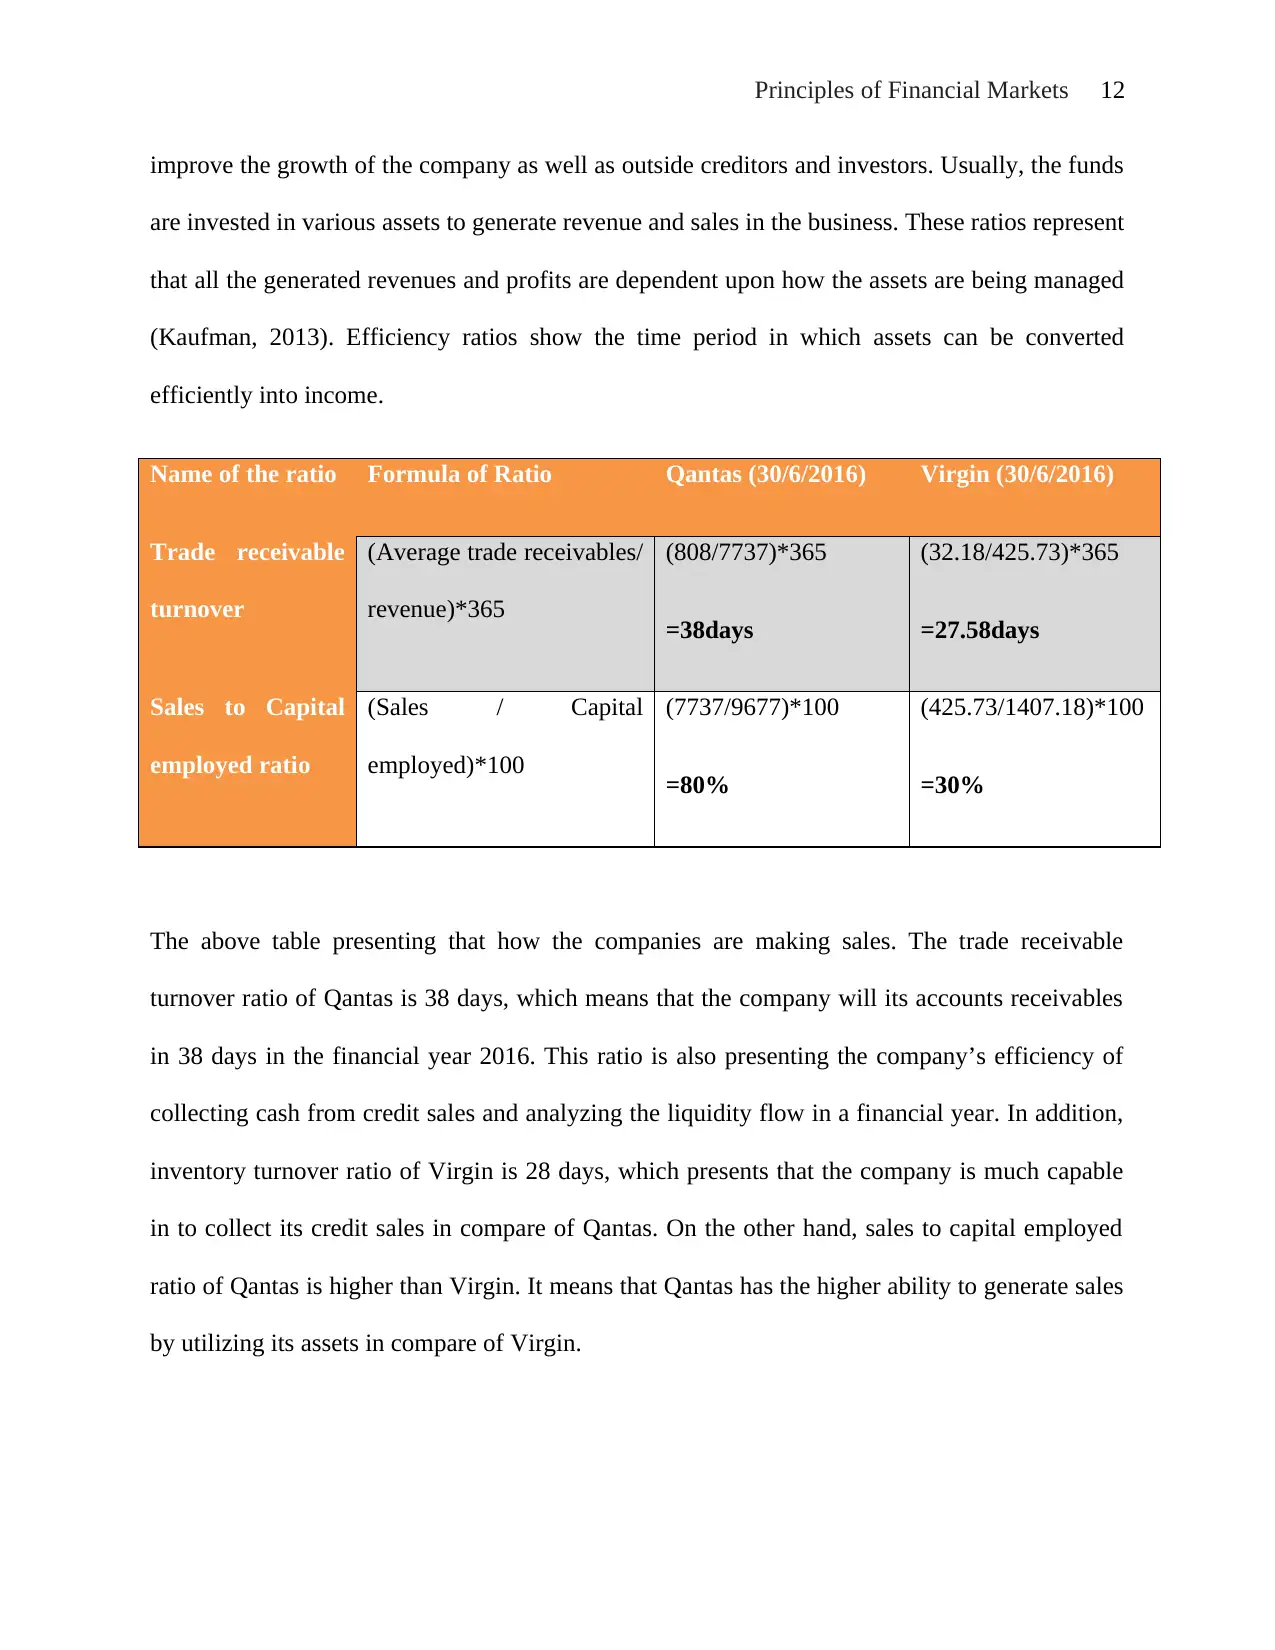
Name of the ratio Formula of Ratio Qantas (30/6/2016) Virgin (30/6/2016)
Trade receivable
turnover
(Average trade receivables/
revenue)*365
(808/7737)*365
=38days
(32.18/425.73)*365
=27.58days
Sales to Capital
employed ratio
(Sales / Capital
employed)*100
(7737/9677)*100
=80%
(425.73/1407.18)*100
=30%
The above table presenting that how the companies are making sales. The trade receivable
turnover ratio of Qantas is 38 days, which means that the company will its accounts receivables
in 38 days in the financial year 2016. This ratio is also presenting the company’s efficiency of
collecting cash from credit sales and analyzing the liquidity flow in a financial year. In addition,
inventory turnover ratio of Virgin is 28 days, which presents that the company is much capable
in to collect its credit sales in compare of Qantas. On the other hand, sales to capital employed
ratio of Qantas is higher than Virgin. It means that Qantas has the higher ability to generate sales
by utilizing its assets in compare of Virgin.
improve the growth of the company as well as outside creditors and investors. Usually, the funds
are invested in various assets to generate revenue and sales in the business. These ratios represent
that all the generated revenues and profits are dependent upon how the assets are being managed
(Kaufman, 2013). Efficiency ratios show the time period in which assets can be converted
efficiently into income.
Name of the ratio Formula of Ratio Qantas (30/6/2016) Virgin (30/6/2016)
Trade receivable
turnover
(Average trade receivables/
revenue)*365
(808/7737)*365
=38days
(32.18/425.73)*365
=27.58days
Sales to Capital
employed ratio
(Sales / Capital
employed)*100
(7737/9677)*100
=80%
(425.73/1407.18)*100
=30%
The above table presenting that how the companies are making sales. The trade receivable
turnover ratio of Qantas is 38 days, which means that the company will its accounts receivables
in 38 days in the financial year 2016. This ratio is also presenting the company’s efficiency of
collecting cash from credit sales and analyzing the liquidity flow in a financial year. In addition,
inventory turnover ratio of Virgin is 28 days, which presents that the company is much capable
in to collect its credit sales in compare of Qantas. On the other hand, sales to capital employed
ratio of Qantas is higher than Virgin. It means that Qantas has the higher ability to generate sales
by utilizing its assets in compare of Virgin.
⊘ This is a preview!⊘
Do you want full access?
Subscribe today to unlock all pages.
Trusted by 1+ million students worldwide
1 out of 18
Related Documents


Your All-in-One AI-Powered Toolkit for Academic Success.
+13062052269
info@desklib.com
Available 24*7 on WhatsApp / Email
![[object Object]](/_next/static/media/star-bottom.7253800d.svg)
Unlock your academic potential
Copyright © 2020–2026 A2Z Services. All Rights Reserved. Developed and managed by ZUCOL.