Project Report: Comprehensive Financial Analysis of Almarai Company
VerifiedAdded on 2020/05/16
|17
|5371
|26
Project
AI Summary
This project report provides a comprehensive financial analysis of the Almarai Company, evaluating its position, performance, and worth using various financial and non-financial tools. It begins with a stockholder analysis, examining investment motivations, marginal stockholders, and corporate governance. The report then assesses risk and return, including systematic and unsystematic risk, and measures investment returns from both short-term and long-term projects. Capital structure choices are analyzed, along with the identification of the optimal capital structure and the company's dividend policy. The report concludes with a valuation study, expressing the company's total worth and the potential earnings for investors. The analysis includes detailed financial data, such as cost of debt, cost of equity, and WACC calculations, providing a thorough overview of the company's financial health and investment potential.
Running Head: Corporate Finance Project
1
Project Report: Corporate Financial Project
1
Project Report: Corporate Financial Project
Paraphrase This Document
Need a fresh take? Get an instant paraphrase of this document with our AI Paraphraser
Corporate Finance Project
2
Contents
Introduction.......................................................................................................................3
Stockholder analysis.........................................................................................................3
Risk and return..................................................................................................................4
Measuring investment returns...........................................................................................7
Capital structure choices...................................................................................................8
Optimal capital structure.................................................................................................10
Mechanics of moving to the optimal..............................................................................11
Dividend policy..............................................................................................................12
A framework for analyzing dividends............................................................................13
Valuation.........................................................................................................................13
References.......................................................................................................................15
Corporate Finance Project
3
Introduction:
This report has been prepared to identify and evaluate the position, performance and
worth of the Almarai Company. For evaluating the worth of the company, various financial
tools and non financial tools have been analyzed. Firstly, the stockholder analysis has been
done to evaluate the position and management style of the company. For this analysis, it has
been evaluated that why the people are investing into this project. Further, it has been
evaluated that who are the marginal stockholders of the company and how the corporate
governance of the company is working. Further, it has been evaluated that what is the risk of
the company in concern of the investment and how much return would be offered by the
company to its shareholders (Zhang, 2012).
In addition, investment return of the company has been measured and the study has
been conducted on the long term and short term projects of the company. Further, capital
structure choices of the company has also been evaluated and to analyze the debt and equity
level of the company. Further, the optimal capital structure has been evaluated to identify the
solvency risk of the company and a better balance among the stock of the company. Various
theories have also been read to evaluate and identify the optimal capital level of the company.
Lastly, dividend policy of the company has been evaluated and it has been analyzed
that through which trend the dividends are offered by the company to its shareholders. A
dividend framework of the company has been evaluated and lastly, a valuation study has been
given which expresses about the total worth of the company and the position of the
investment funds of the company (Thanatawee, 2013). Further, it also explains that how
much earnings would be earned by an investor against his investment money in the company.
Stockholder analysis:
Firstly, the stockholder analysis has been done to evaluate the position and
management style of the company. For this analysis, it has been evaluated that why the
people are investing into this project. The annual report of the company expresses that the
corporate has invested 63.74% in the company whereas 36.26% of stock has been owned by
the individuals. Individuals have invested in the company to reduce the level of the tax
burden (Tucker, 2011). Further, the mutual fund companies have invested 52.4% of total
investment in the company. Government has invested 4% and the rest amount has been
⊘ This is a preview!⊘
Do you want full access?
Subscribe today to unlock all pages.
Trusted by 1+ million students worldwide
Corporate Finance Project
4
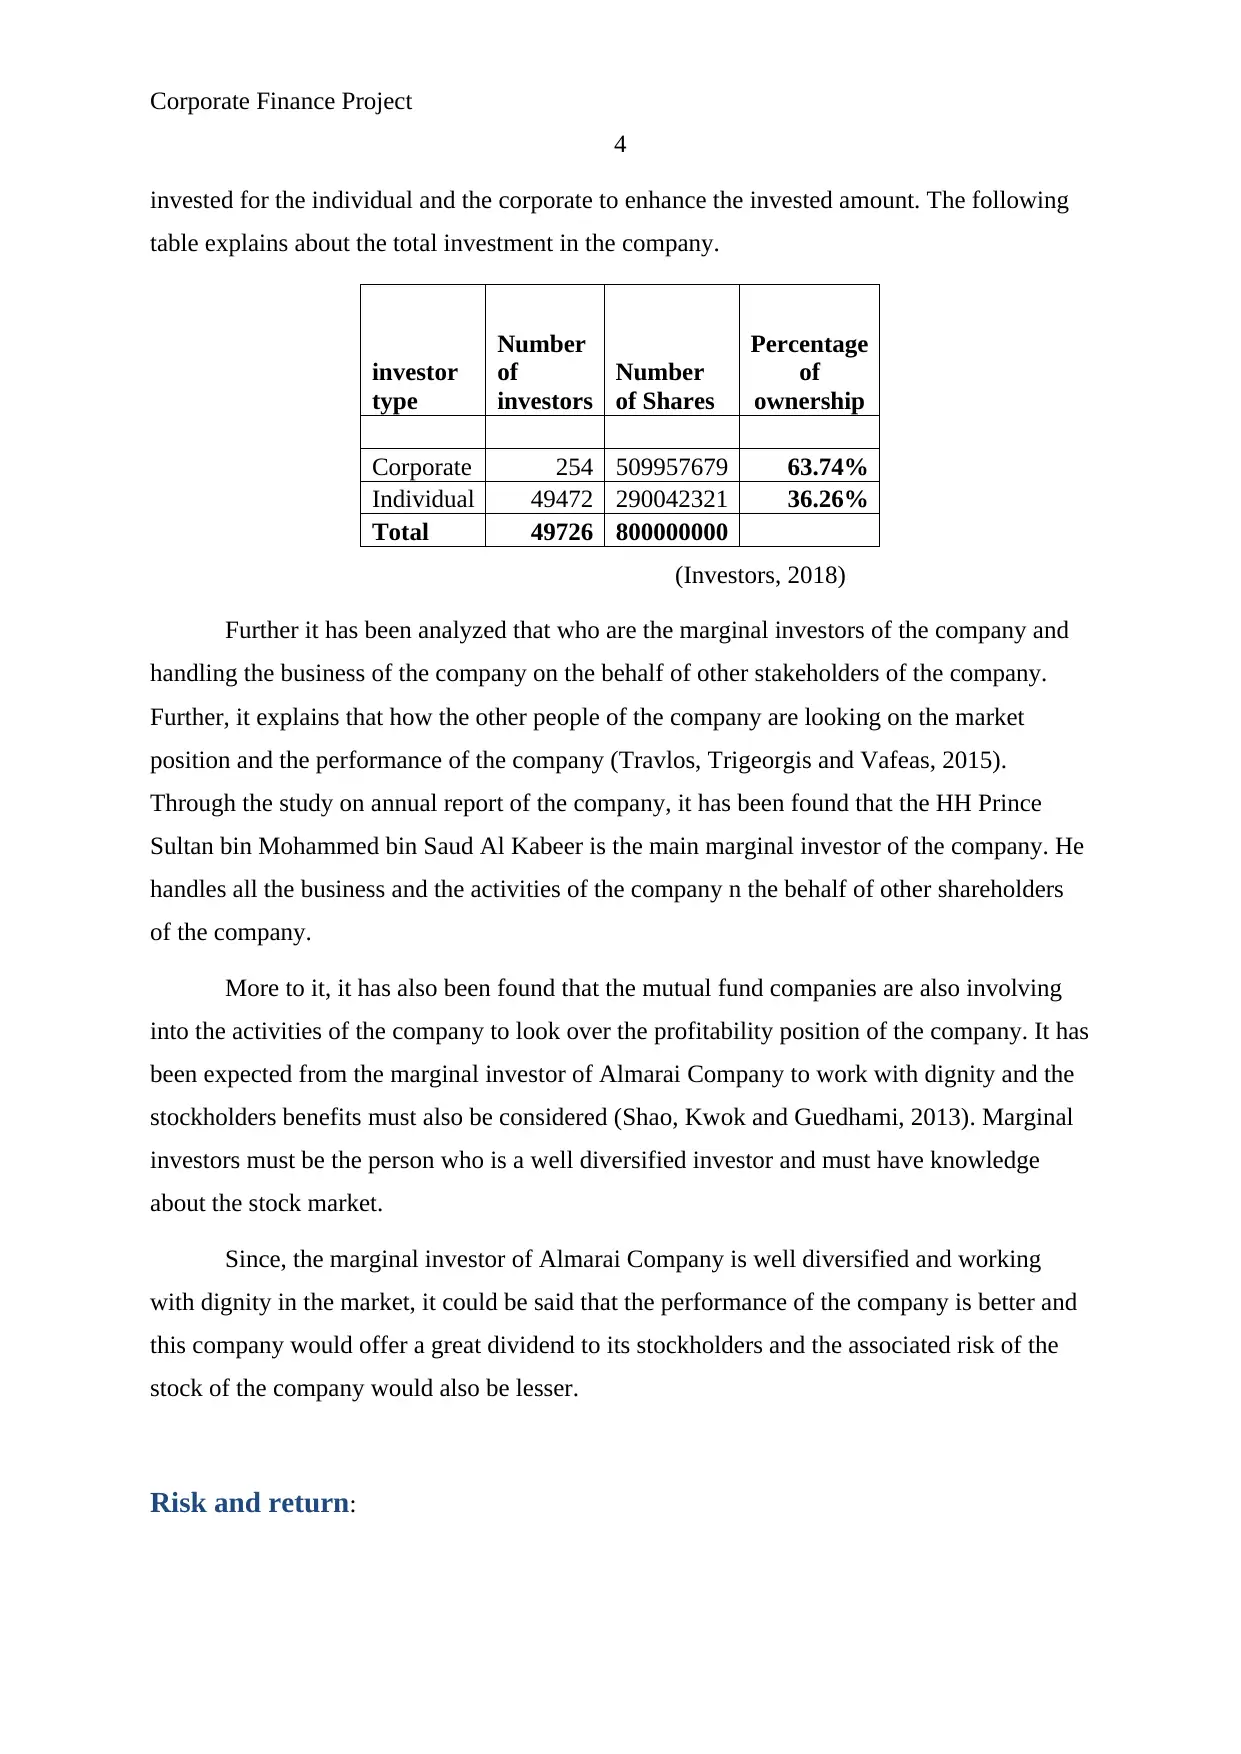
invested for the individual and the corporate to enhance the invested amount. The following
table explains about the total investment in the company.
investor
type
Number
of
investors
Number
of Shares
Percentage
of
ownership
Corporate 254 509957679 63.74%
Individual 49472 290042321 36.26%
Total 49726 800000000
(Investors, 2018)
Further it has been analyzed that who are the marginal investors of the company and
handling the business of the company on the behalf of other stakeholders of the company.
Further, it explains that how the other people of the company are looking on the market
position and the performance of the company (Travlos, Trigeorgis and Vafeas, 2015).
Through the study on annual report of the company, it has been found that the HH Prince
Sultan bin Mohammed bin Saud Al Kabeer is the main marginal investor of the company. He
handles all the business and the activities of the company n the behalf of other shareholders
of the company.
More to it, it has also been found that the mutual fund companies are also involving
into the activities of the company to look over the profitability position of the company. It has
been expected from the marginal investor of Almarai Company to work with dignity and the
stockholders benefits must also be considered (Shao, Kwok and Guedhami, 2013). Marginal
investors must be the person who is a well diversified investor and must have knowledge
about the stock market.
Since, the marginal investor of Almarai Company is well diversified and working
with dignity in the market, it could be said that the performance of the company is better and
this company would offer a great dividend to its stockholders and the associated risk of the
stock of the company would also be lesser.
Risk and return:
4
invested for the individual and the corporate to enhance the invested amount. The following
table explains about the total investment in the company.
investor
type
Number
of
investors
Number
of Shares
Percentage
of
ownership
Corporate 254 509957679 63.74%
Individual 49472 290042321 36.26%
Total 49726 800000000
(Investors, 2018)
Further it has been analyzed that who are the marginal investors of the company and
handling the business of the company on the behalf of other stakeholders of the company.
Further, it explains that how the other people of the company are looking on the market
position and the performance of the company (Travlos, Trigeorgis and Vafeas, 2015).
Through the study on annual report of the company, it has been found that the HH Prince
Sultan bin Mohammed bin Saud Al Kabeer is the main marginal investor of the company. He
handles all the business and the activities of the company n the behalf of other shareholders
of the company.
More to it, it has also been found that the mutual fund companies are also involving
into the activities of the company to look over the profitability position of the company. It has
been expected from the marginal investor of Almarai Company to work with dignity and the
stockholders benefits must also be considered (Shao, Kwok and Guedhami, 2013). Marginal
investors must be the person who is a well diversified investor and must have knowledge
about the stock market.
Since, the marginal investor of Almarai Company is well diversified and working
with dignity in the market, it could be said that the performance of the company is better and
this company would offer a great dividend to its stockholders and the associated risk of the
stock of the company would also be lesser.
Risk and return:
Paraphrase This Document
Need a fresh take? Get an instant paraphrase of this document with our AI Paraphraser
Corporate Finance Project
5
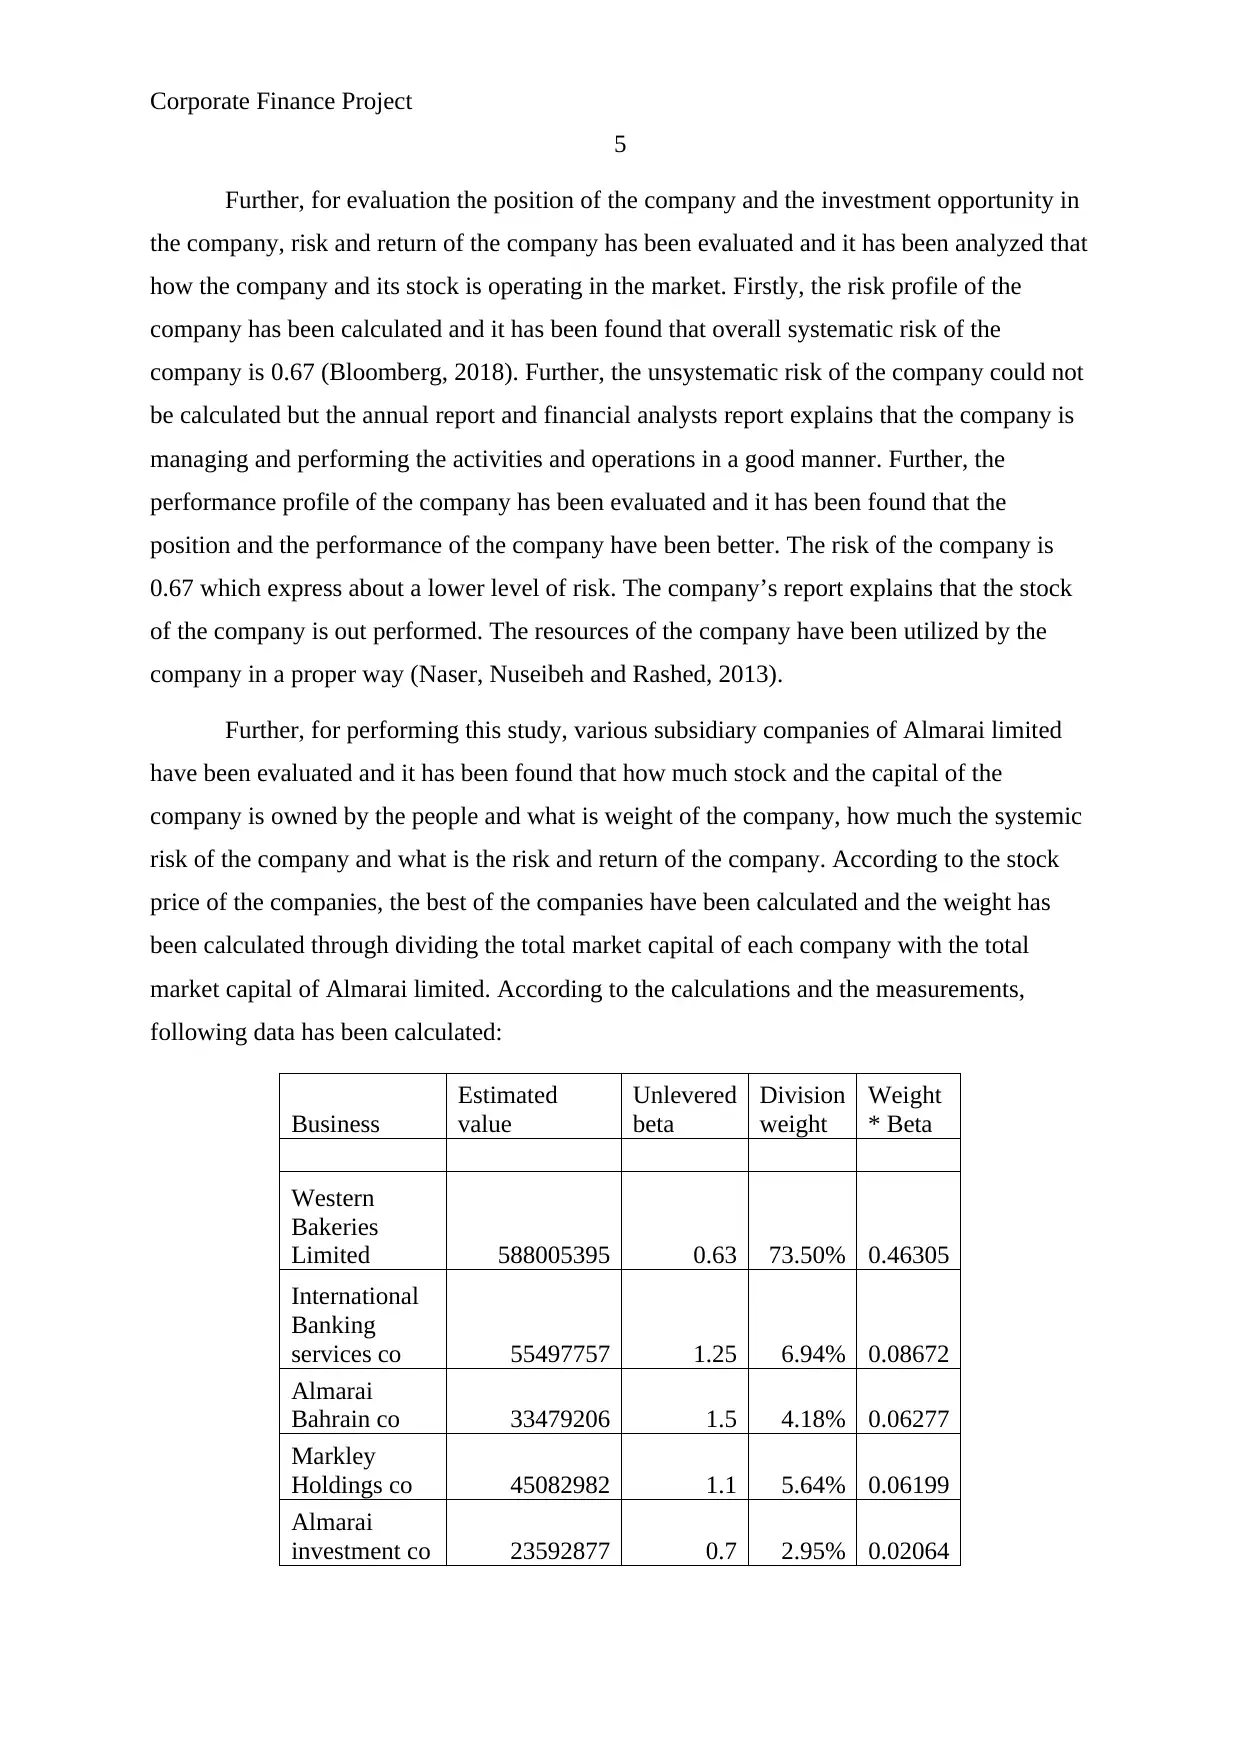
Further, for evaluation the position of the company and the investment opportunity in
the company, risk and return of the company has been evaluated and it has been analyzed that
how the company and its stock is operating in the market. Firstly, the risk profile of the
company has been calculated and it has been found that overall systematic risk of the
company is 0.67 (Bloomberg, 2018). Further, the unsystematic risk of the company could not
be calculated but the annual report and financial analysts report explains that the company is
managing and performing the activities and operations in a good manner. Further, the
performance profile of the company has been evaluated and it has been found that the
position and the performance of the company have been better. The risk of the company is
0.67 which express about a lower level of risk. The company’s report explains that the stock
of the company is out performed. The resources of the company have been utilized by the
company in a proper way (Naser, Nuseibeh and Rashed, 2013).
Further, for performing this study, various subsidiary companies of Almarai limited
have been evaluated and it has been found that how much stock and the capital of the
company is owned by the people and what is weight of the company, how much the systemic
risk of the company and what is the risk and return of the company. According to the stock
price of the companies, the best of the companies have been calculated and the weight has
been calculated through dividing the total market capital of each company with the total
market capital of Almarai limited. According to the calculations and the measurements,
following data has been calculated:
Business
Estimated
value
Unlevered
beta
Division
weight
Weight
* Beta
Western
Bakeries
Limited 588005395 0.63 73.50% 0.46305
International
Banking
services co 55497757 1.25 6.94% 0.08672
Almarai
Bahrain co 33479206 1.5 4.18% 0.06277
Markley
Holdings co 45082982 1.1 5.64% 0.06199
Almarai
investment co 23592877 0.7 2.95% 0.02064
5
Further, for evaluation the position of the company and the investment opportunity in
the company, risk and return of the company has been evaluated and it has been analyzed that
how the company and its stock is operating in the market. Firstly, the risk profile of the
company has been calculated and it has been found that overall systematic risk of the
company is 0.67 (Bloomberg, 2018). Further, the unsystematic risk of the company could not
be calculated but the annual report and financial analysts report explains that the company is
managing and performing the activities and operations in a good manner. Further, the
performance profile of the company has been evaluated and it has been found that the
position and the performance of the company have been better. The risk of the company is
0.67 which express about a lower level of risk. The company’s report explains that the stock
of the company is out performed. The resources of the company have been utilized by the
company in a proper way (Naser, Nuseibeh and Rashed, 2013).
Further, for performing this study, various subsidiary companies of Almarai limited
have been evaluated and it has been found that how much stock and the capital of the
company is owned by the people and what is weight of the company, how much the systemic
risk of the company and what is the risk and return of the company. According to the stock
price of the companies, the best of the companies have been calculated and the weight has
been calculated through dividing the total market capital of each company with the total
market capital of Almarai limited. According to the calculations and the measurements,
following data has been calculated:
Business
Estimated
value
Unlevered
beta
Division
weight
Weight
* Beta
Western
Bakeries
Limited 588005395 0.63 73.50% 0.46305
International
Banking
services co 55497757 1.25 6.94% 0.08672
Almarai
Bahrain co 33479206 1.5 4.18% 0.06277
Markley
Holdings co 45082982 1.1 5.64% 0.06199
Almarai
investment co 23592877 0.7 2.95% 0.02064
Corporate Finance Project
6
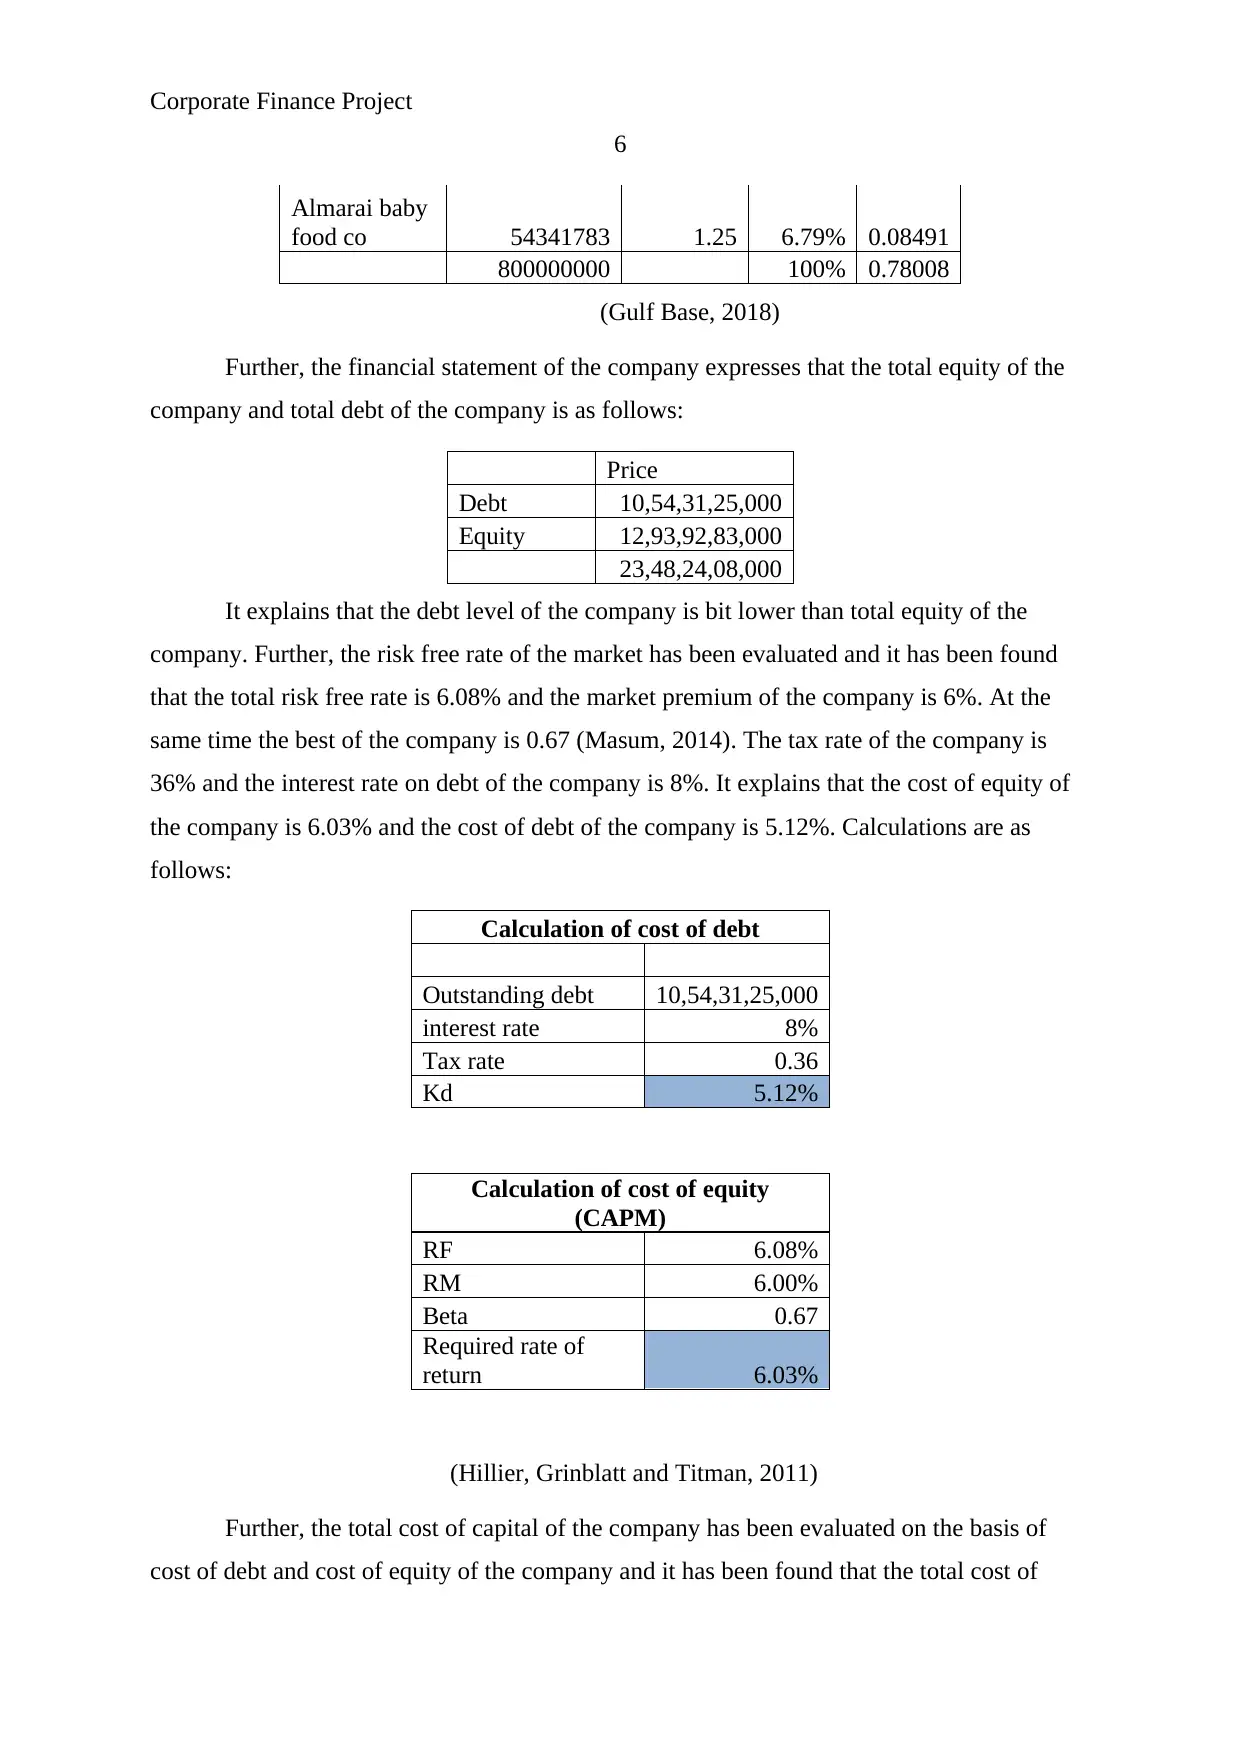
Almarai baby
food co 54341783 1.25 6.79% 0.08491
800000000 100% 0.78008
(Gulf Base, 2018)
Further, the financial statement of the company expresses that the total equity of the
company and total debt of the company is as follows:
Price
Debt 10,54,31,25,000
Equity 12,93,92,83,000
23,48,24,08,000
It explains that the debt level of the company is bit lower than total equity of the
company. Further, the risk free rate of the market has been evaluated and it has been found
that the total risk free rate is 6.08% and the market premium of the company is 6%. At the
same time the best of the company is 0.67 (Masum, 2014). The tax rate of the company is
36% and the interest rate on debt of the company is 8%. It explains that the cost of equity of
the company is 6.03% and the cost of debt of the company is 5.12%. Calculations are as
follows:
Calculation of cost of debt
Outstanding debt 10,54,31,25,000
interest rate 8%
Tax rate 0.36
Kd 5.12%
Calculation of cost of equity
(CAPM)
RF 6.08%
RM 6.00%
Beta 0.67
Required rate of
return 6.03%
(Hillier, Grinblatt and Titman, 2011)
Further, the total cost of capital of the company has been evaluated on the basis of
cost of debt and cost of equity of the company and it has been found that the total cost of
6
Almarai baby
food co 54341783 1.25 6.79% 0.08491
800000000 100% 0.78008
(Gulf Base, 2018)
Further, the financial statement of the company expresses that the total equity of the
company and total debt of the company is as follows:
Price
Debt 10,54,31,25,000
Equity 12,93,92,83,000
23,48,24,08,000
It explains that the debt level of the company is bit lower than total equity of the
company. Further, the risk free rate of the market has been evaluated and it has been found
that the total risk free rate is 6.08% and the market premium of the company is 6%. At the
same time the best of the company is 0.67 (Masum, 2014). The tax rate of the company is
36% and the interest rate on debt of the company is 8%. It explains that the cost of equity of
the company is 6.03% and the cost of debt of the company is 5.12%. Calculations are as
follows:
Calculation of cost of debt
Outstanding debt 10,54,31,25,000
interest rate 8%
Tax rate 0.36
Kd 5.12%
Calculation of cost of equity
(CAPM)
RF 6.08%
RM 6.00%
Beta 0.67
Required rate of
return 6.03%
(Hillier, Grinblatt and Titman, 2011)
Further, the total cost of capital of the company has been evaluated on the basis of
cost of debt and cost of equity of the company and it has been found that the total cost of
⊘ This is a preview!⊘
Do you want full access?
Subscribe today to unlock all pages.
Trusted by 1+ million students worldwide
Corporate Finance Project
7
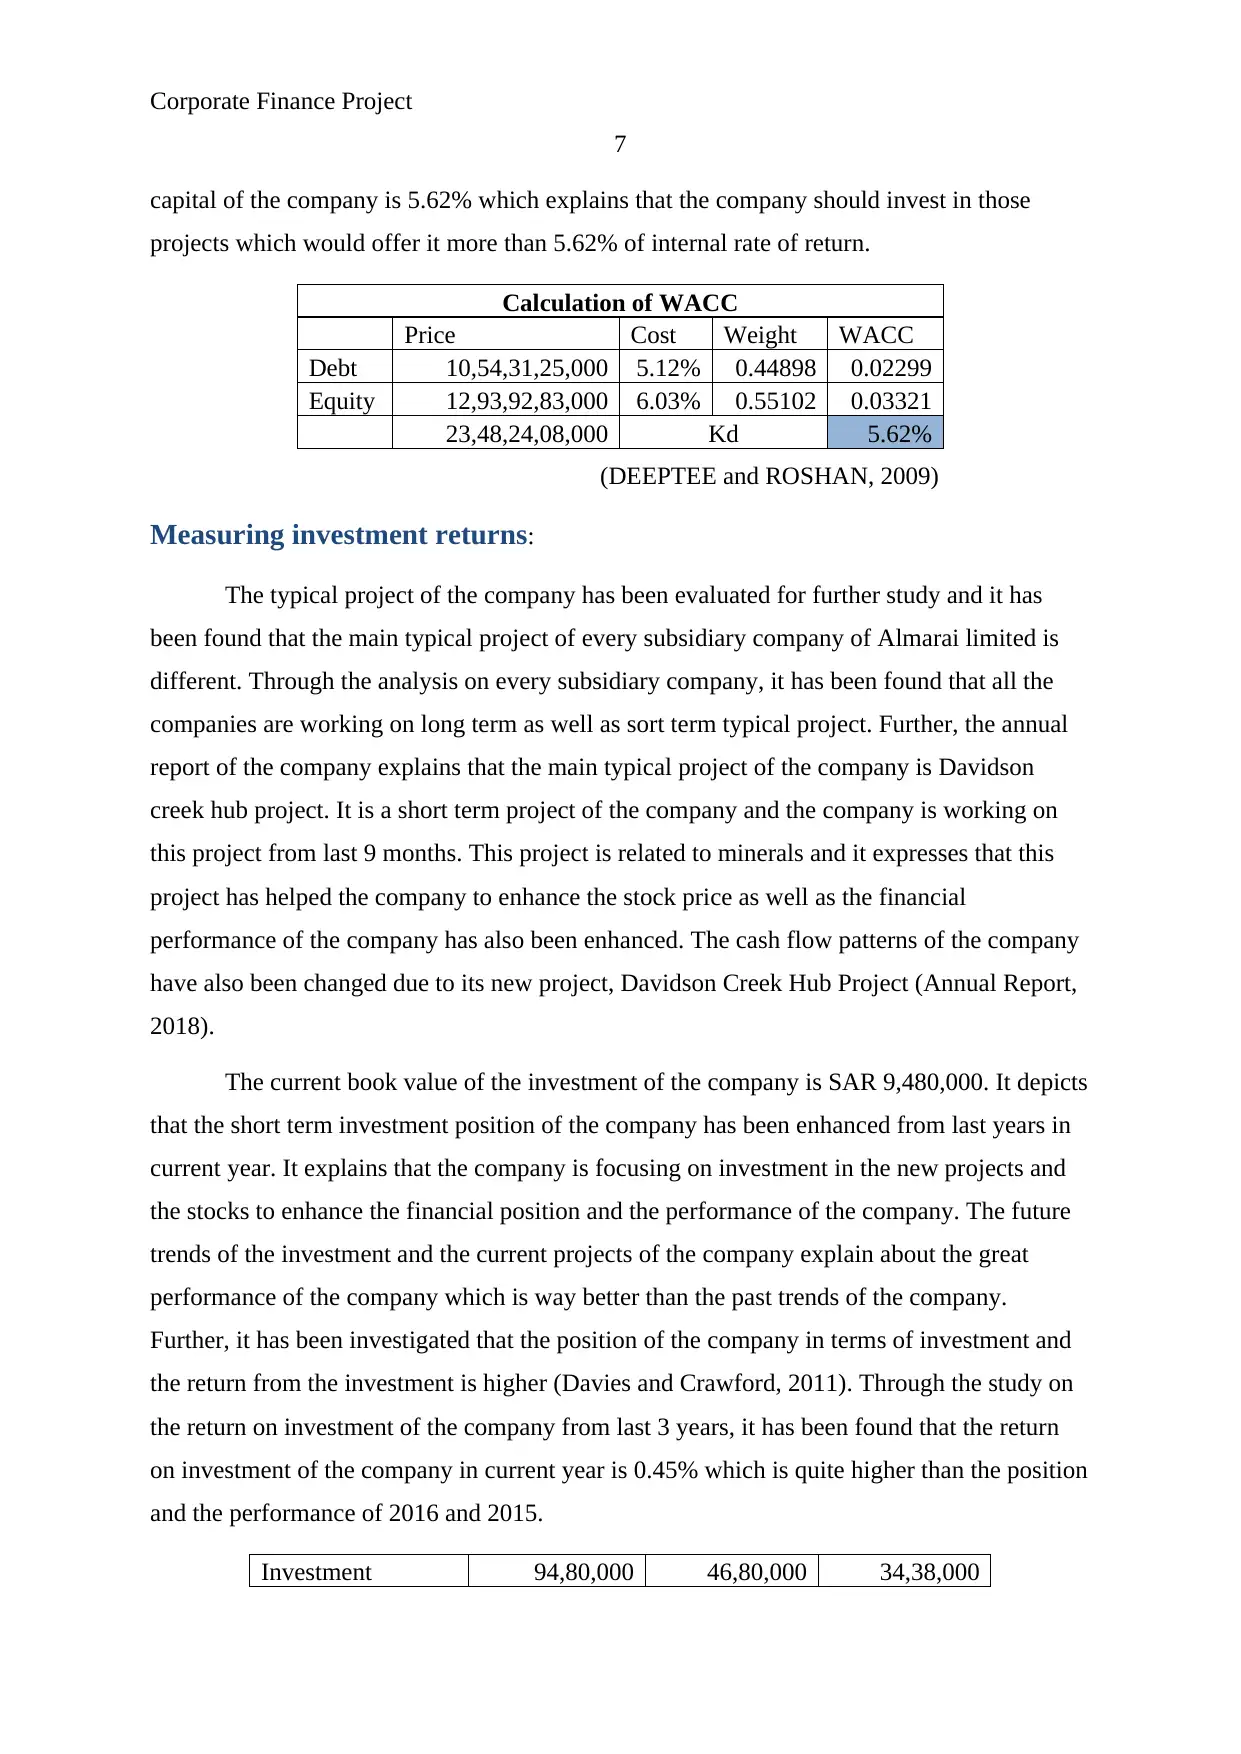
capital of the company is 5.62% which explains that the company should invest in those
projects which would offer it more than 5.62% of internal rate of return.
Calculation of WACC
Price Cost Weight WACC
Debt 10,54,31,25,000 5.12% 0.44898 0.02299
Equity 12,93,92,83,000 6.03% 0.55102 0.03321
23,48,24,08,000 Kd 5.62%
(DEEPTEE and ROSHAN, 2009)
Measuring investment returns:
The typical project of the company has been evaluated for further study and it has
been found that the main typical project of every subsidiary company of Almarai limited is
different. Through the analysis on every subsidiary company, it has been found that all the
companies are working on long term as well as sort term typical project. Further, the annual
report of the company explains that the main typical project of the company is Davidson
creek hub project. It is a short term project of the company and the company is working on
this project from last 9 months. This project is related to minerals and it expresses that this
project has helped the company to enhance the stock price as well as the financial
performance of the company has also been enhanced. The cash flow patterns of the company
have also been changed due to its new project, Davidson Creek Hub Project (Annual Report,
2018).
The current book value of the investment of the company is SAR 9,480,000. It depicts
that the short term investment position of the company has been enhanced from last years in
current year. It explains that the company is focusing on investment in the new projects and
the stocks to enhance the financial position and the performance of the company. The future
trends of the investment and the current projects of the company explain about the great
performance of the company which is way better than the past trends of the company.
Further, it has been investigated that the position of the company in terms of investment and
the return from the investment is higher (Davies and Crawford, 2011). Through the study on
the return on investment of the company from last 3 years, it has been found that the return
on investment of the company in current year is 0.45% which is quite higher than the position
and the performance of 2016 and 2015.
Investment 94,80,000 46,80,000 34,38,000
7
capital of the company is 5.62% which explains that the company should invest in those
projects which would offer it more than 5.62% of internal rate of return.
Calculation of WACC
Price Cost Weight WACC
Debt 10,54,31,25,000 5.12% 0.44898 0.02299
Equity 12,93,92,83,000 6.03% 0.55102 0.03321
23,48,24,08,000 Kd 5.62%
(DEEPTEE and ROSHAN, 2009)
Measuring investment returns:
The typical project of the company has been evaluated for further study and it has
been found that the main typical project of every subsidiary company of Almarai limited is
different. Through the analysis on every subsidiary company, it has been found that all the
companies are working on long term as well as sort term typical project. Further, the annual
report of the company explains that the main typical project of the company is Davidson
creek hub project. It is a short term project of the company and the company is working on
this project from last 9 months. This project is related to minerals and it expresses that this
project has helped the company to enhance the stock price as well as the financial
performance of the company has also been enhanced. The cash flow patterns of the company
have also been changed due to its new project, Davidson Creek Hub Project (Annual Report,
2018).
The current book value of the investment of the company is SAR 9,480,000. It depicts
that the short term investment position of the company has been enhanced from last years in
current year. It explains that the company is focusing on investment in the new projects and
the stocks to enhance the financial position and the performance of the company. The future
trends of the investment and the current projects of the company explain about the great
performance of the company which is way better than the past trends of the company.
Further, it has been investigated that the position of the company in terms of investment and
the return from the investment is higher (Davies and Crawford, 2011). Through the study on
the return on investment of the company from last 3 years, it has been found that the return
on investment of the company in current year is 0.45% which is quite higher than the position
and the performance of 2016 and 2015.
Investment 94,80,000 46,80,000 34,38,000
Paraphrase This Document
Need a fresh take? Get an instant paraphrase of this document with our AI Paraphraser
Corporate Finance Project
8
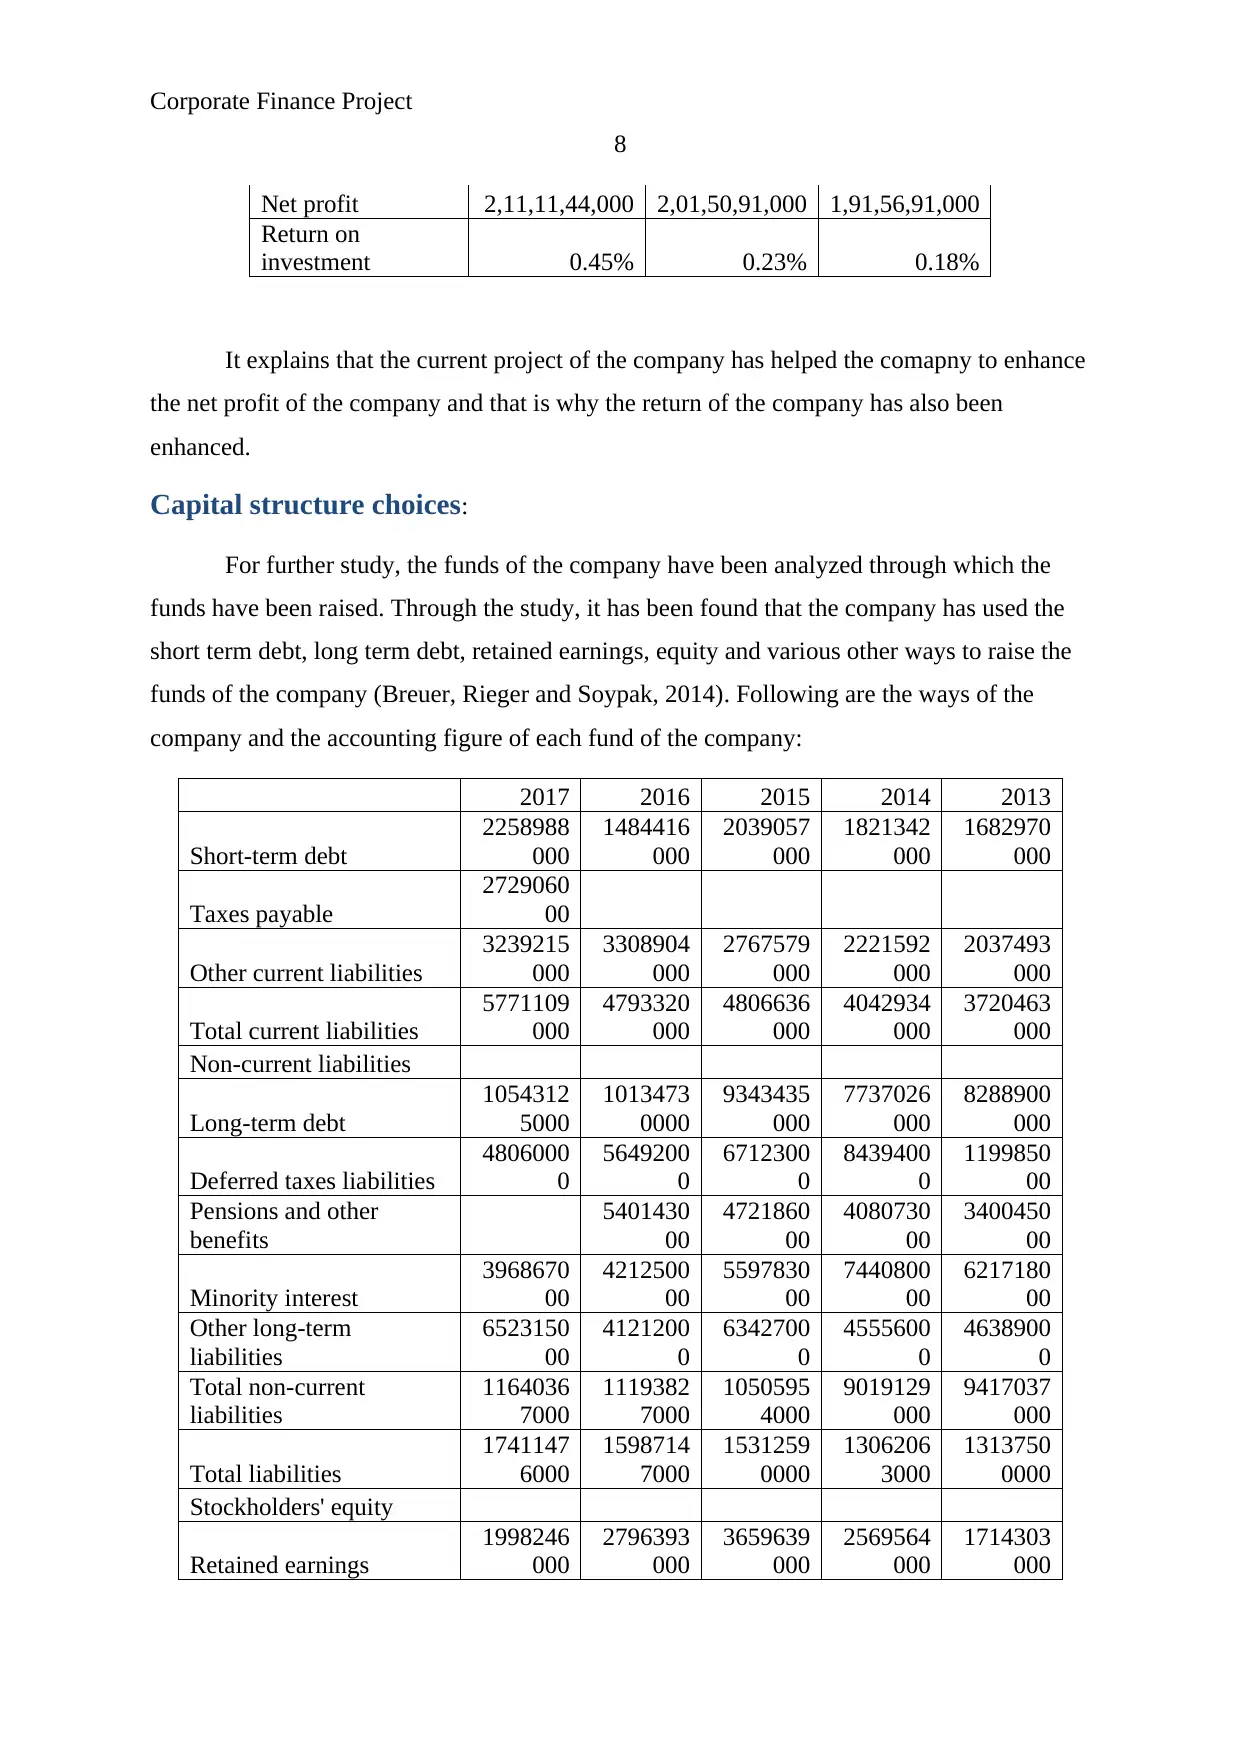
Net profit 2,11,11,44,000 2,01,50,91,000 1,91,56,91,000
Return on
investment 0.45% 0.23% 0.18%
It explains that the current project of the company has helped the comapny to enhance
the net profit of the company and that is why the return of the company has also been
enhanced.
Capital structure choices:
For further study, the funds of the company have been analyzed through which the
funds have been raised. Through the study, it has been found that the company has used the
short term debt, long term debt, retained earnings, equity and various other ways to raise the
funds of the company (Breuer, Rieger and Soypak, 2014). Following are the ways of the
company and the accounting figure of each fund of the company:
2017 2016 2015 2014 2013
Short-term debt
2258988
000
1484416
000
2039057
000
1821342
000
1682970
000
Taxes payable
2729060
00
Other current liabilities
3239215
000
3308904
000
2767579
000
2221592
000
2037493
000
Total current liabilities
5771109
000
4793320
000
4806636
000
4042934
000
3720463
000
Non-current liabilities
Long-term debt
1054312
5000
1013473
0000
9343435
000
7737026
000
8288900
000
Deferred taxes liabilities
4806000
0
5649200
0
6712300
0
8439400
0
1199850
00
Pensions and other
benefits
5401430
00
4721860
00
4080730
00
3400450
00
Minority interest
3968670
00
4212500
00
5597830
00
7440800
00
6217180
00
Other long-term
liabilities
6523150
00
4121200
0
6342700
0
4555600
0
4638900
0
Total non-current
liabilities
1164036
7000
1119382
7000
1050595
4000
9019129
000
9417037
000
Total liabilities
1741147
6000
1598714
7000
1531259
0000
1306206
3000
1313750
0000
Stockholders' equity
Retained earnings
1998246
000
2796393
000
3659639
000
2569564
000
1714303
000
8
Net profit 2,11,11,44,000 2,01,50,91,000 1,91,56,91,000
Return on
investment 0.45% 0.23% 0.18%
It explains that the current project of the company has helped the comapny to enhance
the net profit of the company and that is why the return of the company has also been
enhanced.
Capital structure choices:
For further study, the funds of the company have been analyzed through which the
funds have been raised. Through the study, it has been found that the company has used the
short term debt, long term debt, retained earnings, equity and various other ways to raise the
funds of the company (Breuer, Rieger and Soypak, 2014). Following are the ways of the
company and the accounting figure of each fund of the company:
2017 2016 2015 2014 2013
Short-term debt
2258988
000
1484416
000
2039057
000
1821342
000
1682970
000
Taxes payable
2729060
00
Other current liabilities
3239215
000
3308904
000
2767579
000
2221592
000
2037493
000
Total current liabilities
5771109
000
4793320
000
4806636
000
4042934
000
3720463
000
Non-current liabilities
Long-term debt
1054312
5000
1013473
0000
9343435
000
7737026
000
8288900
000
Deferred taxes liabilities
4806000
0
5649200
0
6712300
0
8439400
0
1199850
00
Pensions and other
benefits
5401430
00
4721860
00
4080730
00
3400450
00
Minority interest
3968670
00
4212500
00
5597830
00
7440800
00
6217180
00
Other long-term
liabilities
6523150
00
4121200
0
6342700
0
4555600
0
4638900
0
Total non-current
liabilities
1164036
7000
1119382
7000
1050595
4000
9019129
000
9417037
000
Total liabilities
1741147
6000
1598714
7000
1531259
0000
1306206
3000
1313750
0000
Stockholders' equity
Retained earnings
1998246
000
2796393
000
3659639
000
2569564
000
1714303
000
Corporate Finance Project
9
Treasury stock
-
4531560
00
-
3789940
00
-
3306990
00
-
1463860
00
-
1463860
00
Accumulated other
comprehensive income
1293928
3000
1061819
4000
8729505
000
8463674
000
8574553
000
Total stockholders' equity
1448437
3000
1303559
3000
1205844
5000
1088685
2000
1014247
0000
Total liabilities and
stockholders' equity
3189584
9000
2902274
0000
2737103
5000
2394891
5000
2327997
0000
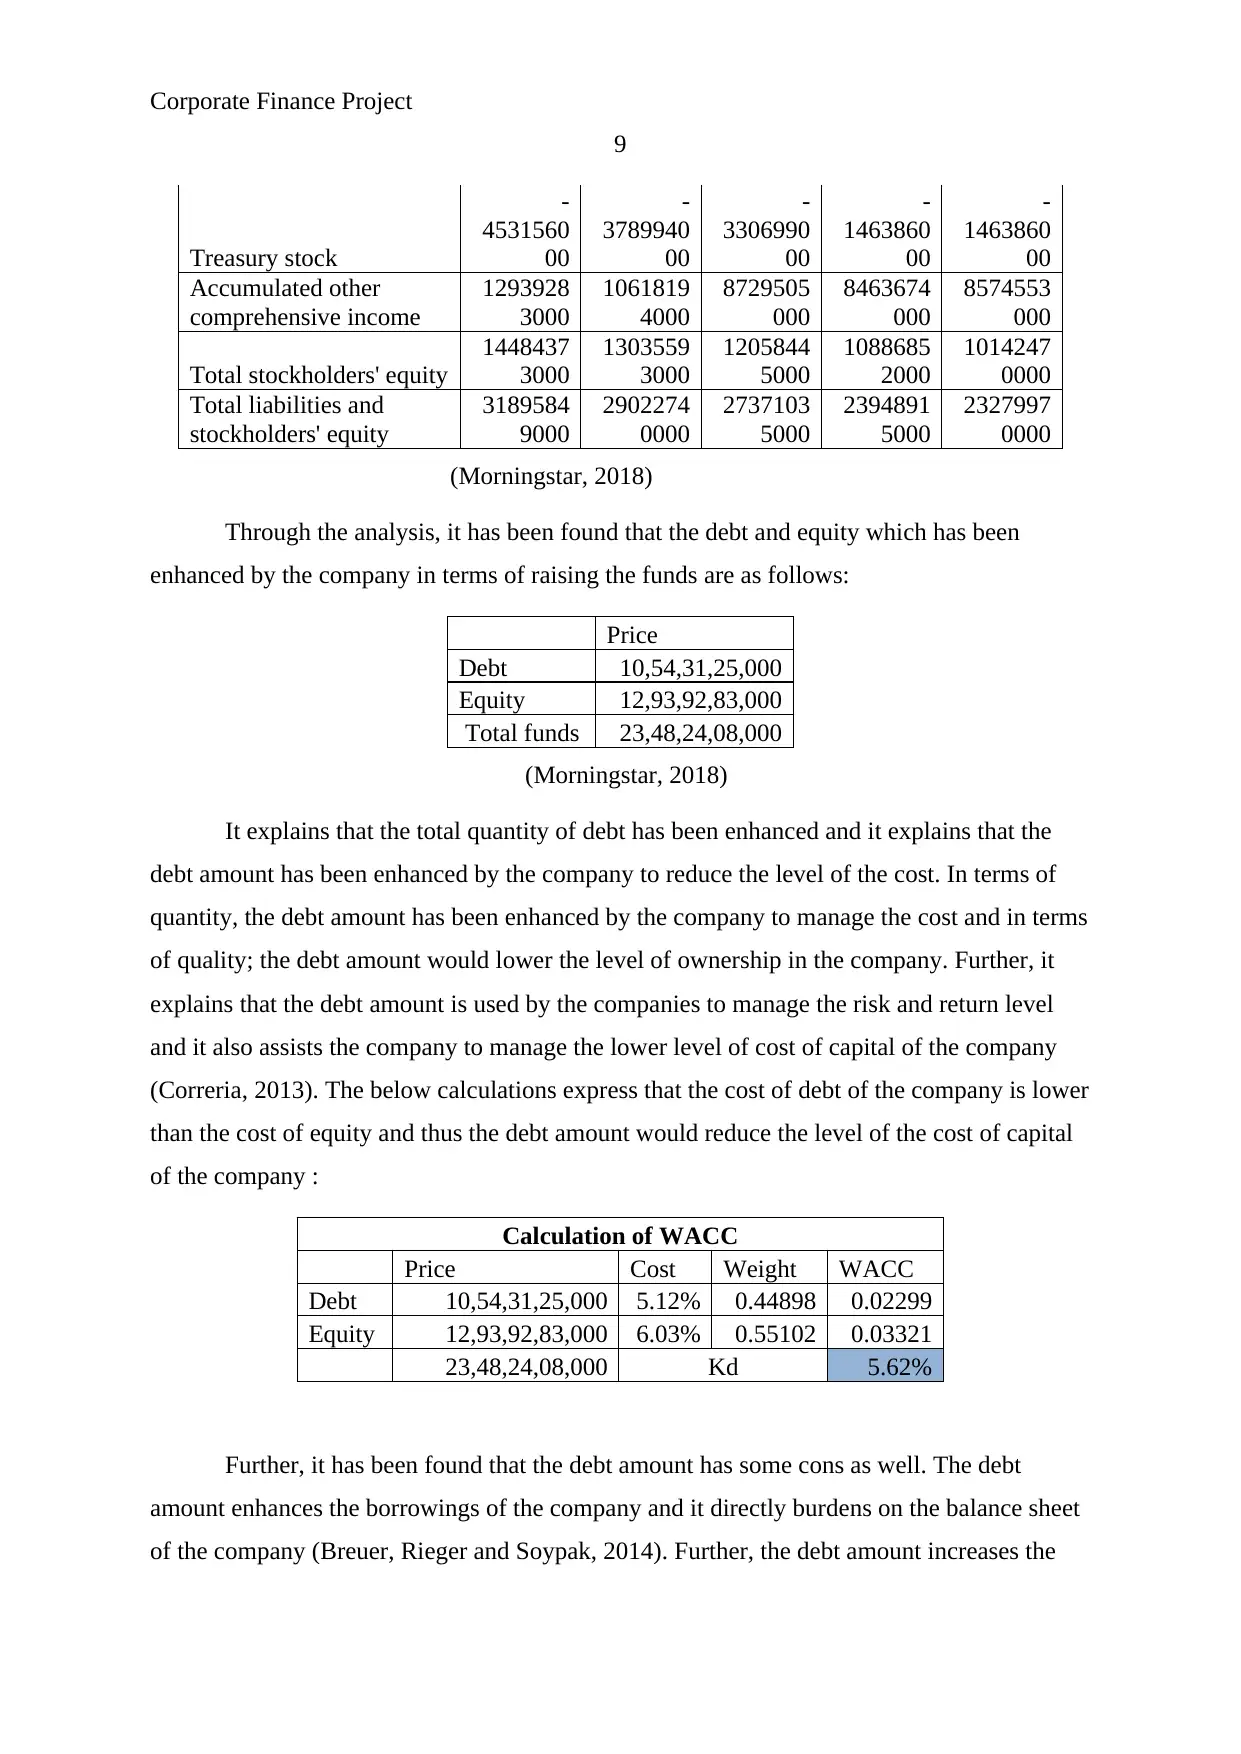
(Morningstar, 2018)
Through the analysis, it has been found that the debt and equity which has been
enhanced by the company in terms of raising the funds are as follows:
Price
Debt 10,54,31,25,000
Equity 12,93,92,83,000
Total funds 23,48,24,08,000
(Morningstar, 2018)
It explains that the total quantity of debt has been enhanced and it explains that the
debt amount has been enhanced by the company to reduce the level of the cost. In terms of
quantity, the debt amount has been enhanced by the company to manage the cost and in terms
of quality; the debt amount would lower the level of ownership in the company. Further, it
explains that the debt amount is used by the companies to manage the risk and return level
and it also assists the company to manage the lower level of cost of capital of the company
(Correria, 2013). The below calculations express that the cost of debt of the company is lower
than the cost of equity and thus the debt amount would reduce the level of the cost of capital
of the company :
Calculation of WACC
Price Cost Weight WACC
Debt 10,54,31,25,000 5.12% 0.44898 0.02299
Equity 12,93,92,83,000 6.03% 0.55102 0.03321
23,48,24,08,000 Kd 5.62%
Further, it has been found that the debt amount has some cons as well. The debt
amount enhances the borrowings of the company and it directly burdens on the balance sheet
of the company (Breuer, Rieger and Soypak, 2014). Further, the debt amount increases the
9
Treasury stock
-
4531560
00
-
3789940
00
-
3306990
00
-
1463860
00
-
1463860
00
Accumulated other
comprehensive income
1293928
3000
1061819
4000
8729505
000
8463674
000
8574553
000
Total stockholders' equity
1448437
3000
1303559
3000
1205844
5000
1088685
2000
1014247
0000
Total liabilities and
stockholders' equity
3189584
9000
2902274
0000
2737103
5000
2394891
5000
2327997
0000
(Morningstar, 2018)
Through the analysis, it has been found that the debt and equity which has been
enhanced by the company in terms of raising the funds are as follows:
Price
Debt 10,54,31,25,000
Equity 12,93,92,83,000
Total funds 23,48,24,08,000
(Morningstar, 2018)
It explains that the total quantity of debt has been enhanced and it explains that the
debt amount has been enhanced by the company to reduce the level of the cost. In terms of
quantity, the debt amount has been enhanced by the company to manage the cost and in terms
of quality; the debt amount would lower the level of ownership in the company. Further, it
explains that the debt amount is used by the companies to manage the risk and return level
and it also assists the company to manage the lower level of cost of capital of the company
(Correria, 2013). The below calculations express that the cost of debt of the company is lower
than the cost of equity and thus the debt amount would reduce the level of the cost of capital
of the company :
Calculation of WACC
Price Cost Weight WACC
Debt 10,54,31,25,000 5.12% 0.44898 0.02299
Equity 12,93,92,83,000 6.03% 0.55102 0.03321
23,48,24,08,000 Kd 5.62%
Further, it has been found that the debt amount has some cons as well. The debt
amount enhances the borrowings of the company and it directly burdens on the balance sheet
of the company (Breuer, Rieger and Soypak, 2014). Further, the debt amount increases the
⊘ This is a preview!⊘
Do you want full access?
Subscribe today to unlock all pages.
Trusted by 1+ million students worldwide
Corporate Finance Project
10
risk of the company as it is required for the company to pay the debt amount to the debt
holders after a period of time.
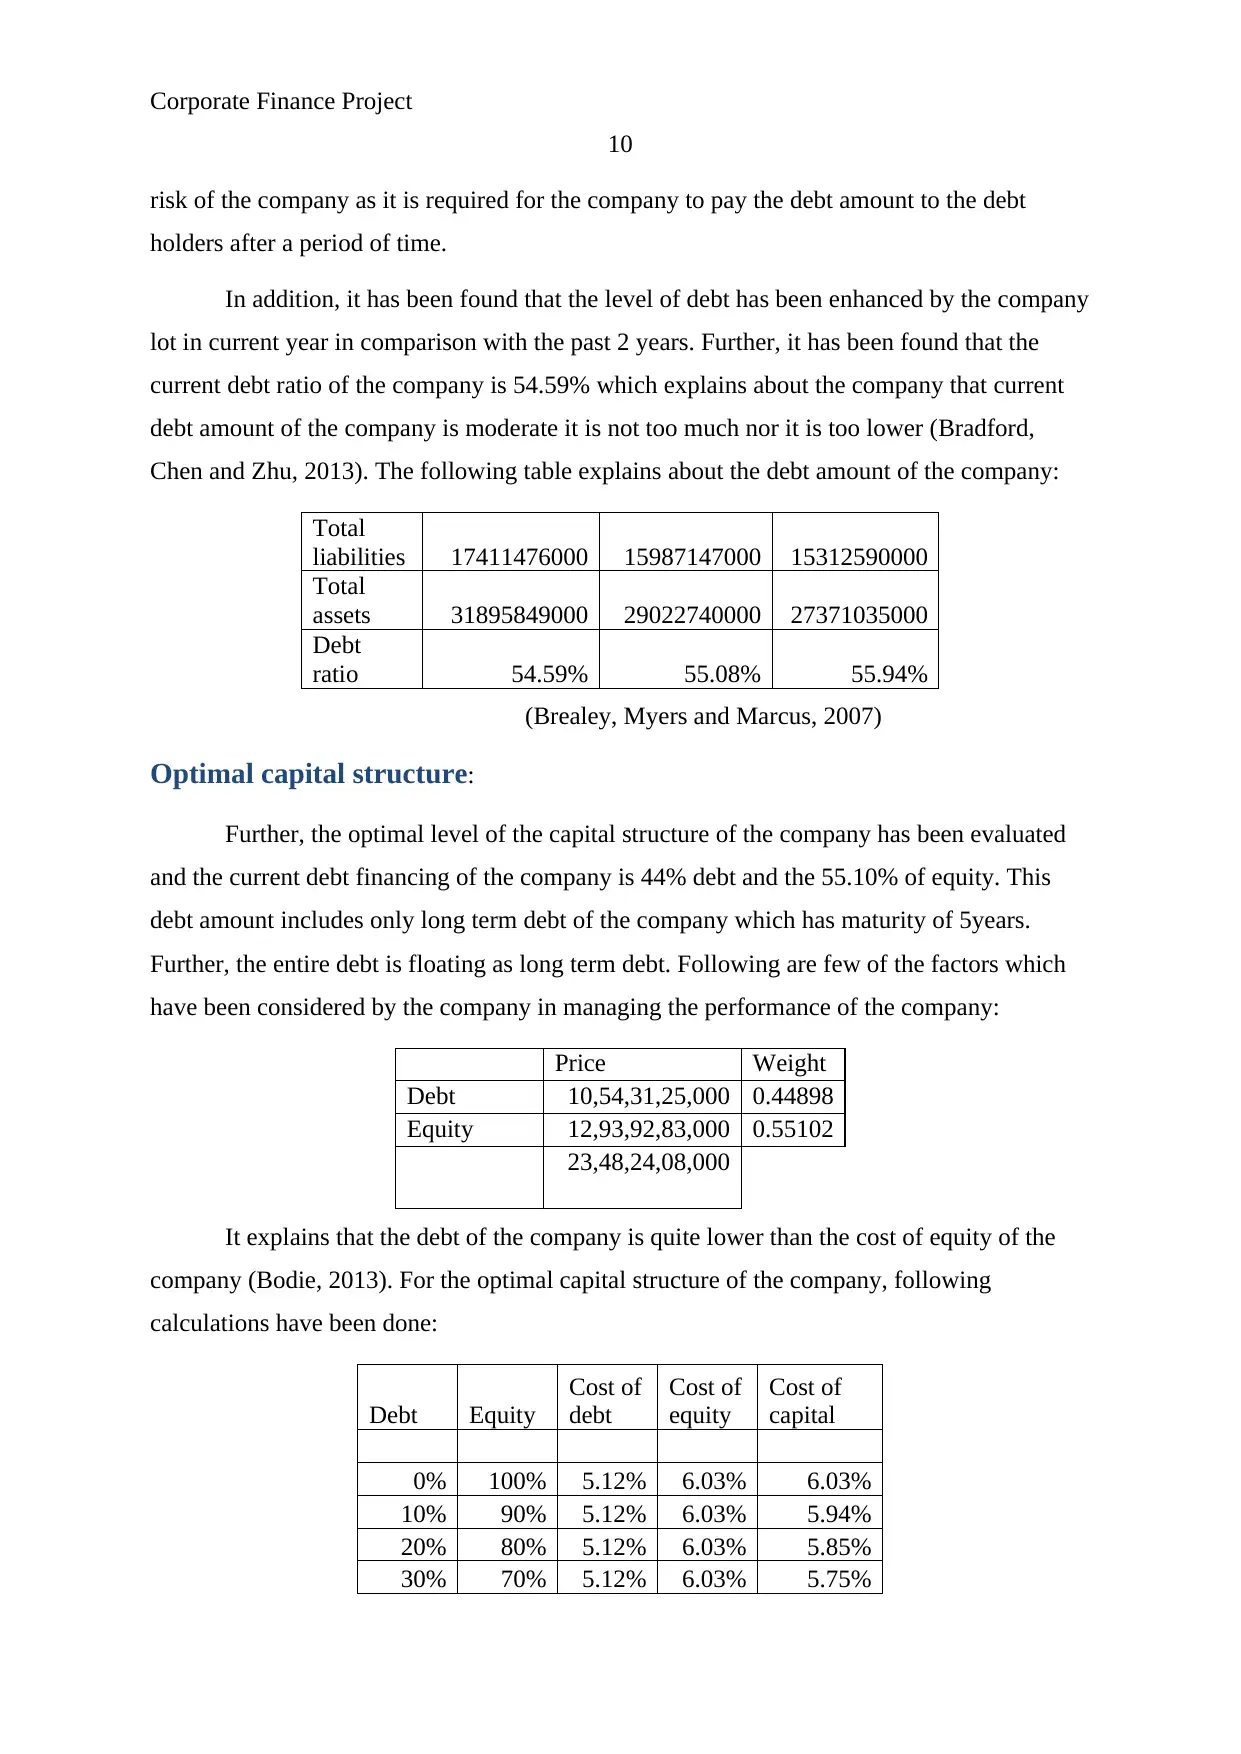
In addition, it has been found that the level of debt has been enhanced by the company
lot in current year in comparison with the past 2 years. Further, it has been found that the
current debt ratio of the company is 54.59% which explains about the company that current
debt amount of the company is moderate it is not too much nor it is too lower (Bradford,
Chen and Zhu, 2013). The following table explains about the debt amount of the company:
Total
liabilities 17411476000 15987147000 15312590000
Total
assets 31895849000 29022740000 27371035000
Debt
ratio 54.59% 55.08% 55.94%
(Brealey, Myers and Marcus, 2007)
Optimal capital structure:
Further, the optimal level of the capital structure of the company has been evaluated
and the current debt financing of the company is 44% debt and the 55.10% of equity. This
debt amount includes only long term debt of the company which has maturity of 5years.
Further, the entire debt is floating as long term debt. Following are few of the factors which
have been considered by the company in managing the performance of the company:
Price Weight
Debt 10,54,31,25,000 0.44898
Equity 12,93,92,83,000 0.55102
23,48,24,08,000
It explains that the debt of the company is quite lower than the cost of equity of the
company (Bodie, 2013). For the optimal capital structure of the company, following
calculations have been done:
Debt Equity
Cost of
debt
Cost of
equity
Cost of
capital
0% 100% 5.12% 6.03% 6.03%
10% 90% 5.12% 6.03% 5.94%
20% 80% 5.12% 6.03% 5.85%
30% 70% 5.12% 6.03% 5.75%
10
risk of the company as it is required for the company to pay the debt amount to the debt
holders after a period of time.
In addition, it has been found that the level of debt has been enhanced by the company
lot in current year in comparison with the past 2 years. Further, it has been found that the
current debt ratio of the company is 54.59% which explains about the company that current
debt amount of the company is moderate it is not too much nor it is too lower (Bradford,
Chen and Zhu, 2013). The following table explains about the debt amount of the company:
Total
liabilities 17411476000 15987147000 15312590000
Total
assets 31895849000 29022740000 27371035000
Debt
ratio 54.59% 55.08% 55.94%
(Brealey, Myers and Marcus, 2007)
Optimal capital structure:
Further, the optimal level of the capital structure of the company has been evaluated
and the current debt financing of the company is 44% debt and the 55.10% of equity. This
debt amount includes only long term debt of the company which has maturity of 5years.
Further, the entire debt is floating as long term debt. Following are few of the factors which
have been considered by the company in managing the performance of the company:
Price Weight
Debt 10,54,31,25,000 0.44898
Equity 12,93,92,83,000 0.55102
23,48,24,08,000
It explains that the debt of the company is quite lower than the cost of equity of the
company (Bodie, 2013). For the optimal capital structure of the company, following
calculations have been done:
Debt Equity
Cost of
debt
Cost of
equity
Cost of
capital
0% 100% 5.12% 6.03% 6.03%
10% 90% 5.12% 6.03% 5.94%
20% 80% 5.12% 6.03% 5.85%
30% 70% 5.12% 6.03% 5.75%
Paraphrase This Document
Need a fresh take? Get an instant paraphrase of this document with our AI Paraphraser
Corporate Finance Project
11
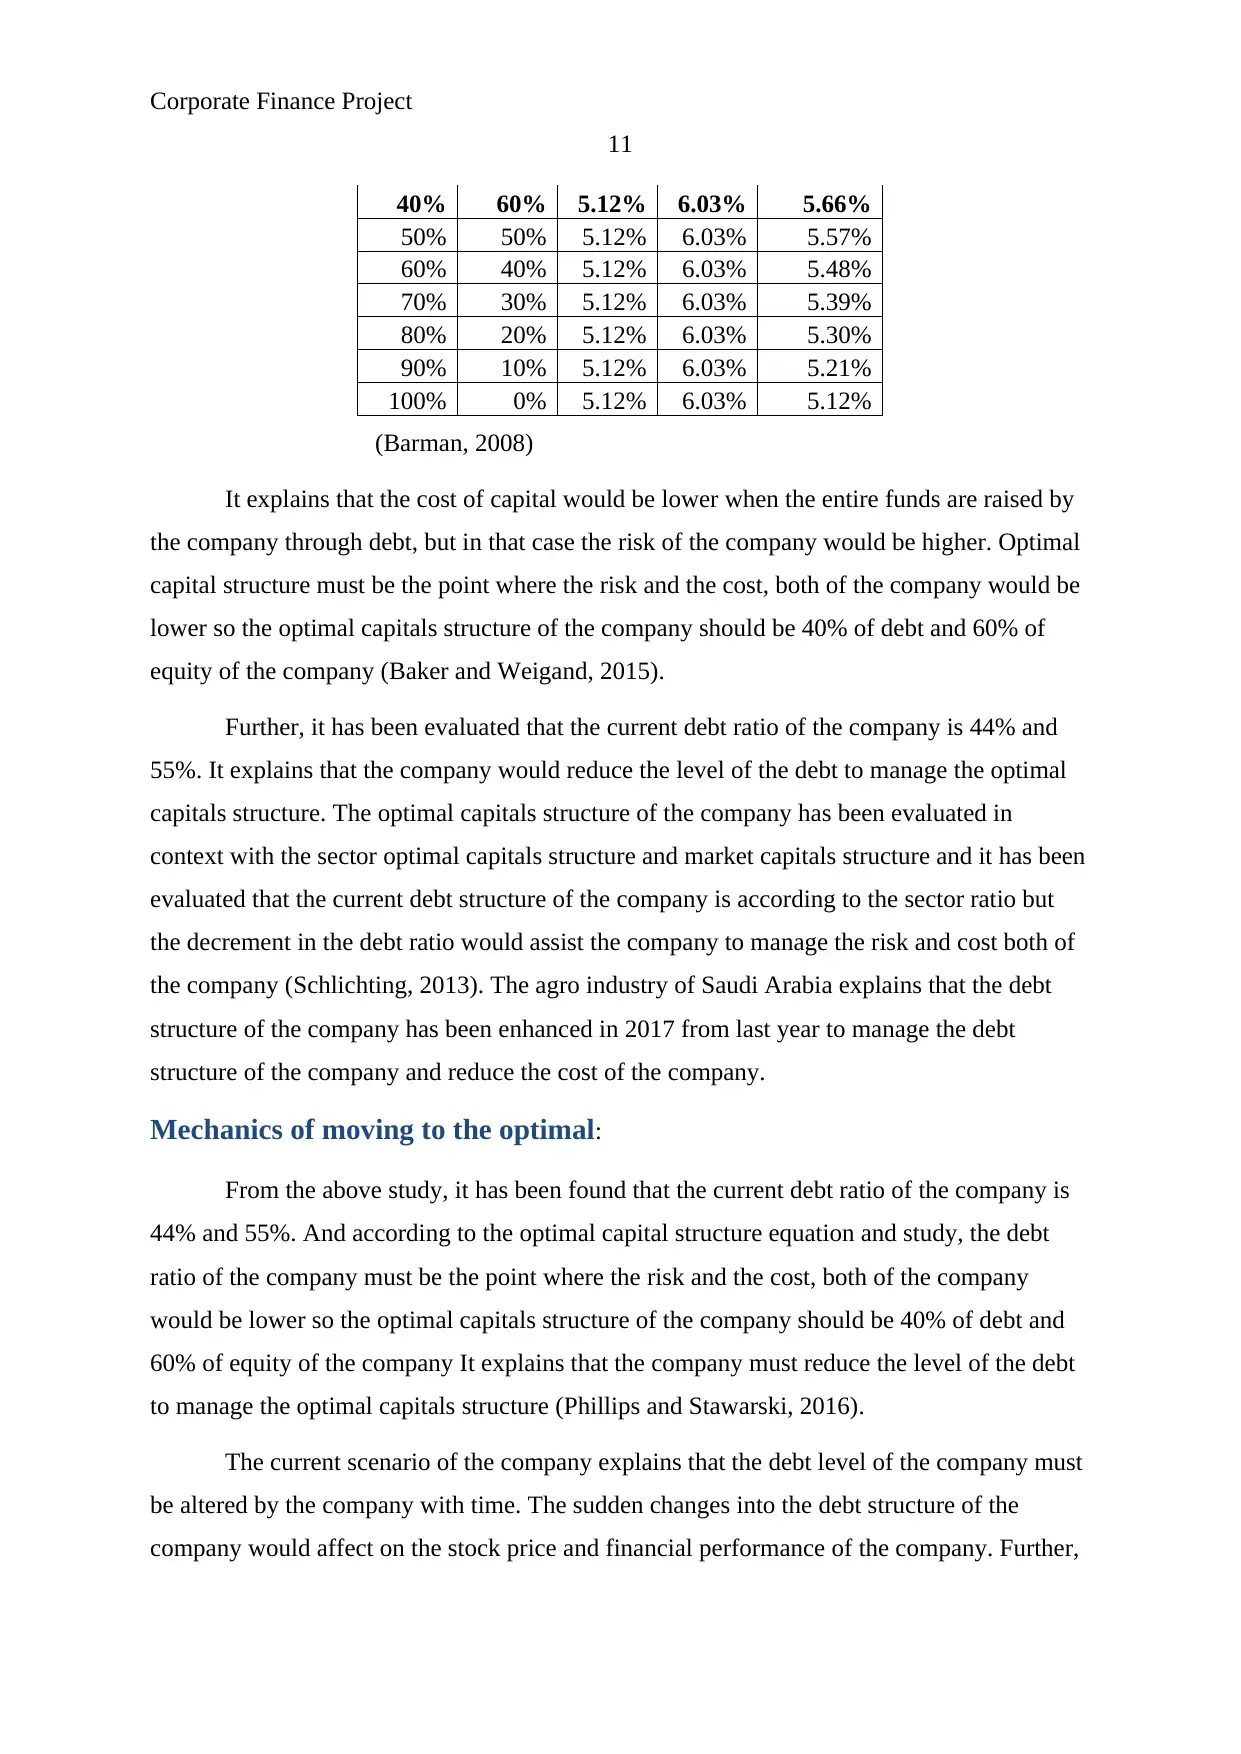
40% 60% 5.12% 6.03% 5.66%
50% 50% 5.12% 6.03% 5.57%
60% 40% 5.12% 6.03% 5.48%
70% 30% 5.12% 6.03% 5.39%
80% 20% 5.12% 6.03% 5.30%
90% 10% 5.12% 6.03% 5.21%
100% 0% 5.12% 6.03% 5.12%
(Barman, 2008)
It explains that the cost of capital would be lower when the entire funds are raised by
the company through debt, but in that case the risk of the company would be higher. Optimal
capital structure must be the point where the risk and the cost, both of the company would be
lower so the optimal capitals structure of the company should be 40% of debt and 60% of
equity of the company (Baker and Weigand, 2015).
Further, it has been evaluated that the current debt ratio of the company is 44% and
55%. It explains that the company would reduce the level of the debt to manage the optimal
capitals structure. The optimal capitals structure of the company has been evaluated in
context with the sector optimal capitals structure and market capitals structure and it has been
evaluated that the current debt structure of the company is according to the sector ratio but
the decrement in the debt ratio would assist the company to manage the risk and cost both of
the company (Schlichting, 2013). The agro industry of Saudi Arabia explains that the debt
structure of the company has been enhanced in 2017 from last year to manage the debt
structure of the company and reduce the cost of the company.
Mechanics of moving to the optimal:
From the above study, it has been found that the current debt ratio of the company is
44% and 55%. And according to the optimal capital structure equation and study, the debt
ratio of the company must be the point where the risk and the cost, both of the company
would be lower so the optimal capitals structure of the company should be 40% of debt and
60% of equity of the company It explains that the company must reduce the level of the debt
to manage the optimal capitals structure (Phillips and Stawarski, 2016).
The current scenario of the company explains that the debt level of the company must
be altered by the company with time. The sudden changes into the debt structure of the
company would affect on the stock price and financial performance of the company. Further,
11
40% 60% 5.12% 6.03% 5.66%
50% 50% 5.12% 6.03% 5.57%
60% 40% 5.12% 6.03% 5.48%
70% 30% 5.12% 6.03% 5.39%
80% 20% 5.12% 6.03% 5.30%
90% 10% 5.12% 6.03% 5.21%
100% 0% 5.12% 6.03% 5.12%
(Barman, 2008)
It explains that the cost of capital would be lower when the entire funds are raised by
the company through debt, but in that case the risk of the company would be higher. Optimal
capital structure must be the point where the risk and the cost, both of the company would be
lower so the optimal capitals structure of the company should be 40% of debt and 60% of
equity of the company (Baker and Weigand, 2015).
Further, it has been evaluated that the current debt ratio of the company is 44% and
55%. It explains that the company would reduce the level of the debt to manage the optimal
capitals structure. The optimal capitals structure of the company has been evaluated in
context with the sector optimal capitals structure and market capitals structure and it has been
evaluated that the current debt structure of the company is according to the sector ratio but
the decrement in the debt ratio would assist the company to manage the risk and cost both of
the company (Schlichting, 2013). The agro industry of Saudi Arabia explains that the debt
structure of the company has been enhanced in 2017 from last year to manage the debt
structure of the company and reduce the cost of the company.
Mechanics of moving to the optimal:
From the above study, it has been found that the current debt ratio of the company is
44% and 55%. And according to the optimal capital structure equation and study, the debt
ratio of the company must be the point where the risk and the cost, both of the company
would be lower so the optimal capitals structure of the company should be 40% of debt and
60% of equity of the company It explains that the company must reduce the level of the debt
to manage the optimal capitals structure (Phillips and Stawarski, 2016).
The current scenario of the company explains that the debt level of the company must
be altered by the company with time. The sudden changes into the debt structure of the
company would affect on the stock price and financial performance of the company. Further,
Corporate Finance Project
12
it explains that the company should buy back retiring the debt to reduce the level of the debt
in the company (Palicka, 2011). It would help the company to manage the optimal capital
structure as well as the risk and cost factor of the company would also be better.
Further, it has also been found that the current amount has been invested by the
company in projects. So, it would be difficult for the company to administer the financial
position and reduce the debt level of the company (Madhura, 2014). So, it is recommended to
the company to enhance the funds through equity when the new funds are invested into the
new project.
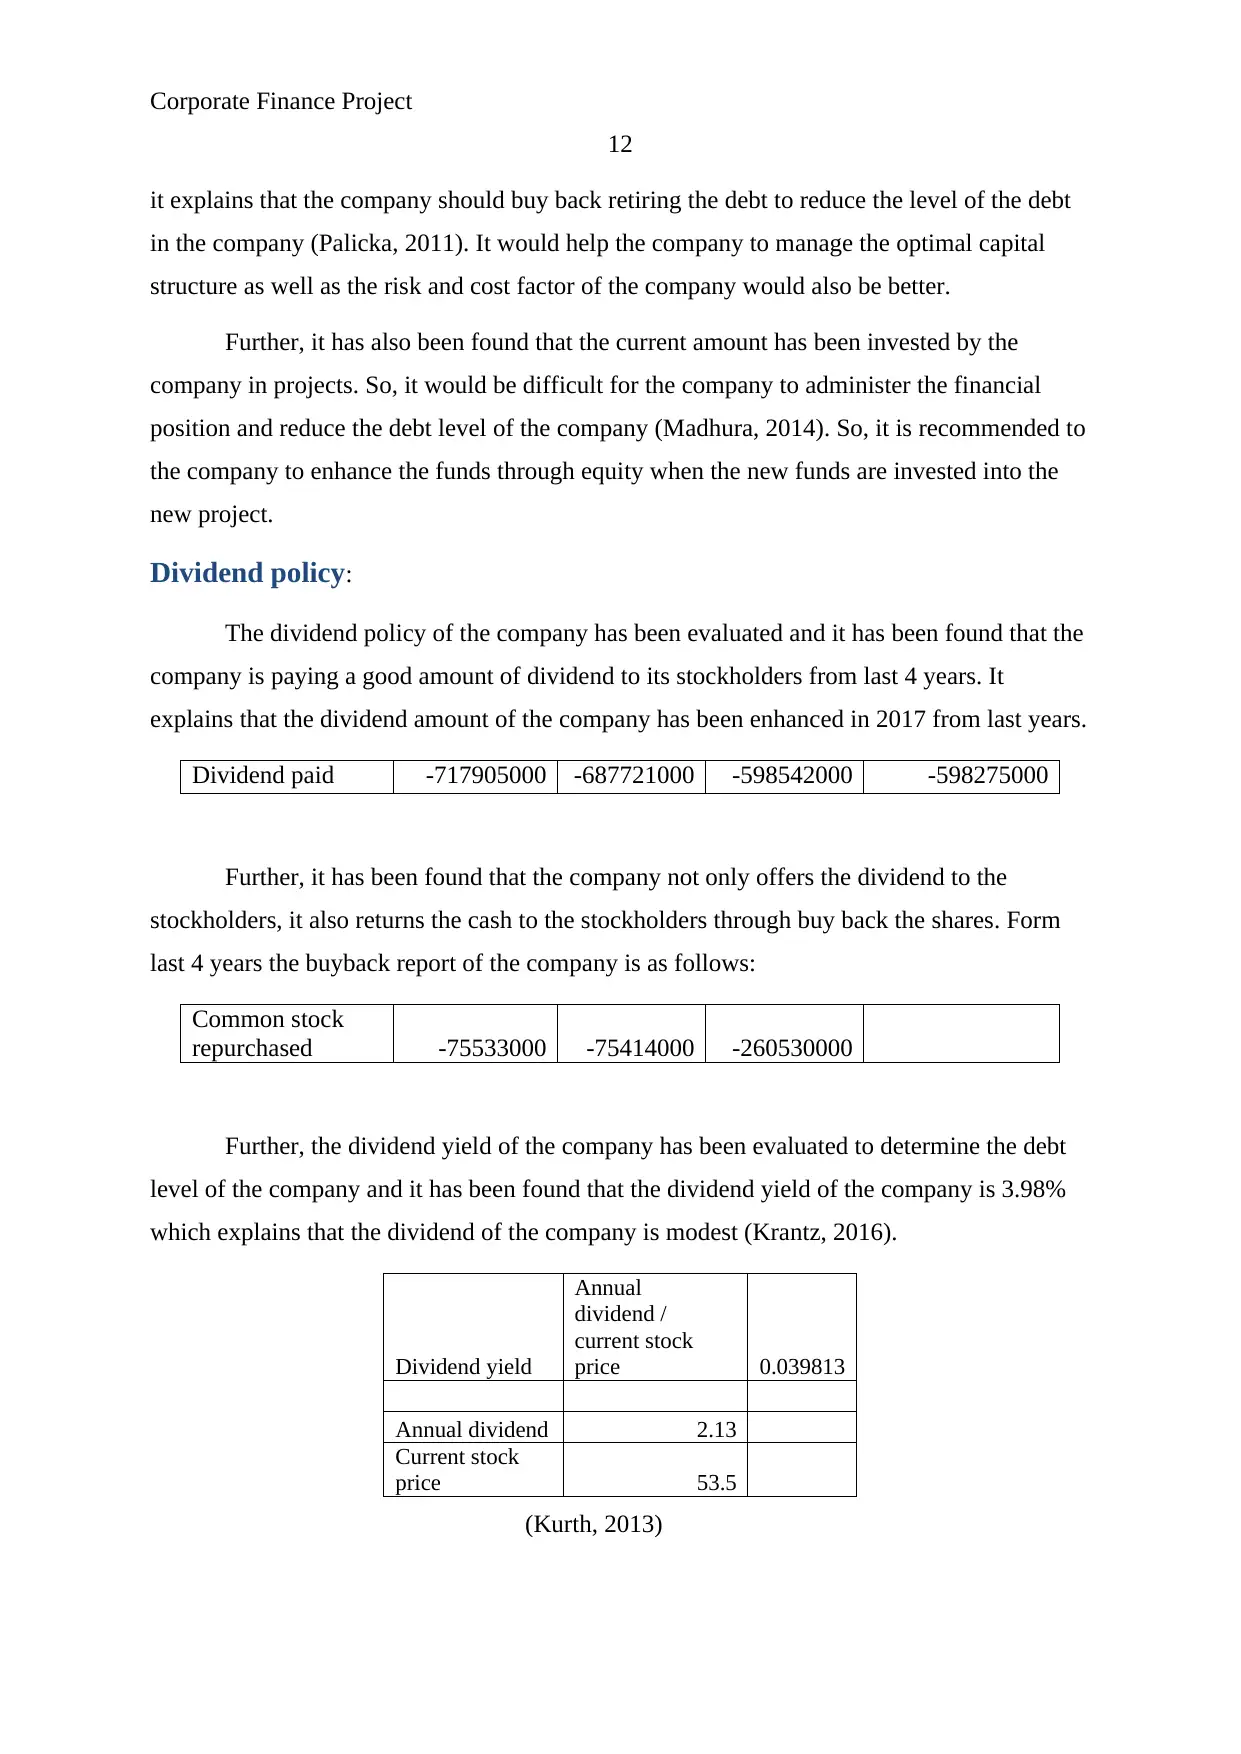
Dividend policy:
The dividend policy of the company has been evaluated and it has been found that the
company is paying a good amount of dividend to its stockholders from last 4 years. It
explains that the dividend amount of the company has been enhanced in 2017 from last years.
Dividend paid -717905000 -687721000 -598542000 -598275000
Further, it has been found that the company not only offers the dividend to the
stockholders, it also returns the cash to the stockholders through buy back the shares. Form
last 4 years the buyback report of the company is as follows:
Common stock
repurchased -75533000 -75414000 -260530000
Further, the dividend yield of the company has been evaluated to determine the debt
level of the company and it has been found that the dividend yield of the company is 3.98%
which explains that the dividend of the company is modest (Krantz, 2016).
Dividend yield
Annual
dividend /
current stock
price 0.039813
Annual dividend 2.13
Current stock
price 53.5
(Kurth, 2013)
12
it explains that the company should buy back retiring the debt to reduce the level of the debt
in the company (Palicka, 2011). It would help the company to manage the optimal capital
structure as well as the risk and cost factor of the company would also be better.
Further, it has also been found that the current amount has been invested by the
company in projects. So, it would be difficult for the company to administer the financial
position and reduce the debt level of the company (Madhura, 2014). So, it is recommended to
the company to enhance the funds through equity when the new funds are invested into the
new project.
Dividend policy:
The dividend policy of the company has been evaluated and it has been found that the
company is paying a good amount of dividend to its stockholders from last 4 years. It
explains that the dividend amount of the company has been enhanced in 2017 from last years.
Dividend paid -717905000 -687721000 -598542000 -598275000
Further, it has been found that the company not only offers the dividend to the
stockholders, it also returns the cash to the stockholders through buy back the shares. Form
last 4 years the buyback report of the company is as follows:
Common stock
repurchased -75533000 -75414000 -260530000
Further, the dividend yield of the company has been evaluated to determine the debt
level of the company and it has been found that the dividend yield of the company is 3.98%
which explains that the dividend of the company is modest (Krantz, 2016).
Dividend yield
Annual
dividend /
current stock
price 0.039813
Annual dividend 2.13
Current stock
price 53.5
(Kurth, 2013)
⊘ This is a preview!⊘
Do you want full access?
Subscribe today to unlock all pages.
Trusted by 1+ million students worldwide
1 out of 17
Related Documents


Your All-in-One AI-Powered Toolkit for Academic Success.
+13062052269
info@desklib.com
Available 24*7 on WhatsApp / Email
![[object Object]](/_next/static/media/star-bottom.7253800d.svg)
Unlock your academic potential
Copyright © 2020–2026 A2Z Services. All Rights Reserved. Developed and managed by ZUCOL.