Investment Analysis: Stock Selection and Financial Analysis Report
VerifiedAdded on 2022/08/18
|17
|3384
|11
Report
AI Summary
This report presents an investment analysis of Alphabet Inc. (GOOG) for a client. The report begins with an investor risk profile assessment, considering factors such as age, marital status, occupation, net worth, and investment objectives. The rationale for selecting Alphabet Inc. (GOOG) is discussed, emphasizing the company's innovative nature, financial stability, and potential for growth. A detailed financial analysis is then conducted, examining liquidity, profitability, and leverage ratios to assess the company's financial health. The analysis includes calculations and interpretations of current ratios, cash flow operation ratios, gross profit ratios, net profit ratios, and debt-to-equity ratios. Finally, the report concludes with a stock analysis and investment recommendation, aligning the investment with the client's risk profile and long-term investment goals. The report utilizes multiple academic sources to support its findings and recommendations.

Running head: INVESTMENT ANALYSIS
Investment Analysis
Name of the Student:
Name of the University:
Author Note:
Investment Analysis
Name of the Student:
Name of the University:
Author Note:
Paraphrase This Document
Need a fresh take? Get an instant paraphrase of this document with our AI Paraphraser
1INVESTMENT ANALYSIS
Table of Contents
Introduction:...............................................................................................................................2
Discussion:.................................................................................................................................2
Investor Risk Profile:.............................................................................................................2
Rationale for Stock Selection:....................................................................................................3
Financial Analysis of the Company:......................................................................................5
Liquidity Ratio:..................................................................................................................5
Conclusion:........................................................................................................................7
Profitability Ratio:..............................................................................................................7
Conclusion:......................................................................................................................10
Leverage Ratio:................................................................................................................10
Conclusion:......................................................................................................................11
Stock Analysis of the Company:..........................................................................................11
Conclusion:......................................................................................................................12
Recommendation:....................................................................................................................13
References:...............................................................................................................................14
2INVESTMENT ANALYSIS
Introduction:
Investment of funds in stock markets requires thorough analysis of the markets along
with selection of stocks. The selection of stocks requires certain characteristics of the client
which needs to be taken into consideration when selecting the stocks. The characteristics
imply the investor profiling which includes the basic information of the customer along with
his occupation, age and the objective for the investment (Kess & Mendlowitz, 2016). Thus
the following report highlights the circumstances of a particular customer who wishes to
investment available funds in the stock market to generate returns. The selection of the stock
would depend on the investor profile which would be taken into consideration when creating
the desired portfolio. Thus the aim of this report is to conduct a thorough risk return analysis
of the investor and to determine a stock which is suitable for the investor to obtain the
investment objective (Geller, 2016).
Discussion:
Investor Risk Profile:
The investor who is willing to invest in the markets has provided the following
information pertaining to his basic profile. This information is important to determine the risk
profile of the investor and whether the return objective is equivalent to the risk profile of the
investor (Horstmeyer, 2019).
Name of the Investor: Mr John Matthew
Age of the Investor: 38 years
Marital Status: Single
Occupation: Owner of chain of Hardware Stores:
Properties: Own House in two location, two cars and one bike.
⊘ This is a preview!⊘
Do you want full access?
Subscribe today to unlock all pages.
Trusted by 1+ million students worldwide
3INVESTMENT ANALYSIS
Net-worth: $1 million excluding properties
Retirement plans: Invested in two retirement plans which will suffice the retirement of
the investor.
Inheritance: $100000, which he would receive due to the death of a relative and
would like to invest in the stocks.
Willingness to take risk: High as specified by the client
Ability to take risk: High due to no dependants and having sustainable properties.
Investment Objective: Appreciation of Capital
Thus as per the above details which has been provided the investor is a risk lover and
would like to take risk when investing in the portfolio, with the objective to appreciate the
capital. The investor has never invested in the markets before and is willing to take chances
and has the ability to re-coupe the loss which would be incurred in the portfolio. The liquidity
requirements for the investor is not present and the investor has a long time horizon which
supports the willingness and ability of the investor to take risk (Rutterford, 2016). The
investor has no unique or legal circumstances which would affect the stock selection of the
portfolio manager. The investor would review the investment in a year, and has provided
permission for tactical asset allocation in the portfolio (Stelljes, 2018).
Rationale for Stock Selection:
The stock which is selected for the investor is the stock of Alphabet Inc. (GOOG),
which is trading at the NASDAQ index. The company is a multi-million dollar technology
company which has its operations around the globe. The company is one of the top most
technological company in the Forbes magazine and has its operations being conducted for
over 25 years (finance.yahoo.com, 2020).
Paraphrase This Document
Need a fresh take? Get an instant paraphrase of this document with our AI Paraphraser
4INVESTMENT ANALYSIS
The stock is one of the most innovative companies in the world and can create huge
appreciation for the investor. The investor has a long time horizon and no immediate liquidity
requirements, thus the stock can be selected and invested as with the emergence of new
technology the company has invested in Research and Development to create better
technology which will increase the price of the shares. The financial analysis of the company
has been conducted with regards to the ratio of the company and the company seems to
provide sustainable options for its future business (www.livemint.com, 2020).
Thus as the fear of economic recession prevails in the market, impact can be expected
in technology stocks due to some reduction in business. However, the strong business model
of the company and products which had survived the IT bubble in the year 2000, along with
the credit crisis in 2008 the company can expect to ride out the recession which is expected in
the future (www.theverge.com, 2020).
The recent trends in corona virus also tends to have certain impact on the profitability
of the company. Thus with the impact of corona virus and the people being quarantined to
stay indoors the use of you-tube which is a Google video streaming application is expected to
increase leading to a rise in the revenue for the company. Thus, also use of the search engine
for contents regarding to the virus also tends to increase the revenue for the company, thus
better profitability is expected from the company.
The recent news of merger of the company Google with Fit-bit leads to the expansion
of the Google’s services in smart watch market. Thus providing further possibility of rise in
revenue for the company from the smart watch segment. The Google Pixel which is a
flagship device of the company also tends to capture market share and has been ranked in the
10th best android devices which can be bought in the market (www.businessinsider, 2020).
5INVESTMENT ANALYSIS
Thus analysing the financial, economic and company specific factors the company
can be expected to provide greater revenue in the future. The investment horizon of the
investor being long term supports the investment rationale for selecting the stock, as the
objective of investment is capital appreciation by the investor which can be achieved by
investing in the stock.
Financial Analysis of the Company:
Ratio analysis of a company is one of the key aspects to analyse the financial health of
the company. The various ratios such as liquidity, leverage, profitability provides a sound
information of the company position of financials. This highlights whether a company has the
prospects to improve in the future or collapse due to ineffective policies (CTFA, 2016).
Liquidity Ratio:
The liquidity is the most important factor for a company as it highlights the ability of
the company to meet sudden requirements. Thus if the liquidity of the company is poor, it
would then need to borrow funds at higher rates to meet the expenses and can increase the
risk for the equity shareholders of the company (Wen & Zhu, 2019). Thus the following
liquidity ratio have been calculated and analyse to understand the liquidity position of the
company.
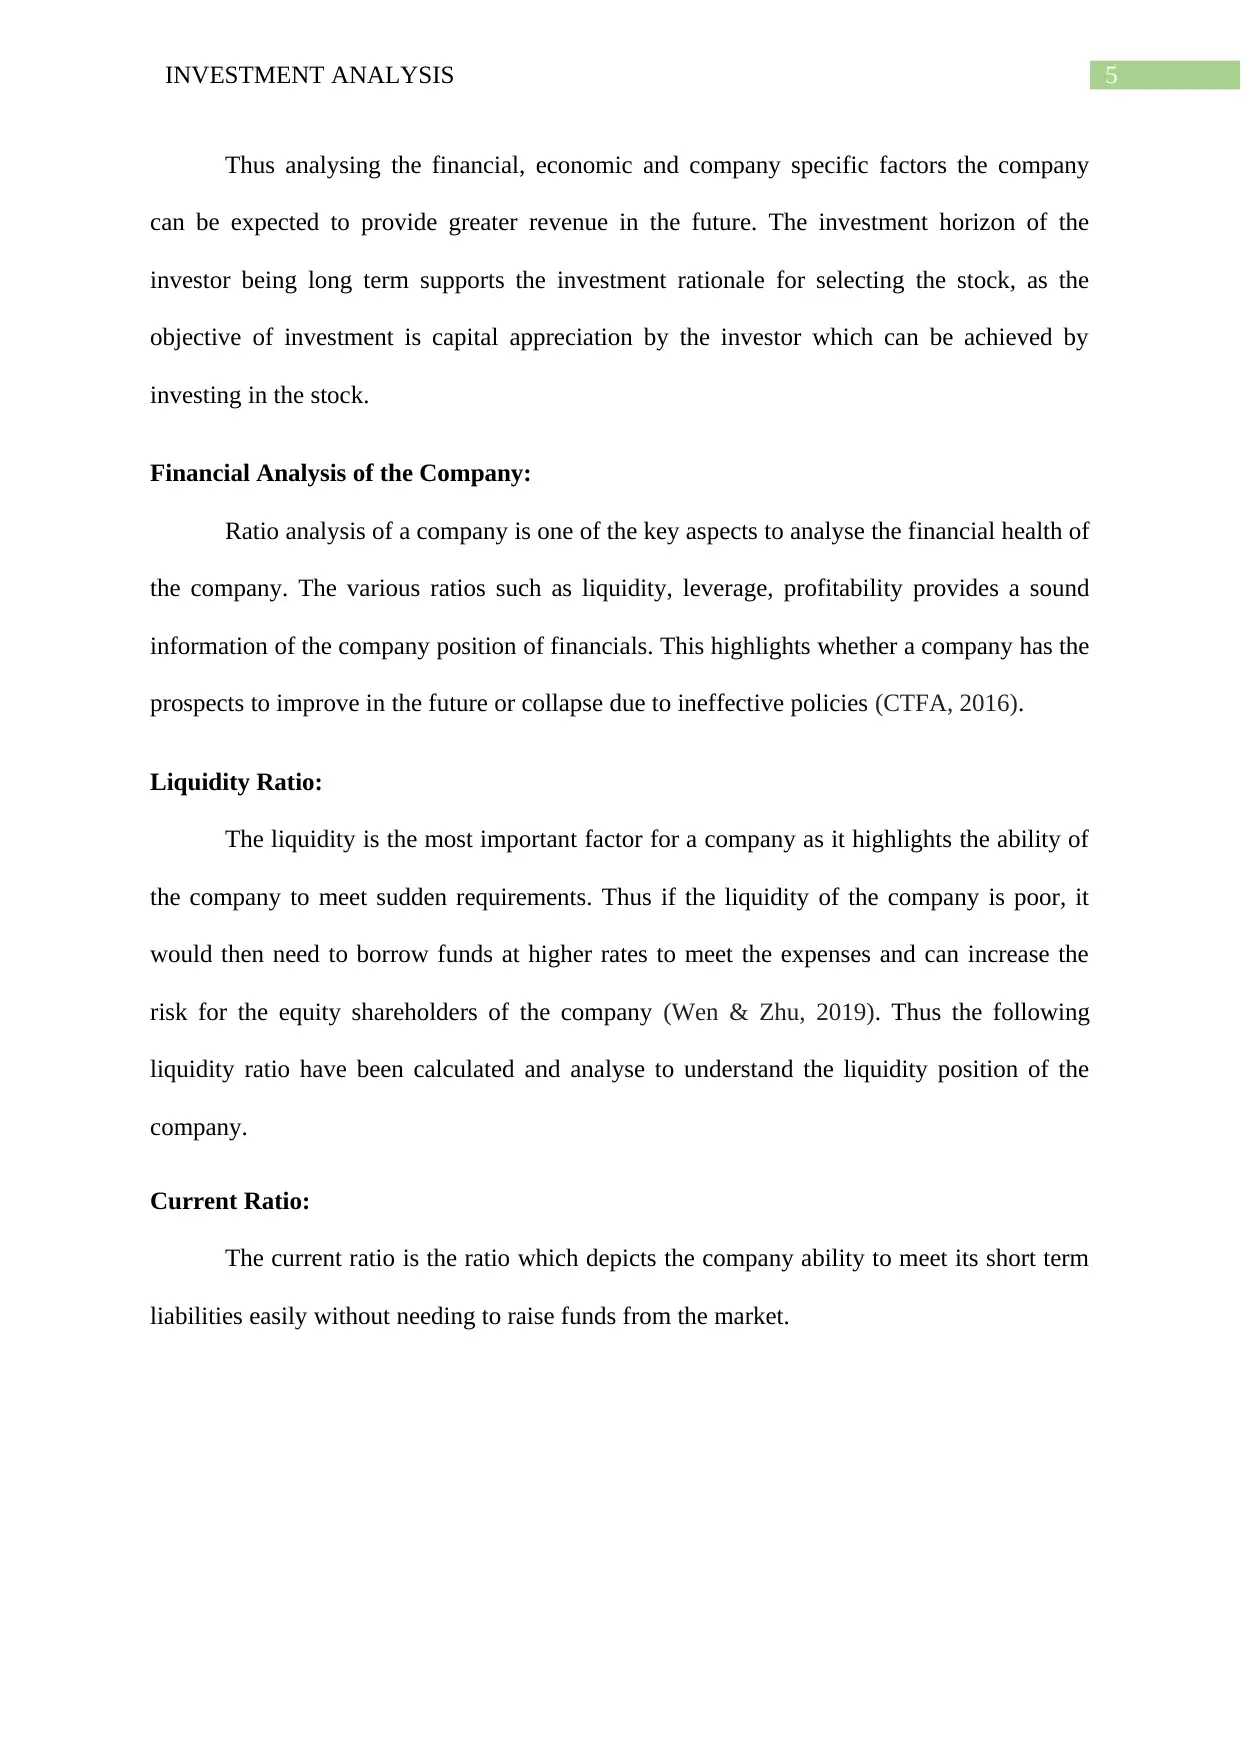
Current Ratio:
The current ratio is the ratio which depicts the company ability to meet its short term
liabilities easily without needing to raise funds from the market.
Thus analysing the financial, economic and company specific factors the company
can be expected to provide greater revenue in the future. The investment horizon of the
investor being long term supports the investment rationale for selecting the stock, as the
objective of investment is capital appreciation by the investor which can be achieved by
investing in the stock.
Financial Analysis of the Company:
Ratio analysis of a company is one of the key aspects to analyse the financial health of
the company. The various ratios such as liquidity, leverage, profitability provides a sound
information of the company position of financials. This highlights whether a company has the
prospects to improve in the future or collapse due to ineffective policies (CTFA, 2016).
Liquidity Ratio:
The liquidity is the most important factor for a company as it highlights the ability of
the company to meet sudden requirements. Thus if the liquidity of the company is poor, it
would then need to borrow funds at higher rates to meet the expenses and can increase the
risk for the equity shareholders of the company (Wen & Zhu, 2019). Thus the following
liquidity ratio have been calculated and analyse to understand the liquidity position of the
company.
Current Ratio:
The current ratio is the ratio which depicts the company ability to meet its short term
liabilities easily without needing to raise funds from the market.
⊘ This is a preview!⊘
Do you want full access?
Subscribe today to unlock all pages.
Trusted by 1+ million students worldwide
6INVESTMENT ANALYSIS
2017 2018 2019
0
1
2
3
4
5
6
Current Ratio
Figure 1: Current Ratio
Source: By the Author
The current ratio of the company has fallen over the years, which highlights the sign
of deteriorating liquidity. Thus the company has been reducing the liquidity position,
however it can be positive sign as the company had a ratio greater than 5 and reducing the
position can highlight the company can be investing in projects which can provide better
returns in the future. However, the liquidity position is greater than 2, which highlights
superior liquidity position of the company (Easton, & Sommers, 2018).
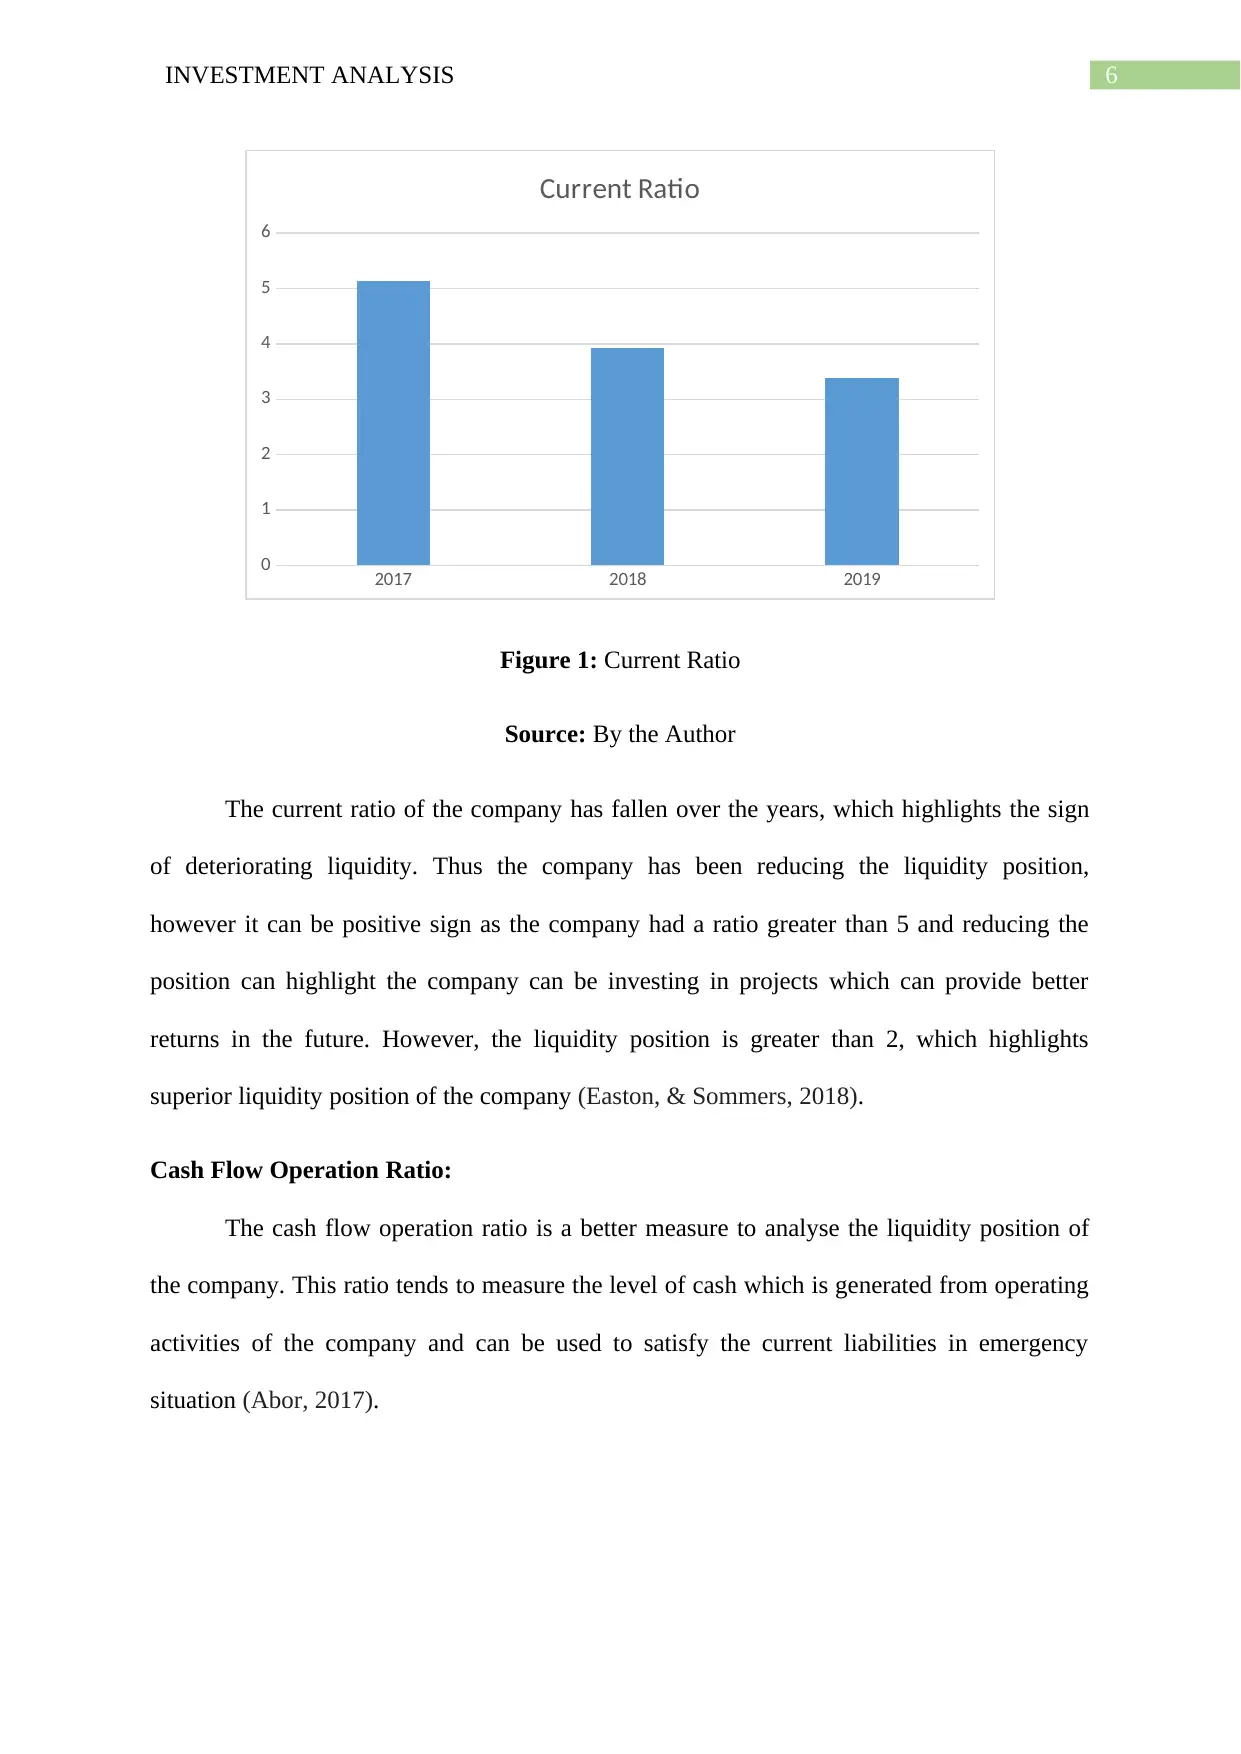
Cash Flow Operation Ratio:
The cash flow operation ratio is a better measure to analyse the liquidity position of
the company. This ratio tends to measure the level of cash which is generated from operating
activities of the company and can be used to satisfy the current liabilities in emergency
situation (Abor, 2017).
2017 2018 2019
0
1
2
3
4
5
6
Current Ratio
Figure 1: Current Ratio
Source: By the Author
The current ratio of the company has fallen over the years, which highlights the sign
of deteriorating liquidity. Thus the company has been reducing the liquidity position,
however it can be positive sign as the company had a ratio greater than 5 and reducing the
position can highlight the company can be investing in projects which can provide better
returns in the future. However, the liquidity position is greater than 2, which highlights
superior liquidity position of the company (Easton, & Sommers, 2018).
Cash Flow Operation Ratio:
The cash flow operation ratio is a better measure to analyse the liquidity position of
the company. This ratio tends to measure the level of cash which is generated from operating
activities of the company and can be used to satisfy the current liabilities in emergency
situation (Abor, 2017).
Paraphrase This Document
Need a fresh take? Get an instant paraphrase of this document with our AI Paraphraser
7INVESTMENT ANALYSIS
2017 2018 2019
0
0.2
0.4
0.6
0.8
1
1.2
1.4
1.6
1.8
Cash Flow Operation Ratio
Figure 2: Cash Flow Operation Ratio
Source: By the Author
Thus the ratio has been declining from the year 2017 to 2019, which highlights the
reduction in the capability of the company to meet the current liabilities. However, the
company has maintained this ratio above 1 which is a good sign as the company can pay its
current liabilities with its operations and would not require to borrow extra funds from the
market (Aman, 2016).
Conclusion:
The company has superior liquidity position which is desirable in value investing
which is fuelled by growth.
Profitability Ratio:
The profitability of a company highlights the returns which would be made available
to the shareholders in the form of dividends or through other form of stock splits or share
repurchase program. Thus the profitability ratios have been calculated to provide the analysis
of the profitability of the company (Campbell, D'Adduzio, Downes & Utke, 2019).
8INVESTMENT ANALYSIS
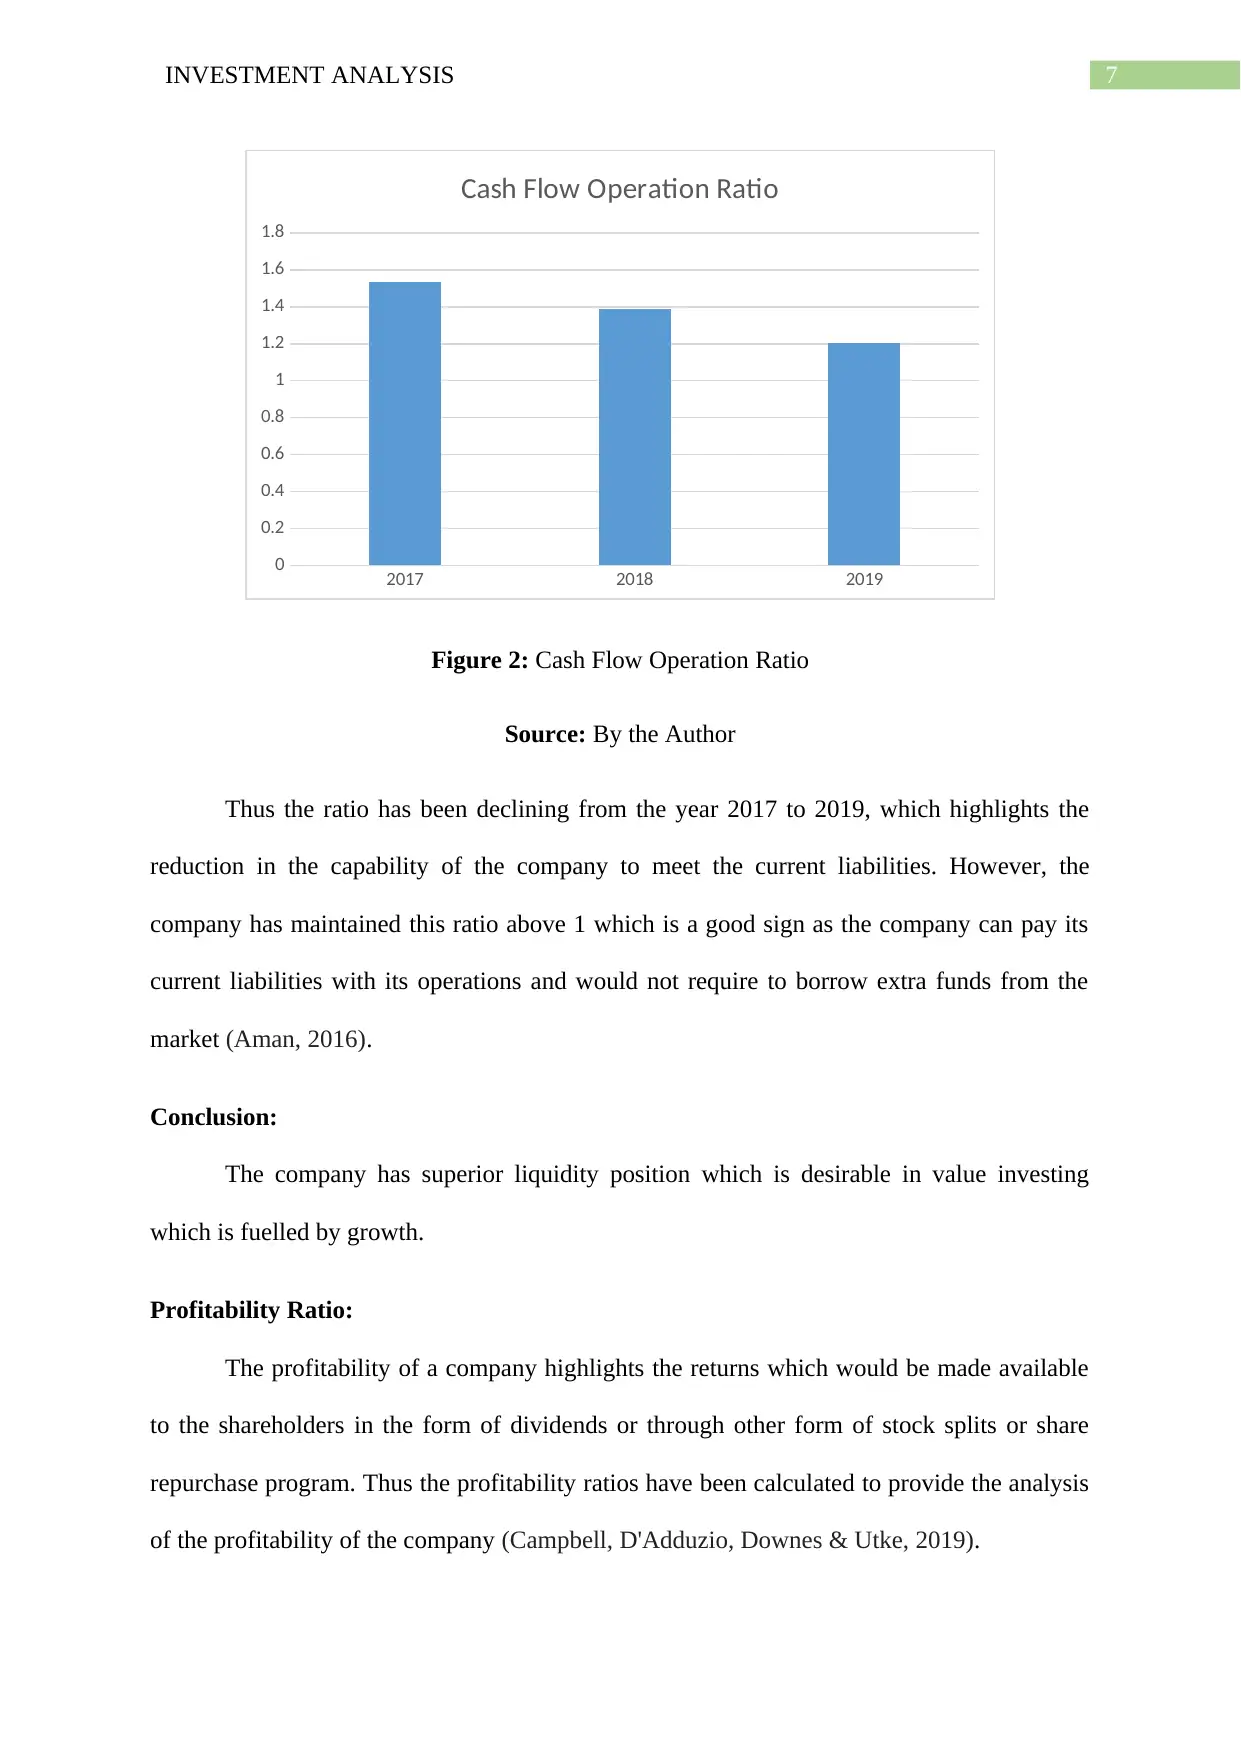
Gross Profit:
The gross profit of a company is the amount which is left after paying for the cost of
the goods. Thus this highlights the profit margin which the company has within which it has
to meet all other expenses to provide a net return to the shareholders.
2017 2018 2019
53
54
55
56
57
58
59
60
Gross Profit Ratio
Figure 3: Gross Profit Ratio
Source: By the Author
The gross profit ratio of the company has fallen over the years, which highlights the
rise in the cost of sales for the goods sold. This however, is not a big of a change but
highlights the company policy to acquire goods which are sold to the consumers (Jalbert,
2017).
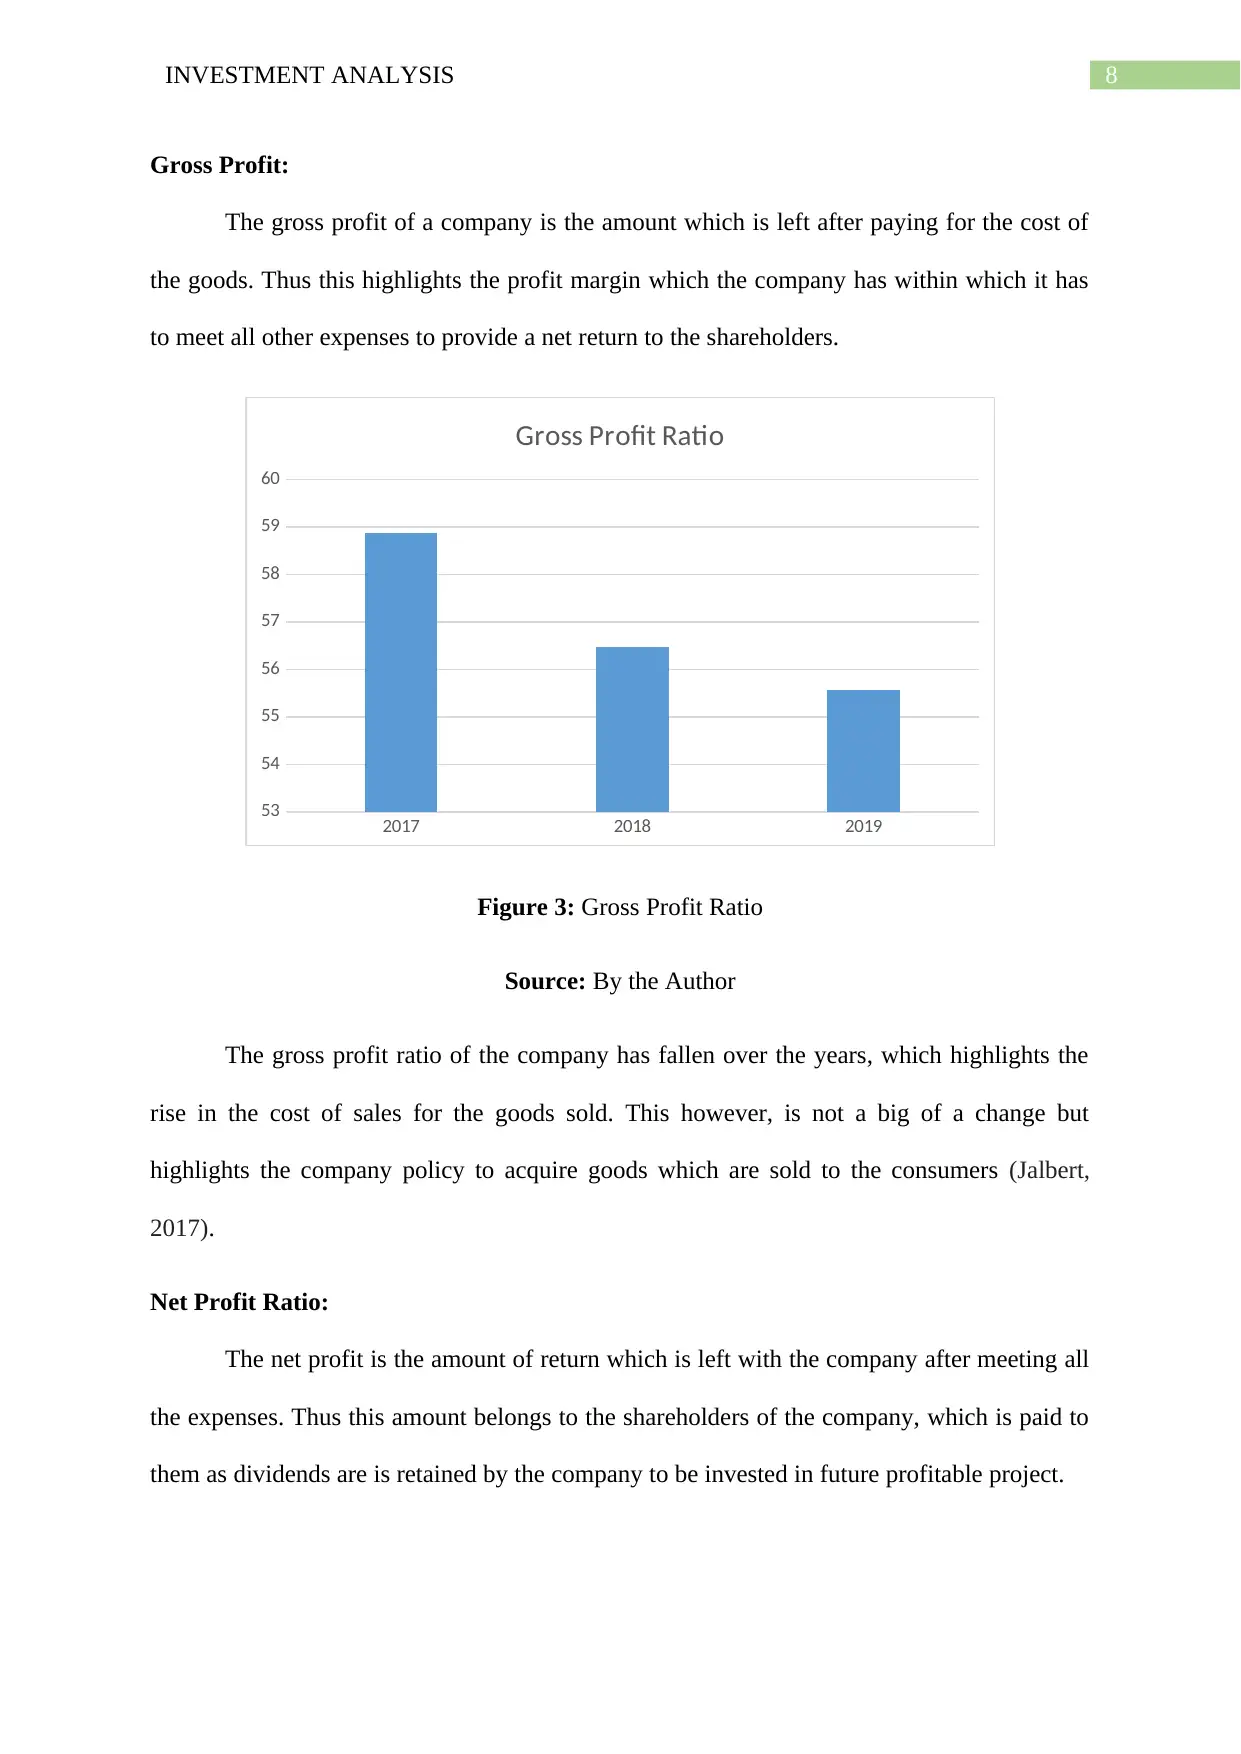
Net Profit Ratio:
The net profit is the amount of return which is left with the company after meeting all
the expenses. Thus this amount belongs to the shareholders of the company, which is paid to
them as dividends are is retained by the company to be invested in future profitable project.
Gross Profit:
The gross profit of a company is the amount which is left after paying for the cost of
the goods. Thus this highlights the profit margin which the company has within which it has
to meet all other expenses to provide a net return to the shareholders.
2017 2018 2019
53
54
55
56
57
58
59
60
Gross Profit Ratio
Figure 3: Gross Profit Ratio
Source: By the Author
The gross profit ratio of the company has fallen over the years, which highlights the
rise in the cost of sales for the goods sold. This however, is not a big of a change but
highlights the company policy to acquire goods which are sold to the consumers (Jalbert,
2017).
Net Profit Ratio:
The net profit is the amount of return which is left with the company after meeting all
the expenses. Thus this amount belongs to the shareholders of the company, which is paid to
them as dividends are is retained by the company to be invested in future profitable project.
⊘ This is a preview!⊘
Do you want full access?
Subscribe today to unlock all pages.
Trusted by 1+ million students worldwide
9INVESTMENT ANALYSIS
2017 2018 2019
0
5
10
15
20
25
Net Profit Ratio
Figure 4: Net Profit Ratio
Source: By the Author
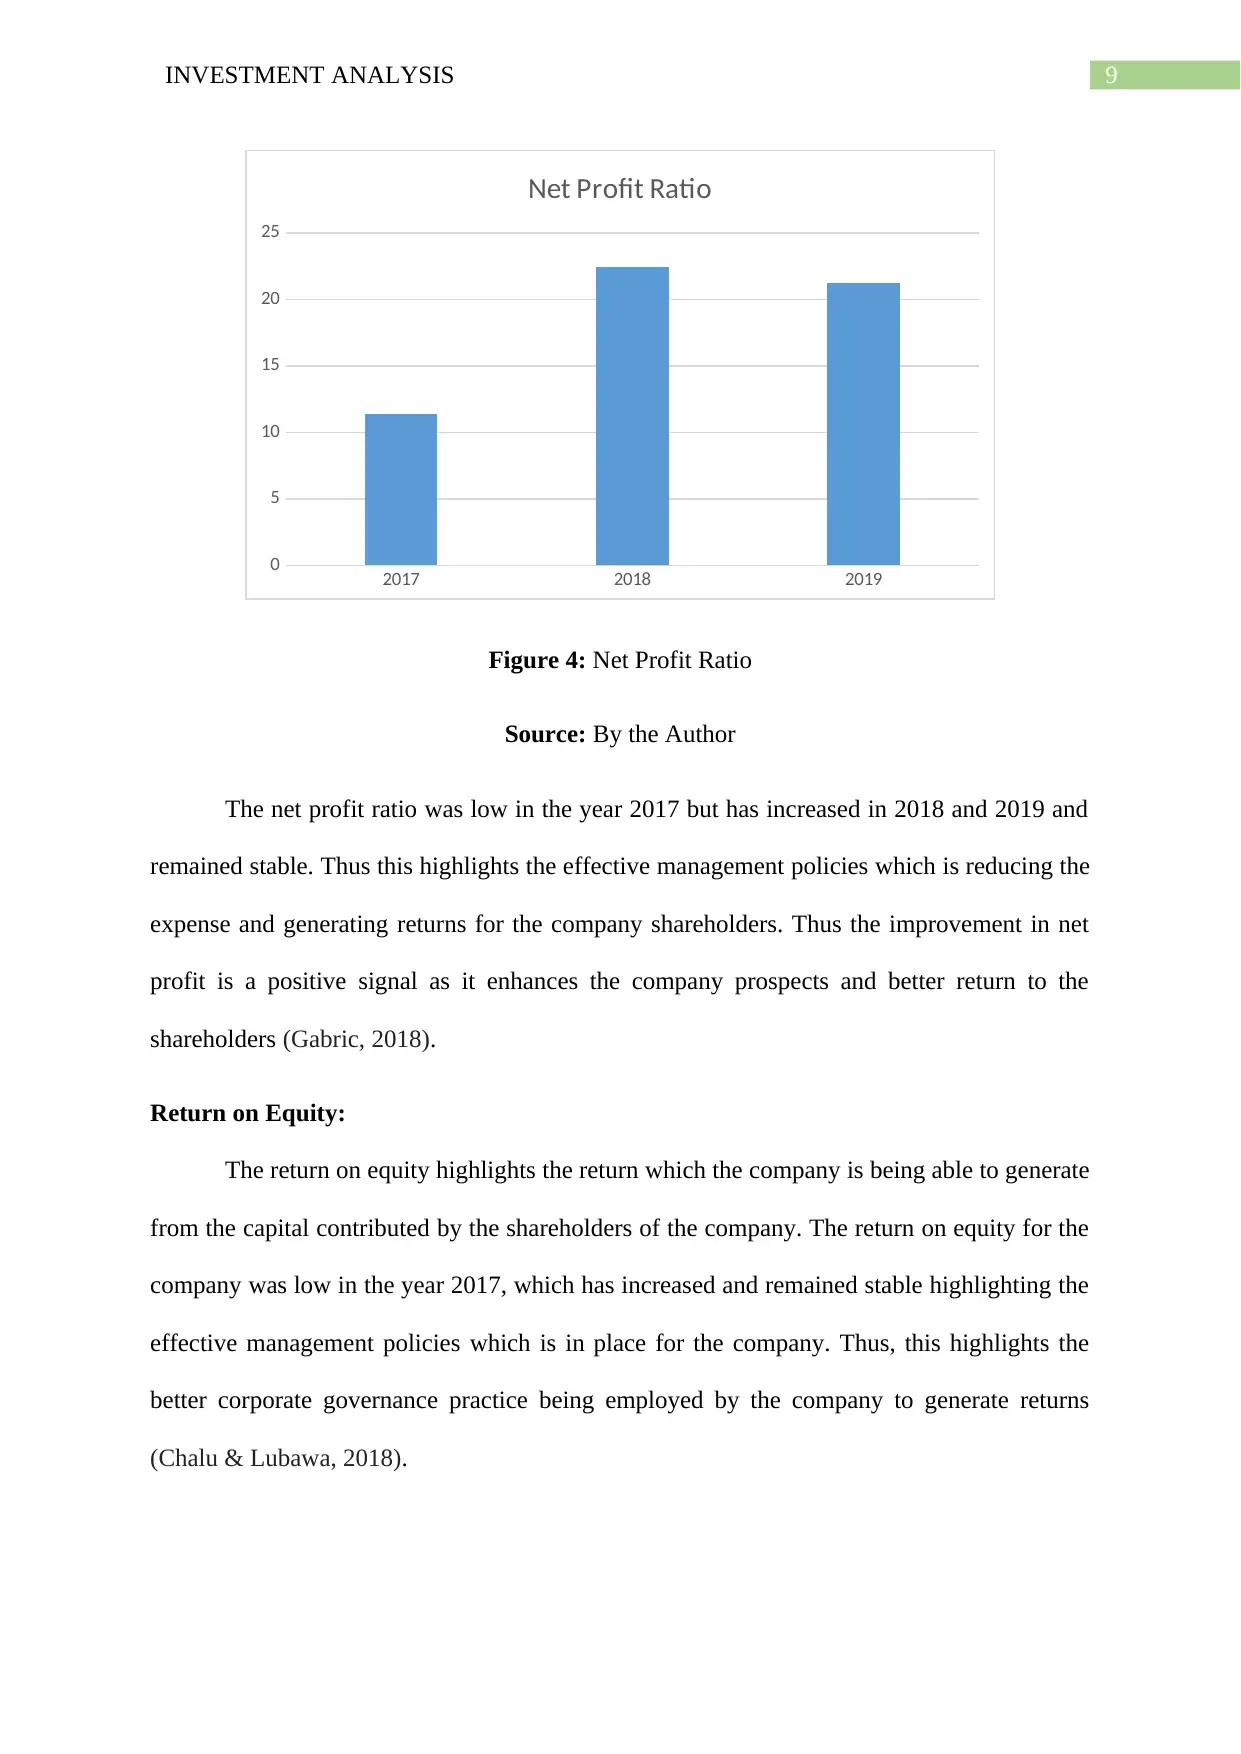
The net profit ratio was low in the year 2017 but has increased in 2018 and 2019 and
remained stable. Thus this highlights the effective management policies which is reducing the
expense and generating returns for the company shareholders. Thus the improvement in net
profit is a positive signal as it enhances the company prospects and better return to the
shareholders (Gabric, 2018).
Return on Equity:
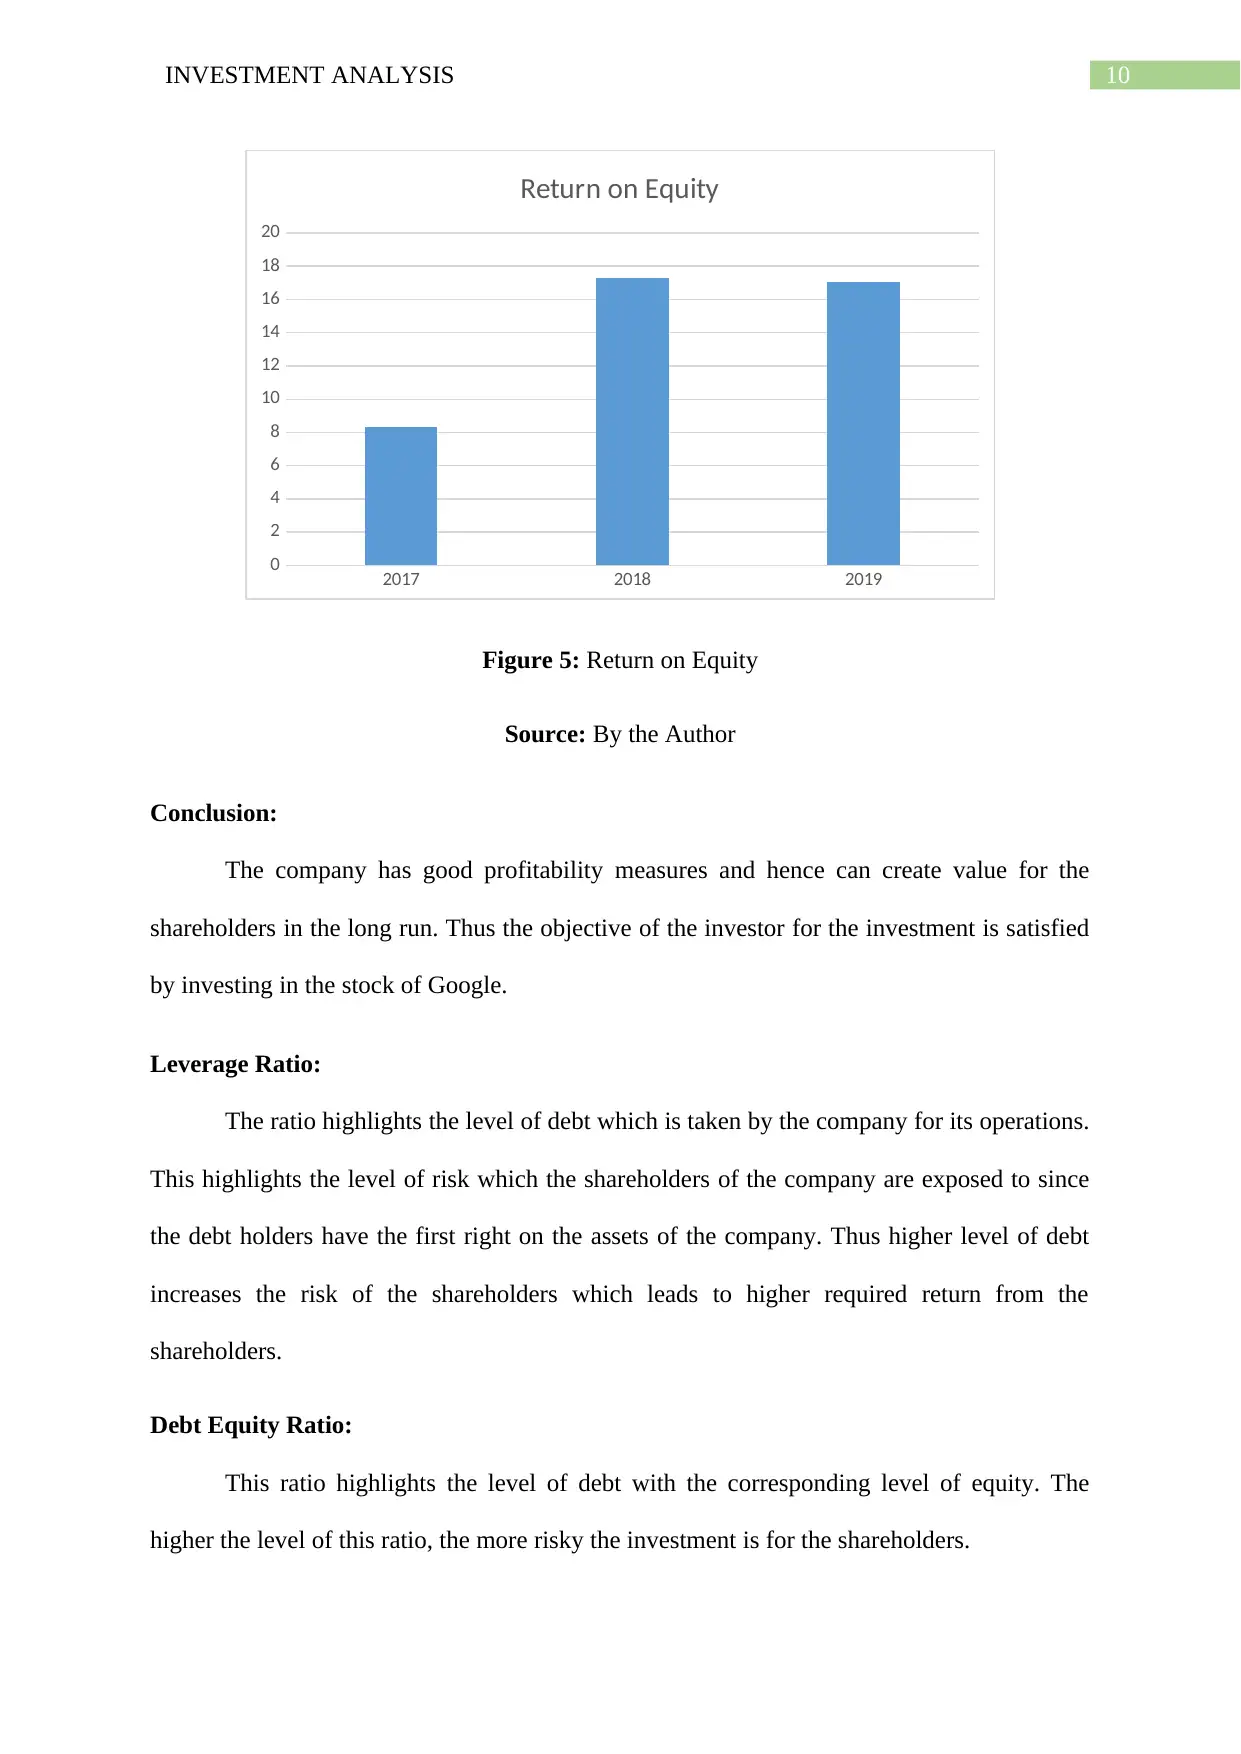
The return on equity highlights the return which the company is being able to generate
from the capital contributed by the shareholders of the company. The return on equity for the
company was low in the year 2017, which has increased and remained stable highlighting the
effective management policies which is in place for the company. Thus, this highlights the
better corporate governance practice being employed by the company to generate returns
(Chalu & Lubawa, 2018).
2017 2018 2019
0
5
10
15
20
25
Net Profit Ratio
Figure 4: Net Profit Ratio
Source: By the Author
The net profit ratio was low in the year 2017 but has increased in 2018 and 2019 and
remained stable. Thus this highlights the effective management policies which is reducing the
expense and generating returns for the company shareholders. Thus the improvement in net
profit is a positive signal as it enhances the company prospects and better return to the
shareholders (Gabric, 2018).
Return on Equity:
The return on equity highlights the return which the company is being able to generate
from the capital contributed by the shareholders of the company. The return on equity for the
company was low in the year 2017, which has increased and remained stable highlighting the
effective management policies which is in place for the company. Thus, this highlights the
better corporate governance practice being employed by the company to generate returns
(Chalu & Lubawa, 2018).
Paraphrase This Document
Need a fresh take? Get an instant paraphrase of this document with our AI Paraphraser
10INVESTMENT ANALYSIS
2017 2018 2019
0
2
4
6
8
10
12
14
16
18
20
Return on Equity
Figure 5: Return on Equity
Source: By the Author
Conclusion:
The company has good profitability measures and hence can create value for the
shareholders in the long run. Thus the objective of the investor for the investment is satisfied
by investing in the stock of Google.
Leverage Ratio:
The ratio highlights the level of debt which is taken by the company for its operations.
This highlights the level of risk which the shareholders of the company are exposed to since
the debt holders have the first right on the assets of the company. Thus higher level of debt
increases the risk of the shareholders which leads to higher required return from the
shareholders.
Debt Equity Ratio:
This ratio highlights the level of debt with the corresponding level of equity. The
higher the level of this ratio, the more risky the investment is for the shareholders.
11INVESTMENT ANALYSIS
2017 2018 2019
0
0.02
0.04
0.06
0.08
0.1
0.12
0.14
0.16
Debt to Equity Ratio
Figure 6: Debt to Equity Ratio
Source: By the Author
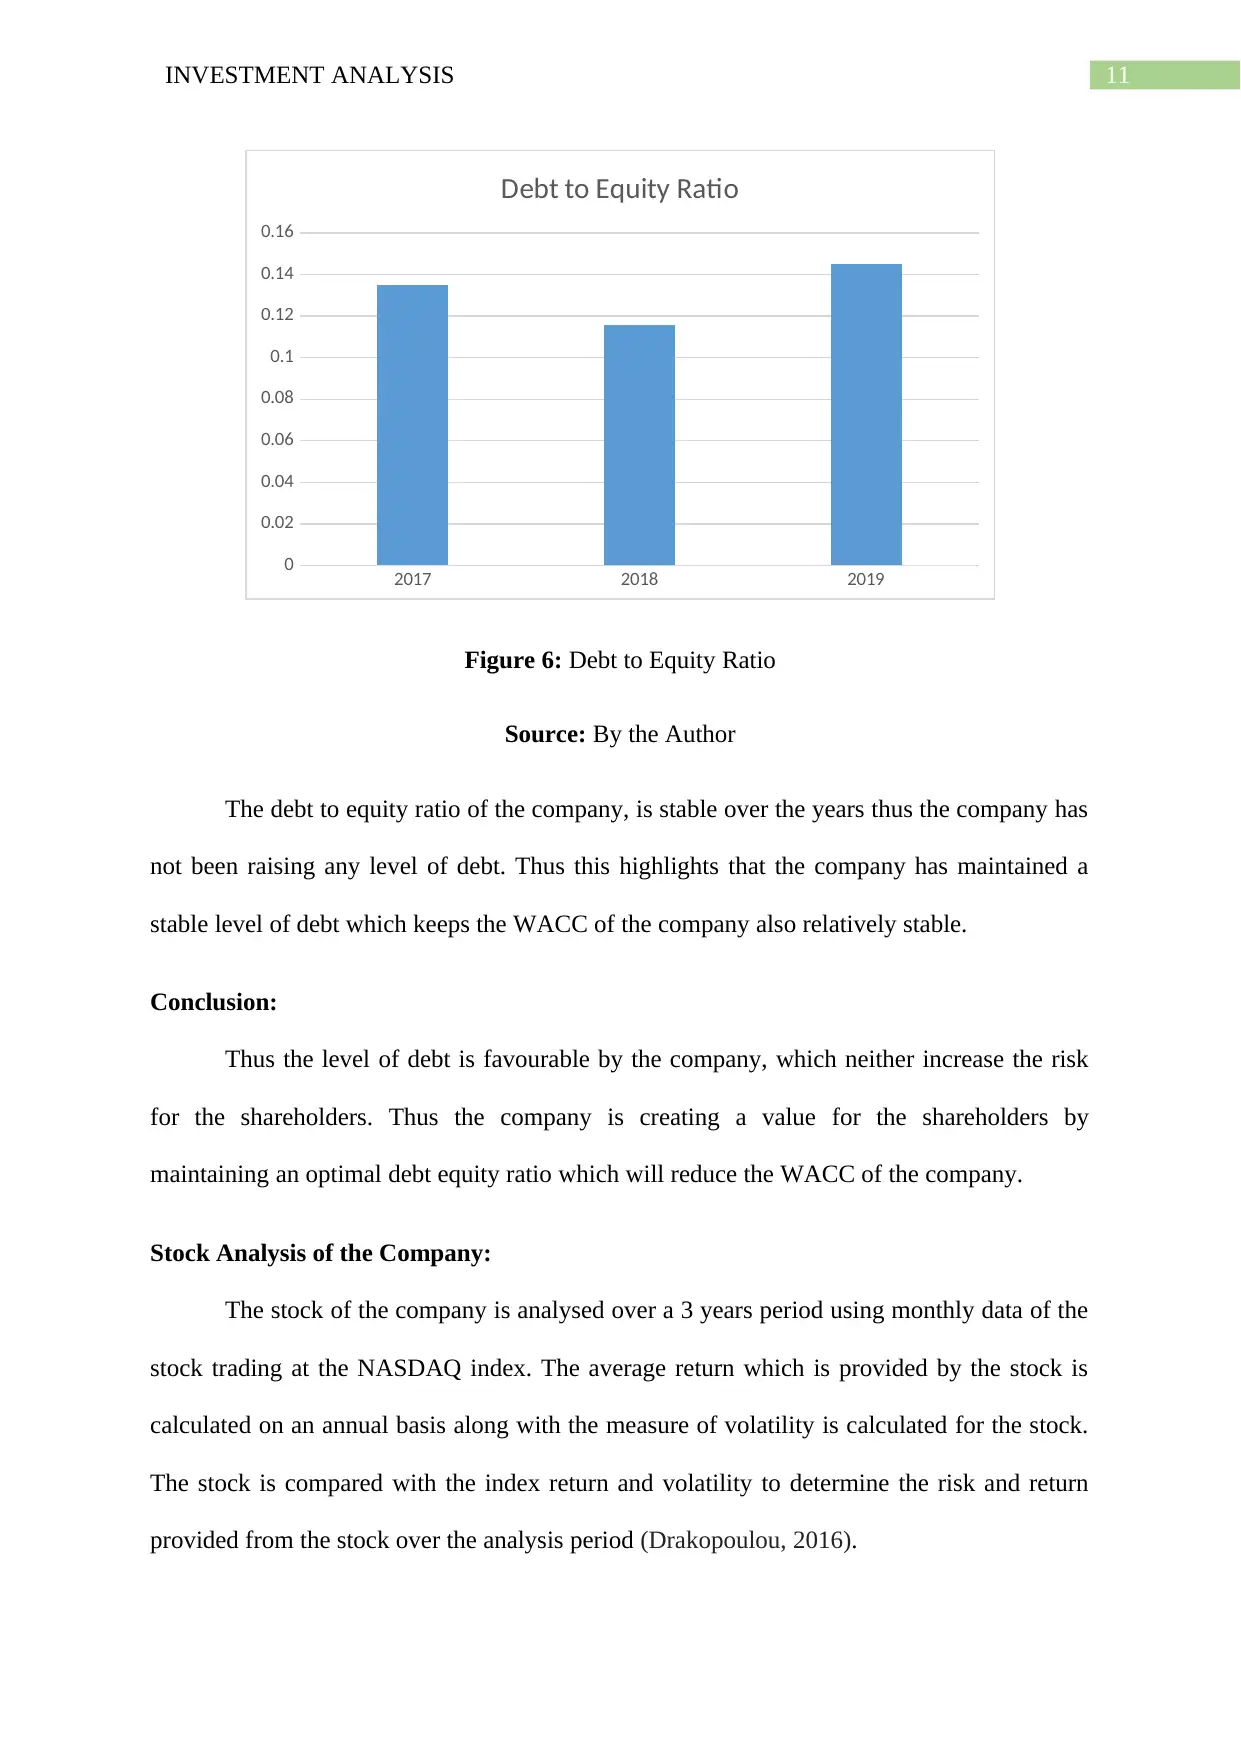
The debt to equity ratio of the company, is stable over the years thus the company has
not been raising any level of debt. Thus this highlights that the company has maintained a
stable level of debt which keeps the WACC of the company also relatively stable.
Conclusion:
Thus the level of debt is favourable by the company, which neither increase the risk
for the shareholders. Thus the company is creating a value for the shareholders by
maintaining an optimal debt equity ratio which will reduce the WACC of the company.
Stock Analysis of the Company:
The stock of the company is analysed over a 3 years period using monthly data of the
stock trading at the NASDAQ index. The average return which is provided by the stock is
calculated on an annual basis along with the measure of volatility is calculated for the stock.
The stock is compared with the index return and volatility to determine the risk and return
provided from the stock over the analysis period (Drakopoulou, 2016).
2017 2018 2019
0
0.02
0.04
0.06
0.08
0.1
0.12
0.14
0.16
Debt to Equity Ratio
Figure 6: Debt to Equity Ratio
Source: By the Author
The debt to equity ratio of the company, is stable over the years thus the company has
not been raising any level of debt. Thus this highlights that the company has maintained a
stable level of debt which keeps the WACC of the company also relatively stable.
Conclusion:
Thus the level of debt is favourable by the company, which neither increase the risk
for the shareholders. Thus the company is creating a value for the shareholders by
maintaining an optimal debt equity ratio which will reduce the WACC of the company.
Stock Analysis of the Company:
The stock of the company is analysed over a 3 years period using monthly data of the
stock trading at the NASDAQ index. The average return which is provided by the stock is
calculated on an annual basis along with the measure of volatility is calculated for the stock.
The stock is compared with the index return and volatility to determine the risk and return
provided from the stock over the analysis period (Drakopoulou, 2016).
⊘ This is a preview!⊘
Do you want full access?
Subscribe today to unlock all pages.
Trusted by 1+ million students worldwide
1 out of 17
Related Documents


Your All-in-One AI-Powered Toolkit for Academic Success.
+13062052269
info@desklib.com
Available 24*7 on WhatsApp / Email
![[object Object]](/_next/static/media/star-bottom.7253800d.svg)
Unlock your academic potential
Copyright © 2020–2026 A2Z Services. All Rights Reserved. Developed and managed by ZUCOL.