FINANCIAL AND ECONOMIC INTERPRETATION OF AMCOR LIMITED

Verified

Added on  2021/05/31

|10
|1448
|65
Report
AI Summary
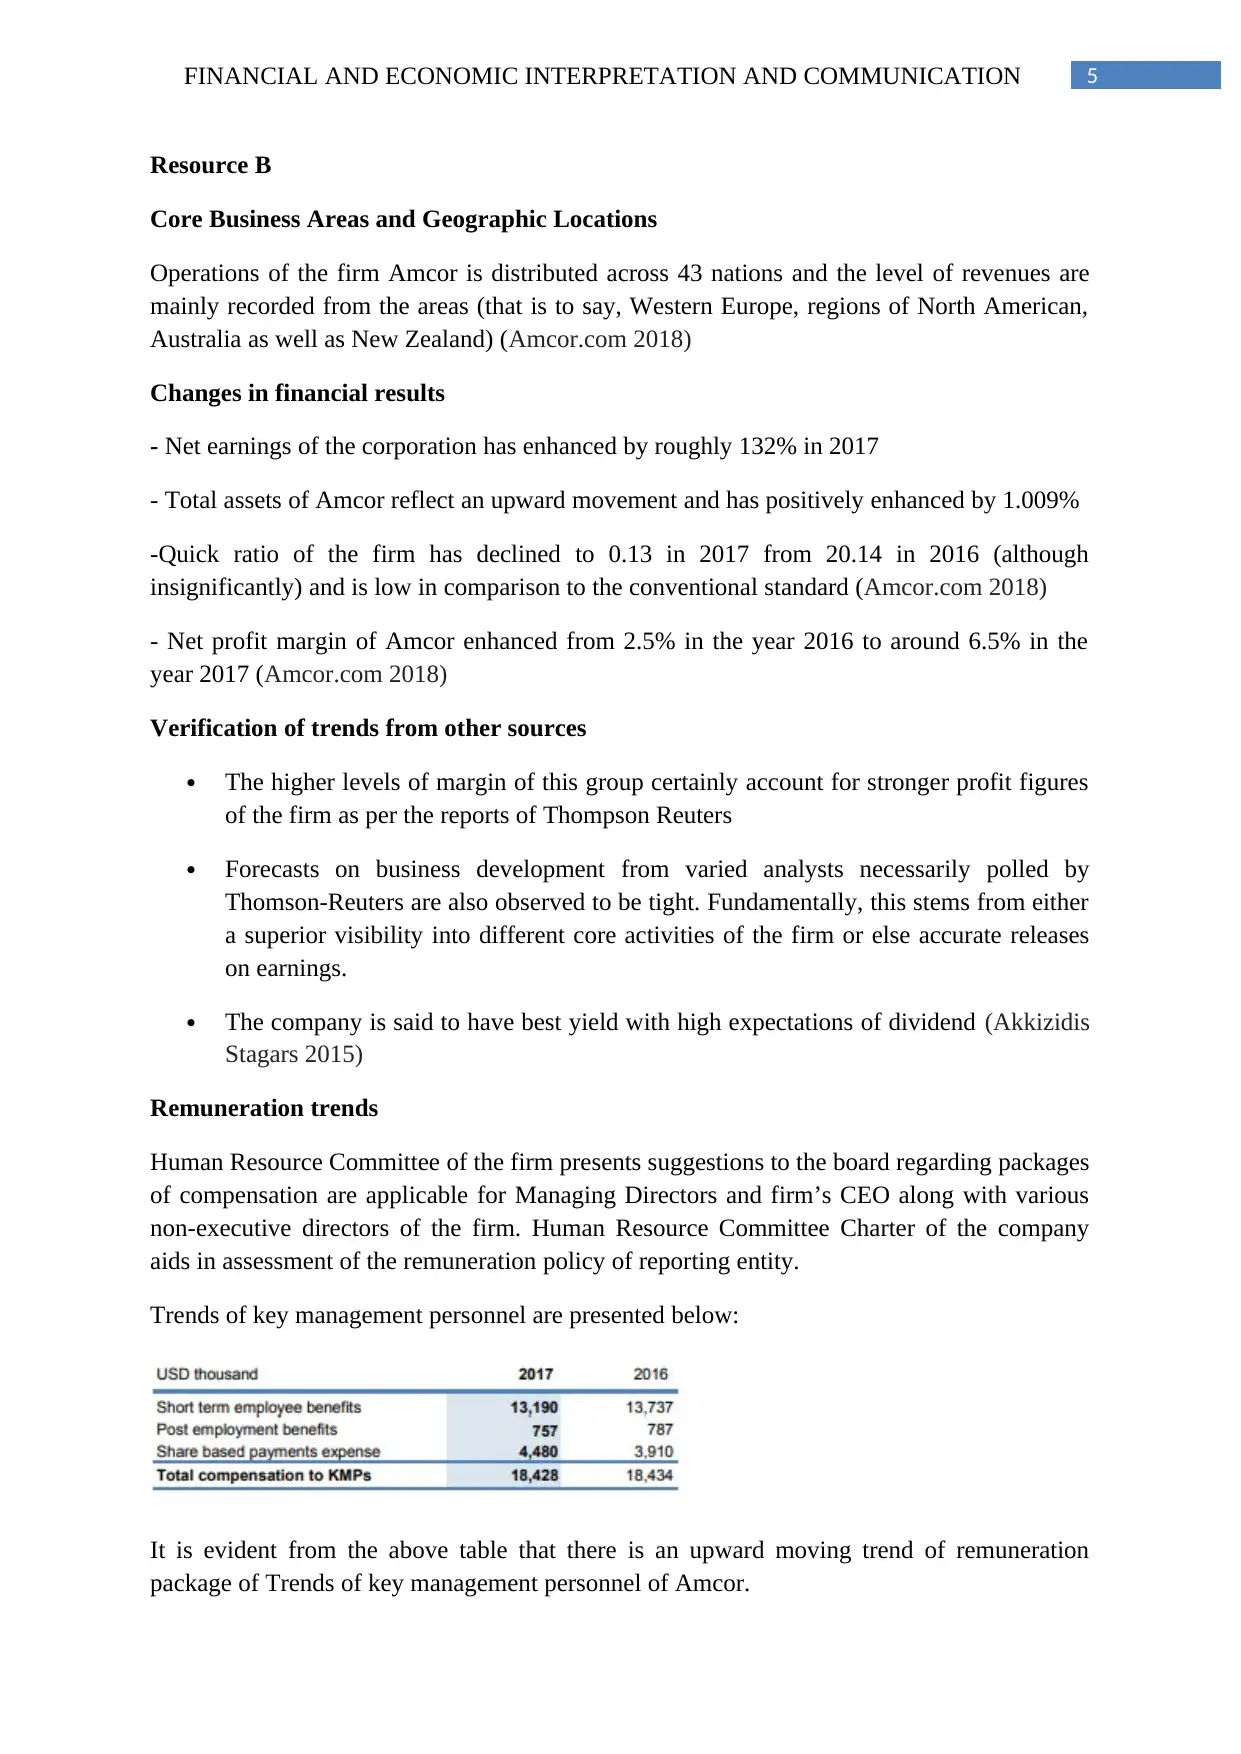
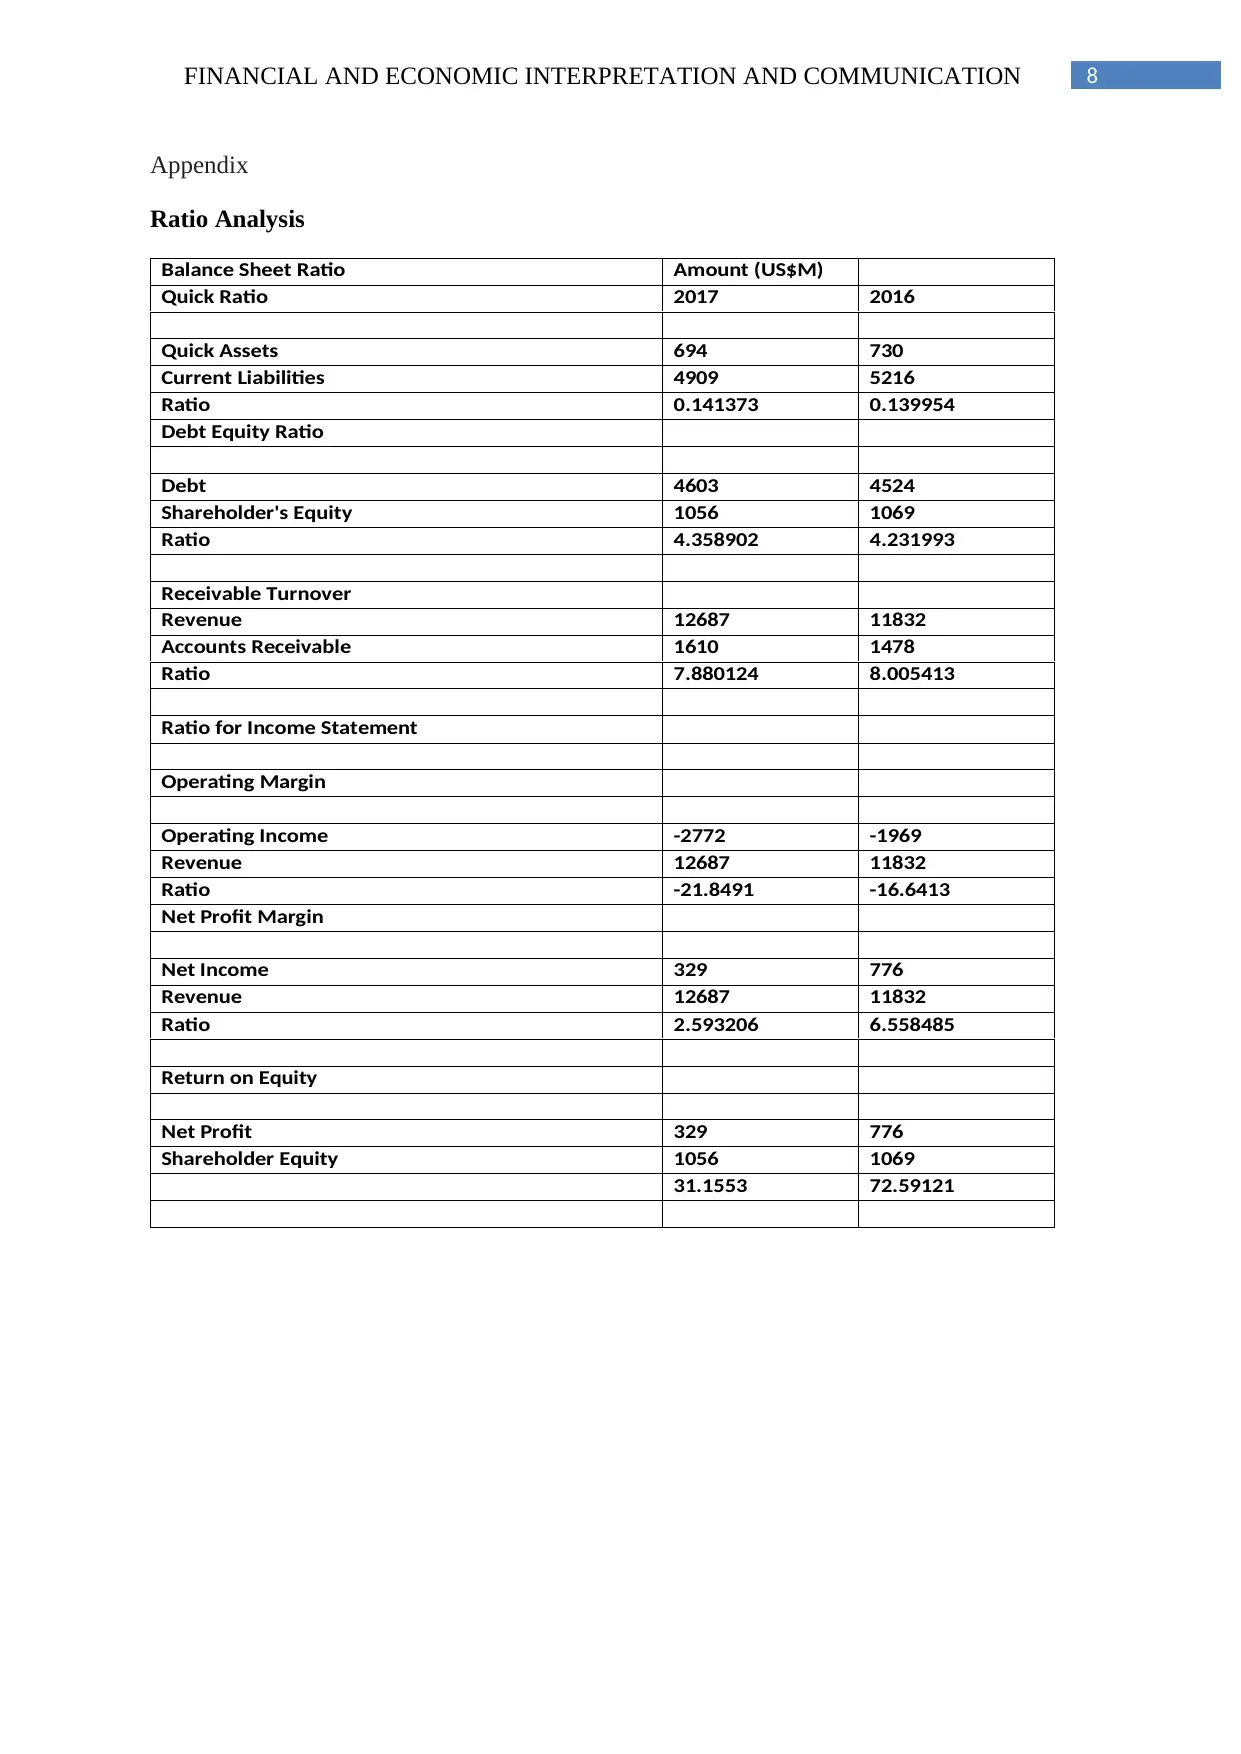
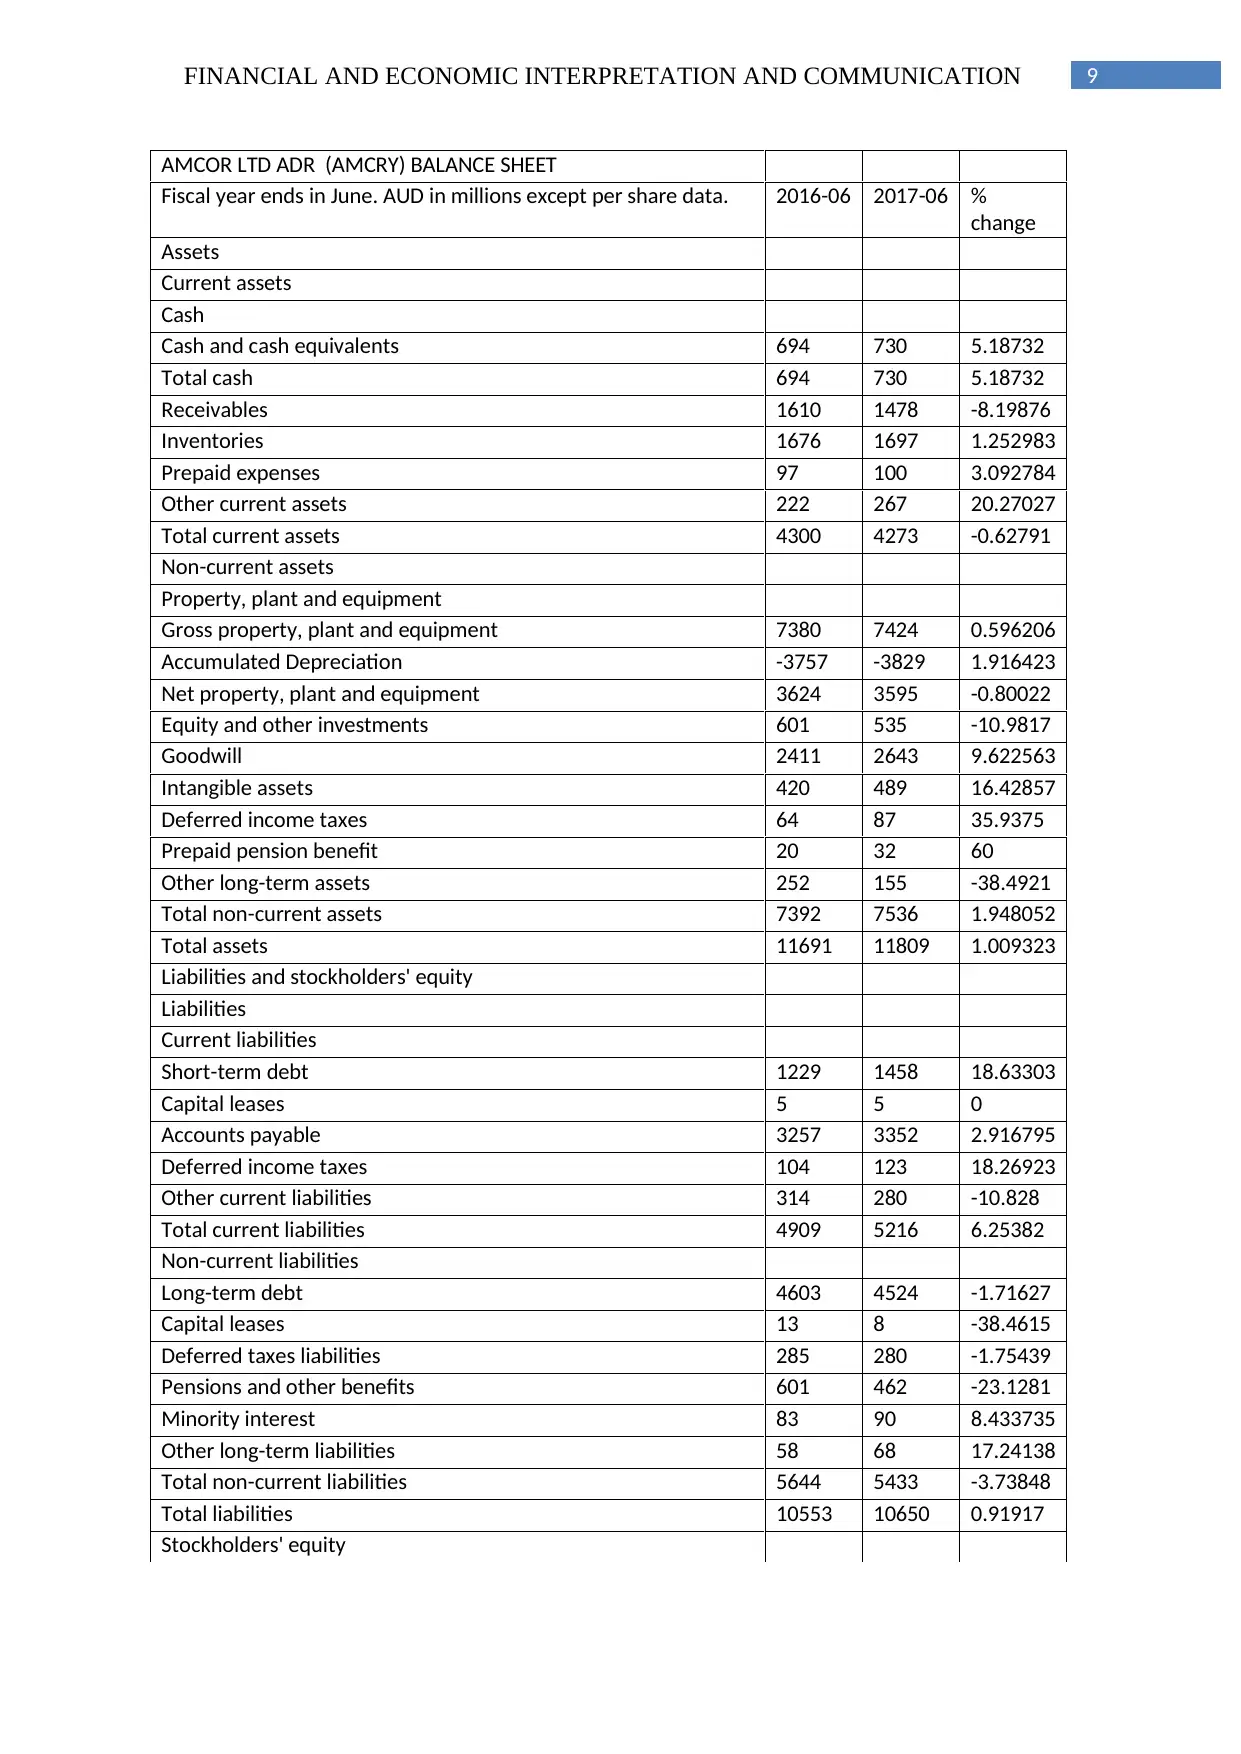
This report provides a financial and economic interpretation of Amcor Limited, a leading Australian-based multinational packaging firm. The study analyzes the company's financial performance using key financial ratio analysis and trend analysis, based on its recent yearly reports and external sources. The analysis covers various financial aspects, including net earnings, revenue, assets, liabilities, debt-equity ratio, quick ratio, receivable turnover, operating margin, net profit margin, and return on equity. The report also examines Amcor's core business areas, geographic locations, and changes in financial results. Furthermore, it verifies trends from other sources and discusses remuneration trends of key management personnel. The conclusion highlights Amcor's desirable financial condition in terms of profitability, driven by organic growth and acquisitions, along with its attractiveness to financiers.
Document Page
Running head: FINANCIAL AND ECONOMIC INTERPRETATION AND
COMMUNICATION
Financial and Economic Interpretation and Communication
University Name
Student Name
Authors’ Note
tabler-icon-diamond-filled.svg

Paraphrase This Document

Need a fresh take? Get an instant paraphrase of this document with our AI Paraphraser
Document Page
2FINANCIAL AND ECONOMIC INTERPRETATION AND COMMUNICATION
Executive Summary
The current study intends to analyse financial conditions of the firm Amcor Limited using the
most recent yearly reports declared by the firm along with information acquired from outside
sources. This study at hand uses key financial ratio analysis and trend analysis for analysing
performance of the firm along with various non-financial information regarding business
activities.
Document Page
3FINANCIAL AND ECONOMIC INTERPRETATION AND COMMUNICATION
Background of the company
Amcor Limited is leading Australia-based multinational Packaging firm that is listed under
the Australian Stock Exchange. This company primarily operates as a manufacturer of
flexible along with rigid packaging, chiefly for the purpose of food, products of health care,
segments of tobacco and many others. Furthermore, this business concern Amcor delivers
products that preserve food, diverse pharmaceutical tools, varied personal, home as well as
personal care merchandise, beverage, medical apparatus (Amcor.com 2018).
Resource A
Brief Commentary on financial health
Evaluation of financial trend of the corporation divulges that the net earnings of the
corporation has enhanced by roughly 132% during the financial year 2017 in comparison to
the figure recorded in the year ago time, even though figure registered for revenue from sales
of the corporation has reduced by around 6.7%. In addition to this, total assets of Amcor
reflect an upward moving trajectory and are observed to have augmented by approximately
1.009% during the financial year 2017. In addition to this, total liabilities of the business
concern have essentially improved by roughly 0.9% (Amcor.com 2018).
Interpretation
Debt equity ratio recorded for the firm Amcor stands at 4.35 during the period 2016,
nevertheless, this specific figure can be observed to be roughly 4.23 during the year
2017 (Cecchetti and Kharroubi 2015). Essentially, this replicates relatively low level
of debt financing as compared to equity funding of the firm during the financial year
2017. Nevertheless, the conventional standard for the debt equity ratio necessarily
stands at 1 (Petersen et al. 2015). Even though the entire figure has lessened during
the period 2017, this recorded figure can be said to be substantially greater than 1
indicating unfavourable financial circumstances (Hoberg et al. 2014).
-Quick ratio of Amcor is enumerated to be approximately 0.14 during the year 2016
whereas the same is said to stand at 0.13 during the financial year 2017. Thus, it can
be hereby mentioned that that the corporation has comparatively lower quick ratio
indicating lower potential of the business concern’s disbursement to satisfy payment
necessities (Gertler and Karadi 2015).
-Amcor’s Receivable turnover is calculated to be approximately 7.88 during the
period 2016 whereas the same has been enumerated to be 8.00 during the period 2017.
Therefore, this reflects an upward rising trend as is evident from enumerated figure
particularly receivable turnover. In essence, Higher Receivable turnover ratio implies
favourable financial circumstances since this reflects that credit sales of the
corporation are more probable to be acquired when compared to a corporation with
low ratio (Warren and Jones 2018).
Document Page
4FINANCIAL AND ECONOMIC INTERPRETATION AND COMMUNICATION
Amcor’s Operating margin is observed to be negative since the operating income is
seen to be negative (Titman et al. 2017). Nevertheless, this current state of affairs is
said to enhance during the period 2017 having low negative number of particularly
operating income (Dewachter et al. 2015).
On the other hand, net profit margin of Amcor can be observed to have enhanced
from the recorded figure of approximately 2.5% in the year 2016 to around 6.5% in
the year 2017 replicating favourable financial state of affairs and sound financial
health of the business concern. In addition to this, return on equity calculated for the
firm Amcor can be observed to have risen from roughly 31.15% in the year 2016 to
approximately 72.59% in the year 2017, reflecting higher capability of the reporting
entity to generate returns from obtainable equity (Pierson et al. 2015). This is due to
earnings increased in both the segments of Flexibles as well as Rigid Plastics,
determined by organic growth as well as acquisitions.
tabler-icon-diamond-filled.svg

Paraphrase This Document

Need a fresh take? Get an instant paraphrase of this document with our AI Paraphraser
Document Page
5FINANCIAL AND ECONOMIC INTERPRETATION AND COMMUNICATION
Resource B
Core Business Areas and Geographic Locations
Operations of the firm Amcor is distributed across 43 nations and the level of revenues are
mainly recorded from the areas (that is to say, Western Europe, regions of North American,
Australia as well as New Zealand) (Amcor.com 2018)
Changes in financial results
- Net earnings of the corporation has enhanced by roughly 132% in 2017
- Total assets of Amcor reflect an upward movement and has positively enhanced by 1.009%
-Quick ratio of the firm has declined to 0.13 in 2017 from 20.14 in 2016 (although
insignificantly) and is low in comparison to the conventional standard (Amcor.com 2018)
- Net profit margin of Amcor enhanced from 2.5% in the year 2016 to around 6.5% in the
year 2017 (Amcor.com 2018)
Verification of trends from other sources
The higher levels of margin of this group certainly account for stronger profit figures
of the firm as per the reports of Thompson Reuters
Forecasts on business development from varied analysts necessarily polled by
Thomson-Reuters are also observed to be tight. Fundamentally, this stems from either
a superior visibility into different core activities of the firm or else accurate releases
on earnings.
The company is said to have best yield with high expectations of dividend (Akkizidis
Stagars 2015)
Remuneration trends
Human Resource Committee of the firm presents suggestions to the board regarding packages
of compensation are applicable for Managing Directors and firm’s CEO along with various
non-executive directors of the firm. Human Resource Committee Charter of the company
aids in assessment of the remuneration policy of reporting entity.
Trends of key management personnel are presented below:
It is evident from the above table that there is an upward moving trend of remuneration
package of Trends of key management personnel of Amcor.
Document Page
6FINANCIAL AND ECONOMIC INTERPRETATION AND COMMUNICATION
Conclusion
The above mentioned study reveals the fact that the financial condition of the firm is
desirable in terms of profitability and earnings determined by organic growth as well as
acquisitions in addition to restructuring initiatives. Also, the company has best yield with
high expectations of dividend making it attractive to the financiers.
Document Page
7FINANCIAL AND ECONOMIC INTERPRETATION AND COMMUNICATION
References
Akkizidis, I. and Stagars, M., 2015. Marketplace lending, Financial Analysis, and the Future
of credit: Integration, Profitability, and risk management. John Wiley & Sons.
Cecchetti, S.G. and Kharroubi, E., 2015. Why does financial sector growth crowd out real
economic growth?.
Dewachter, H., Iania, L., Lyrio, M. and de Sola Perea, M., 2015. A macro-financial analysis
of the euro area sovereign bond market. Journal of Banking & Finance, 50, pp.308-325.
Gertler, M. and Karadi, P., 2015. Monetary policy surprises, credit costs, and economic
activity. American Economic Journal: Macroeconomics, 7(1), pp.44-76.
Hoberg, G., Phillips, G. and Prabhala, N., 2014. Product market threats, payouts, and
financial flexibility. The Journal of Finance, 69(1), pp.293-324.
Petersen, J.A., Kushwaha, T. and Kumar, V., 2015. Marketing communication strategies and
consumer financial decision making: The role of national culture. Journal of
Marketing, 79(1), pp.44-63.
Pierson, K., Hand, M.L. and Thompson, F., 2015. The government finance database: A
common resource for quantitative research in public financial analysis. PloS one, 10(6),
p.e0130119.
Titman, S., Keown, A.J. and Martin, J.D., 2017. Financial management: Principles and
applications. Pearson.
Warren, C.S. and Jones, J., 2018. Corporate financial accounting. Cengage Learning.
Amcor.com. 2018. Retrieved from https://www.amcor.com/about/media-centre/news/amcor-
announces-full-year-results-for-the-year-ended-30-june-2017
tabler-icon-diamond-filled.svg

Paraphrase This Document

Need a fresh take? Get an instant paraphrase of this document with our AI Paraphraser
Document Page
8FINANCIAL AND ECONOMIC INTERPRETATION AND COMMUNICATION
Appendix
Ratio Analysis
Balance Sheet Ratio Amount (US$M)
Quick Ratio 2017 2016
Quick Assets 694 730
Current Liabilities 4909 5216
Ratio 0.141373 0.139954
Debt Equity Ratio
Debt 4603 4524
Shareholder's Equity 1056 1069
Ratio 4.358902 4.231993
Receivable Turnover
Revenue 12687 11832
Accounts Receivable 1610 1478
Ratio 7.880124 8.005413
Ratio for Income Statement
Operating Margin
Operating Income -2772 -1969
Revenue 12687 11832
Ratio -21.8491 -16.6413
Net Profit Margin
Net Income 329 776
Revenue 12687 11832
Ratio 2.593206 6.558485
Return on Equity
Net Profit 329 776
Shareholder Equity 1056 1069
31.1553 72.59121
Document Page
9FINANCIAL AND ECONOMIC INTERPRETATION AND COMMUNICATION
AMCOR LTD ADR (AMCRY) BALANCE SHEET
Fiscal year ends in June. AUD in millions except per share data. 2016-06 2017-06 %
change
Assets
Current assets
Cash
Cash and cash equivalents 694 730 5.18732
Total cash 694 730 5.18732
Receivables 1610 1478 -8.19876
Inventories 1676 1697 1.252983
Prepaid expenses 97 100 3.092784
Other current assets 222 267 20.27027
Total current assets 4300 4273 -0.62791
Non-current assets
Property, plant and equipment
Gross property, plant and equipment 7380 7424 0.596206
Accumulated Depreciation -3757 -3829 1.916423
Net property, plant and equipment 3624 3595 -0.80022
Equity and other investments 601 535 -10.9817
Goodwill 2411 2643 9.622563
Intangible assets 420 489 16.42857
Deferred income taxes 64 87 35.9375
Prepaid pension benefit 20 32 60
Other long-term assets 252 155 -38.4921
Total non-current assets 7392 7536 1.948052
Total assets 11691 11809 1.009323
Liabilities and stockholders' equity
Liabilities
Current liabilities
Short-term debt 1229 1458 18.63303
Capital leases 5 5 0
Accounts payable 3257 3352 2.916795
Deferred income taxes 104 123 18.26923
Other current liabilities 314 280 -10.828
Total current liabilities 4909 5216 6.25382
Non-current liabilities
Long-term debt 4603 4524 -1.71627
Capital leases 13 8 -38.4615
Deferred taxes liabilities 285 280 -1.75439
Pensions and other benefits 601 462 -23.1281
Minority interest 83 90 8.433735
Other long-term liabilities 58 68 17.24138
Total non-current liabilities 5644 5433 -3.73848
Total liabilities 10553 10650 0.91917
Stockholders' equity
Document Page
10FINANCIAL AND ECONOMIC INTERPRETATION AND COMMUNICATION
chevron_up_icon
1 out of 10
circle_padding
hide_on_mobile
zoom_out_icon
[object Object]