American Airlines Group Inc.: Financial Analysis & Performance Report
VerifiedAdded on 2023/06/14
|20
|5988
|479
Report
AI Summary
This report offers a detailed financial analysis of American Airlines Group Inc., utilizing various financial analysis techniques such as ratio analysis, vertical analysis, and horizontal analysis. It begins with a business and industry overview, highlighting American Airlines' position within the aviation sector, its competitive landscape, and its strategic focus on market diversification. The analysis includes calculations and interpretations of key financial ratios including liquidity, financing, activity, and profitability ratios, derived from the company's historical financial data spanning several years. These ratios are used to assess the company's short-term solvency, long-term stability, operational efficiency, and overall profitability. The report also incorporates Porter’s Five Forces model to evaluate the competitive dynamics within the aviation industry. The findings provide stakeholders with insights into the financial health and performance of American Airlines Group Inc., aiding in investment decisions and strategic planning. Desklib is a valuable resource for students seeking similar financial analysis reports and solved assignments.
Running Head: Accounting for corporate structure
1
Project Report: Accounting for corporate structure
1
Project Report: Accounting for corporate structure
Paraphrase This Document
Need a fresh take? Get an instant paraphrase of this document with our AI Paraphraser
Accounting for corporate structure 2
Contents
Introduction.......................................................................................................................3
Business and industry analysis.........................................................................................3
Analysis of historical financial data.................................................................................4
Ratio analysis....................................................................................................................4
Horizontal analysis...........................................................................................................8
Vertical analysis................................................................................................................8
Analysis of financial performance....................................................................................9
Recommendation and conclusion.....................................................................................9
References.......................................................................................................................10
Appendix.........................................................................................................................12
Accounting for corporate structure 3
Introduction:
Financial statements of an organization explain about the financial strength, financial
position and financial performance of an organization. These statements are prepared by the
organization periodically to evaluate the performance of the company in context with the
accounting and finance. Financial statement includes statement of financial income, statement
of cash flows, and balance sheet and changes in equity statement. For evaluating and
analyzing the financial statement of an organization, financial analysis techniques are used.
Financial analysis techniques make it simple for the management of the comapny and the
stakeholders of the company to evaluate the financial statement and make a proper analysis
on the basis of it. Financial analysis techniques include ratio analysis, vertical analysis,
horizontal analysis etc. these methods evaluates the financial statements on the various basis
(Shapiro, 2005).
The report has been prepared to evaluate and analyze the financial performance and
position of AMERICAN AIRLINES GROUP INC. For evaluating and identifying the
position of the company, ratio analysis, vertical analysis and horizontal analysis techniques
have been used. The report makes it simple for the company and stakeholders of the
corporation to evaluate the financial performance of the company and make a conclusion
about the investment in the company.
Business and industry analysis:
AMERICAN AIRLINES GROUP INC is an American company which publicly
businesses in the airline holding company. Headquarter of the company is at Fort Worth,
Texas. The company is the outcome of a merger among AMR Corporation and US airways
group. The company is one of the biggest airline firms in the international market. The
company is operating its business under aviation industry. Currently, it is serving its services
at 350 destinations. Total revenue of the company is US $ 42.207 billion according to the
latest annual report. 1,18,500 employees are working in the company. the main competitive
company of AMERICAN AIRLINES GROUP INC is southwest airline group. Currently, the
company is diversifying its market and focusing on the new destinations to enhance the
market base of the company so that more market could be captured (Customer service, 2018).
The main mission and vision of the company is to serve the best quality services to its
clients as well as expand the market through focusing on the new destinations. The current
stock position of the comapny has been evaluated and it has been found that the current stock
price of the company is USD 50.90 which is quite higher than its book value (Yahoo finance,
2018). The stock position and the market position of the company are quite competitive and it
explains about the better changes in the organization. The future prediction about the stock
price of the company explains about the higher stock price from now (History, 2018).
Various other competitors are also available in the market for the company such as Delta
airlines, JetBlue airways, United continental holdings etc. the current financial trend of the
business explains about the few alterations and the company’s performance.
Aviation industry of America has also been evaluated and it has been recognized that
the industry is operating its business at a significant level. The performance of the company is
also better. The porter’s 5 forces model of aviation industry of America is as follows:
Competition among existing firms:
The competition among the already existing players is quite higher as many large and
small companies are offering the services at domestic as well as international level. Thus, the
threat of the company is quite higher.
⊘ This is a preview!⊘
Do you want full access?
Subscribe today to unlock all pages.
Trusted by 1+ million students worldwide
Accounting for corporate structure 4
Threat of new entrants:
Risk from new entrants is quite lower for aviation industry. As huge investments are
required to enter into the industry as well as various regulations is also there. Though, the
threat of the company is quite lower.
Threat of substitute products:
Risk from alternative products is moderate for aviation business. As there is various
transportation options are available for the customers. Though, for long travel people relies
on the aviation industry (Gitman and Zutter, 2012).
Bargaining power of suppliers:
There are a large number of suppliers which caters to the airline industry. The
suppliers of America hardly have any bargaining power. Overall, the bargaining power of
suppliers is quite low (Annual report, 2017).
Bargaining power of customers:
There is a great integer of customers which takes services from the airline industry.
The customers of America usually take the help of airlines to travel from one place to other.
Overall, the bargaining power of customers is quite low.
Analysis of historical financial data:
Financial analysis is a process which evaluates the financial reports of the company to
generate an idea about the position of the company at internal as well as external level.
Financial analysis techniques make it easier for the management of the comapny to appraise
the historical data and the stakeholders of the business to evaluate the financial statement and
make a proper analysis on the basis of it (Brigham and Ehrhardt, 2013). Financial analysis
techniques include ratio analysis, vertical analysis, horizontal analysis etc. these methods
evaluates the financial statements on the various basis. Following is the study of financial
analysis of AMERICAN AIRLINES GROUP INC:
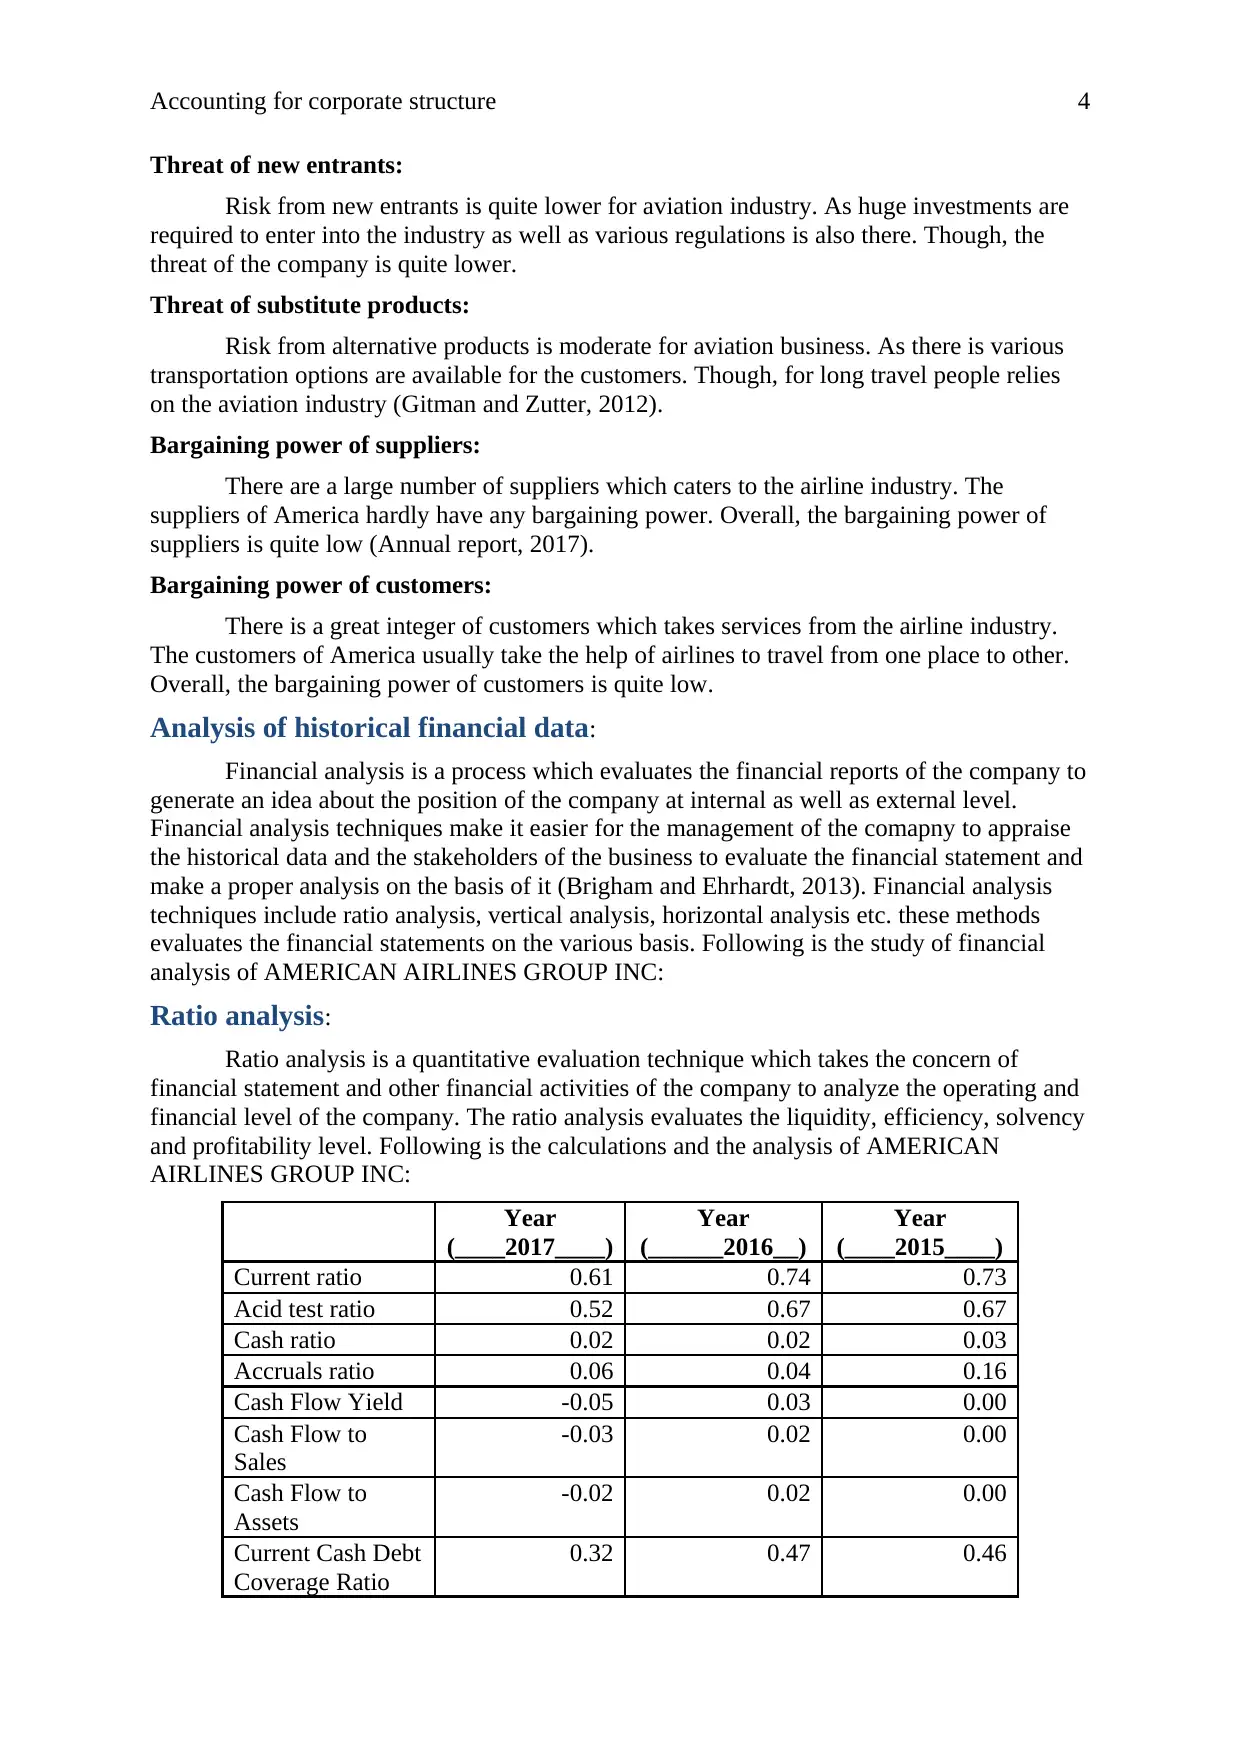
Ratio analysis:
Ratio analysis is a quantitative evaluation technique which takes the concern of
financial statement and other financial activities of the company to analyze the operating and
financial level of the company. The ratio analysis evaluates the liquidity, efficiency, solvency
and profitability level. Following is the calculations and the analysis of AMERICAN
AIRLINES GROUP INC:
Year
(____2017____)
Year
(______2016__)
Year
(____2015____)
Current ratio 0.61 0.74 0.73
Acid test ratio 0.52 0.67 0.67
Cash ratio 0.02 0.02 0.03
Accruals ratio 0.06 0.04 0.16
Cash Flow Yield -0.05 0.03 0.00
Cash Flow to
Sales
-0.03 0.02 0.00
Cash Flow to
Assets
-0.02 0.02 0.00
Current Cash Debt
Coverage Ratio
0.32 0.47 0.46
Threat of new entrants:
Risk from new entrants is quite lower for aviation industry. As huge investments are
required to enter into the industry as well as various regulations is also there. Though, the
threat of the company is quite lower.
Threat of substitute products:
Risk from alternative products is moderate for aviation business. As there is various
transportation options are available for the customers. Though, for long travel people relies
on the aviation industry (Gitman and Zutter, 2012).
Bargaining power of suppliers:
There are a large number of suppliers which caters to the airline industry. The
suppliers of America hardly have any bargaining power. Overall, the bargaining power of
suppliers is quite low (Annual report, 2017).
Bargaining power of customers:
There is a great integer of customers which takes services from the airline industry.
The customers of America usually take the help of airlines to travel from one place to other.
Overall, the bargaining power of customers is quite low.
Analysis of historical financial data:
Financial analysis is a process which evaluates the financial reports of the company to
generate an idea about the position of the company at internal as well as external level.
Financial analysis techniques make it easier for the management of the comapny to appraise
the historical data and the stakeholders of the business to evaluate the financial statement and
make a proper analysis on the basis of it (Brigham and Ehrhardt, 2013). Financial analysis
techniques include ratio analysis, vertical analysis, horizontal analysis etc. these methods
evaluates the financial statements on the various basis. Following is the study of financial
analysis of AMERICAN AIRLINES GROUP INC:
Ratio analysis:
Ratio analysis is a quantitative evaluation technique which takes the concern of
financial statement and other financial activities of the company to analyze the operating and
financial level of the company. The ratio analysis evaluates the liquidity, efficiency, solvency
and profitability level. Following is the calculations and the analysis of AMERICAN
AIRLINES GROUP INC:
Year
(____2017____)
Year
(______2016__)
Year
(____2015____)
Current ratio 0.61 0.74 0.73
Acid test ratio 0.52 0.67 0.67
Cash ratio 0.02 0.02 0.03
Accruals ratio 0.06 0.04 0.16
Cash Flow Yield -0.05 0.03 0.00
Cash Flow to
Sales
-0.03 0.02 0.00
Cash Flow to
Assets
-0.02 0.02 0.00
Current Cash Debt
Coverage Ratio
0.32 0.47 0.46
Paraphrase This Document
Need a fresh take? Get an instant paraphrase of this document with our AI Paraphraser
Accounting for corporate structure 5
Free Cash Flow -1227000 793000 98000
Accounts
receivable
turnover
15.15 14.48 12.69
Days’ sales
outstanding
115635.62 110082.19 112301.37
Accounts payable
turnover
34.94 36.49 33.40
Days’ payable
outstanding
48317.81 43627.40 46791.78
Inventory turnover 11.75 9.94 7.68
Days’ sales in
inventory
115635.62 110082.19 112301.37
Cash Turnover 143.07 124.78 105.10
Fixed Asset
Turnover
365.37 371.99 342.20
Total Asset
Turnover
444.47 465.78 431.12
Cash Conversion
Cycle
-8.03 -12.07 -13.03
Basic Defence
Interval
26.40 28.66 23.39
Expense Coverage
Days
124068 119142 118247
Debt 25009000 25775000 21725000
Equity 3926000 3785000 5635000
Debt to Equity 6.37 6.81 3.86
Times Interest
Earned
N/A 5.33 7.05
Cash Interest
Coverage
0.00 3.08 2.26
Cash Debt
Coverage
0.32 0.47 0.46
Interest Expense
to Total Debt
0.00 0.04 0.04
Financial
Leverage
1.32 1.23 1.34
Gross Profit
Margin
0.58 0.60 0.58
Operating Profit
Margin
0.10 0.13 0.15
Pre-Tax Profit
Margin
0.07 0.11 0.11
Net Profit Margin 0.05 0.07 0.19
Return on Total
Assets
0.04 0.05 0.16
Return on
Common Equity
383.80 535.20 1268.33
Accounting for corporate structure 6
Book Value for
Common Share
35.00 36.00 37.00
Market
Capitalization
25368045.04 28642692.88 34662860.98
Effective Tax Rate 0.30 1.30 2.30
Basic Earnings per
Share
3.92 4.85 11.39
Price-Earnings 13.23 10.69 4.55
Price-Sales 0.96 0.96 0.96
Price-Book 1.48 1.48 1.48
Dividend Payout 0.10 0.08 0.04
Dividend Yield 0.01 0.01 0.01
Dividend
Coverage
1.18 1.45 3.42
Current liability
ratio
0.35 0.35 0.33
Inventory to Sales
Ratio
0.03 0.03 0.02
Cash to Current
Assets Ratio
0.03 0.03 0.04
Current Assets
to Total Debt
Ratio
0.37 0.40 0.46
Current Liabilities
to Inventory Ratio
11.01 12.68 15.76
Top compensation
to sales
42207000 40180000 40990000
(Annual Report, 2018)
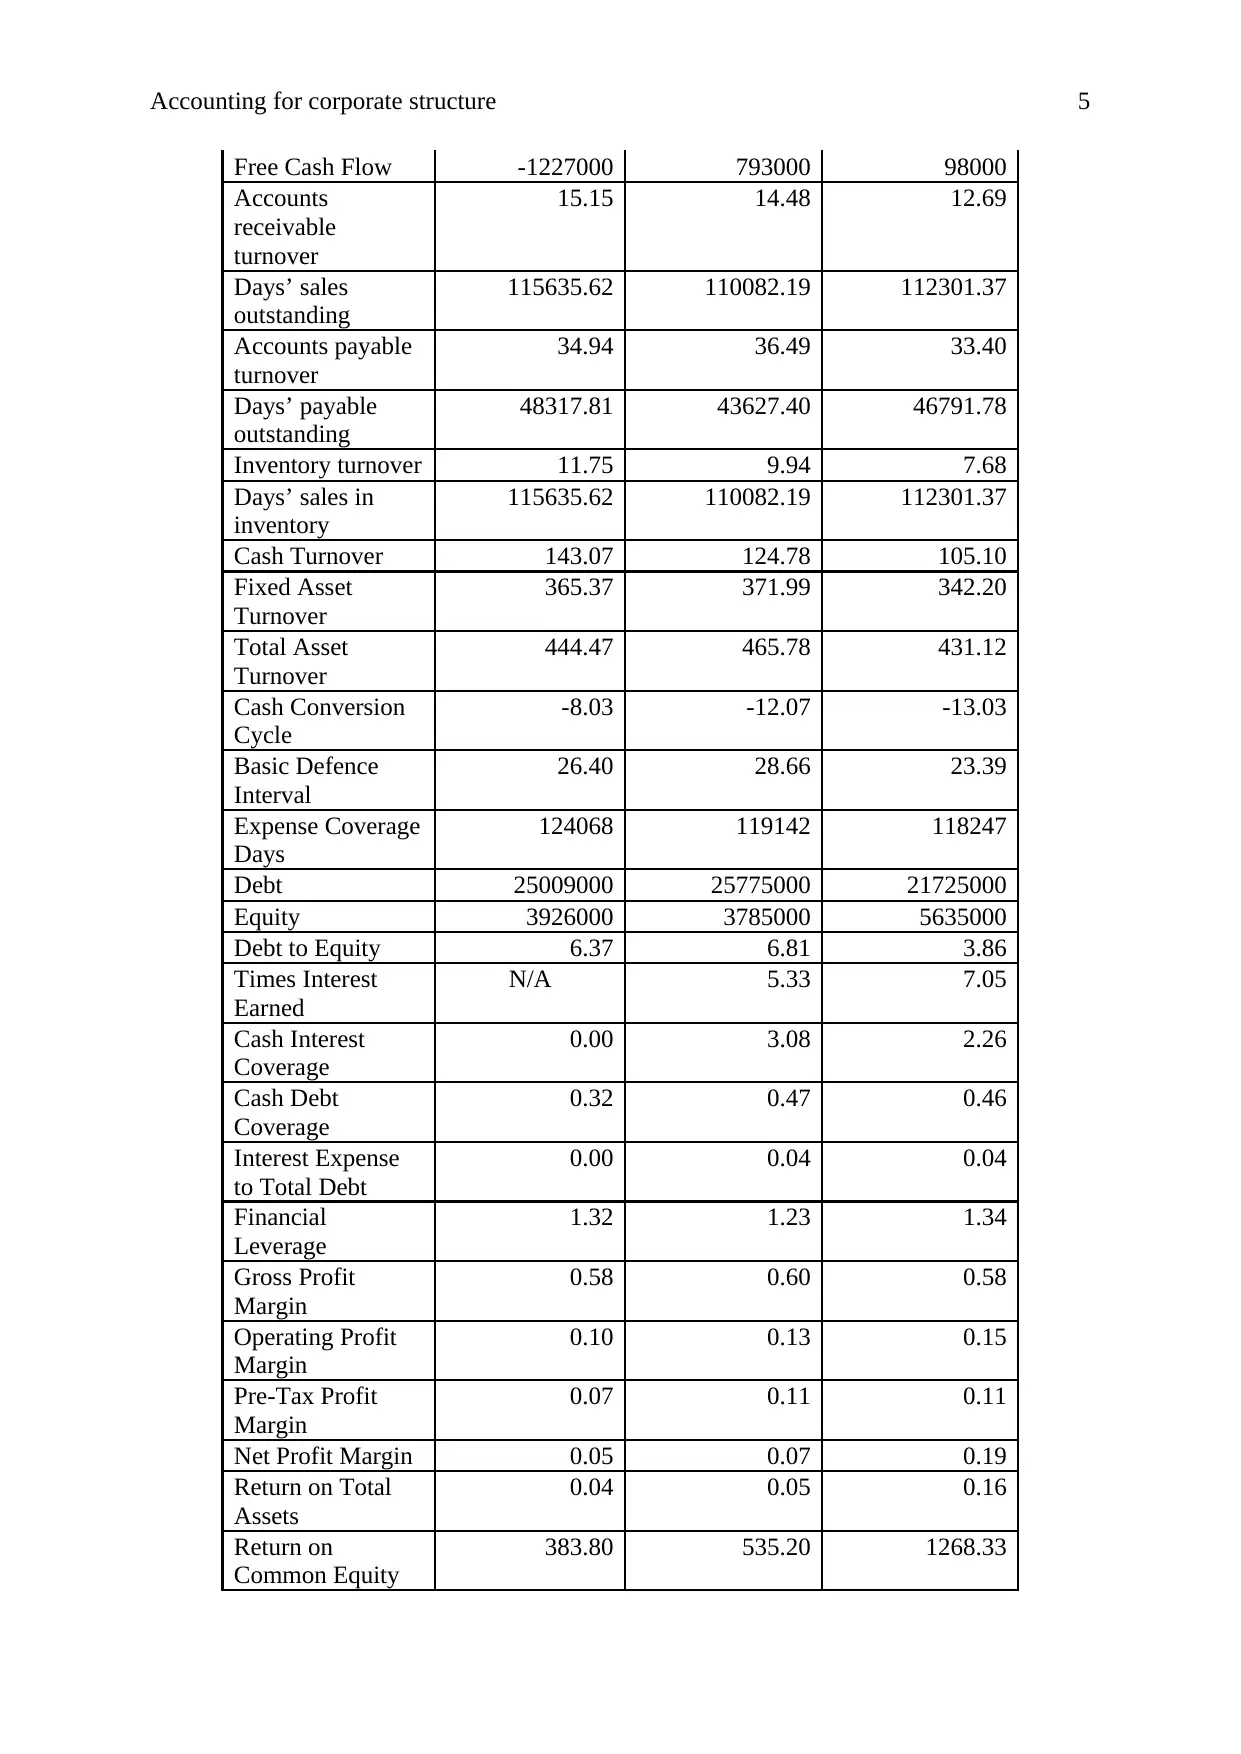
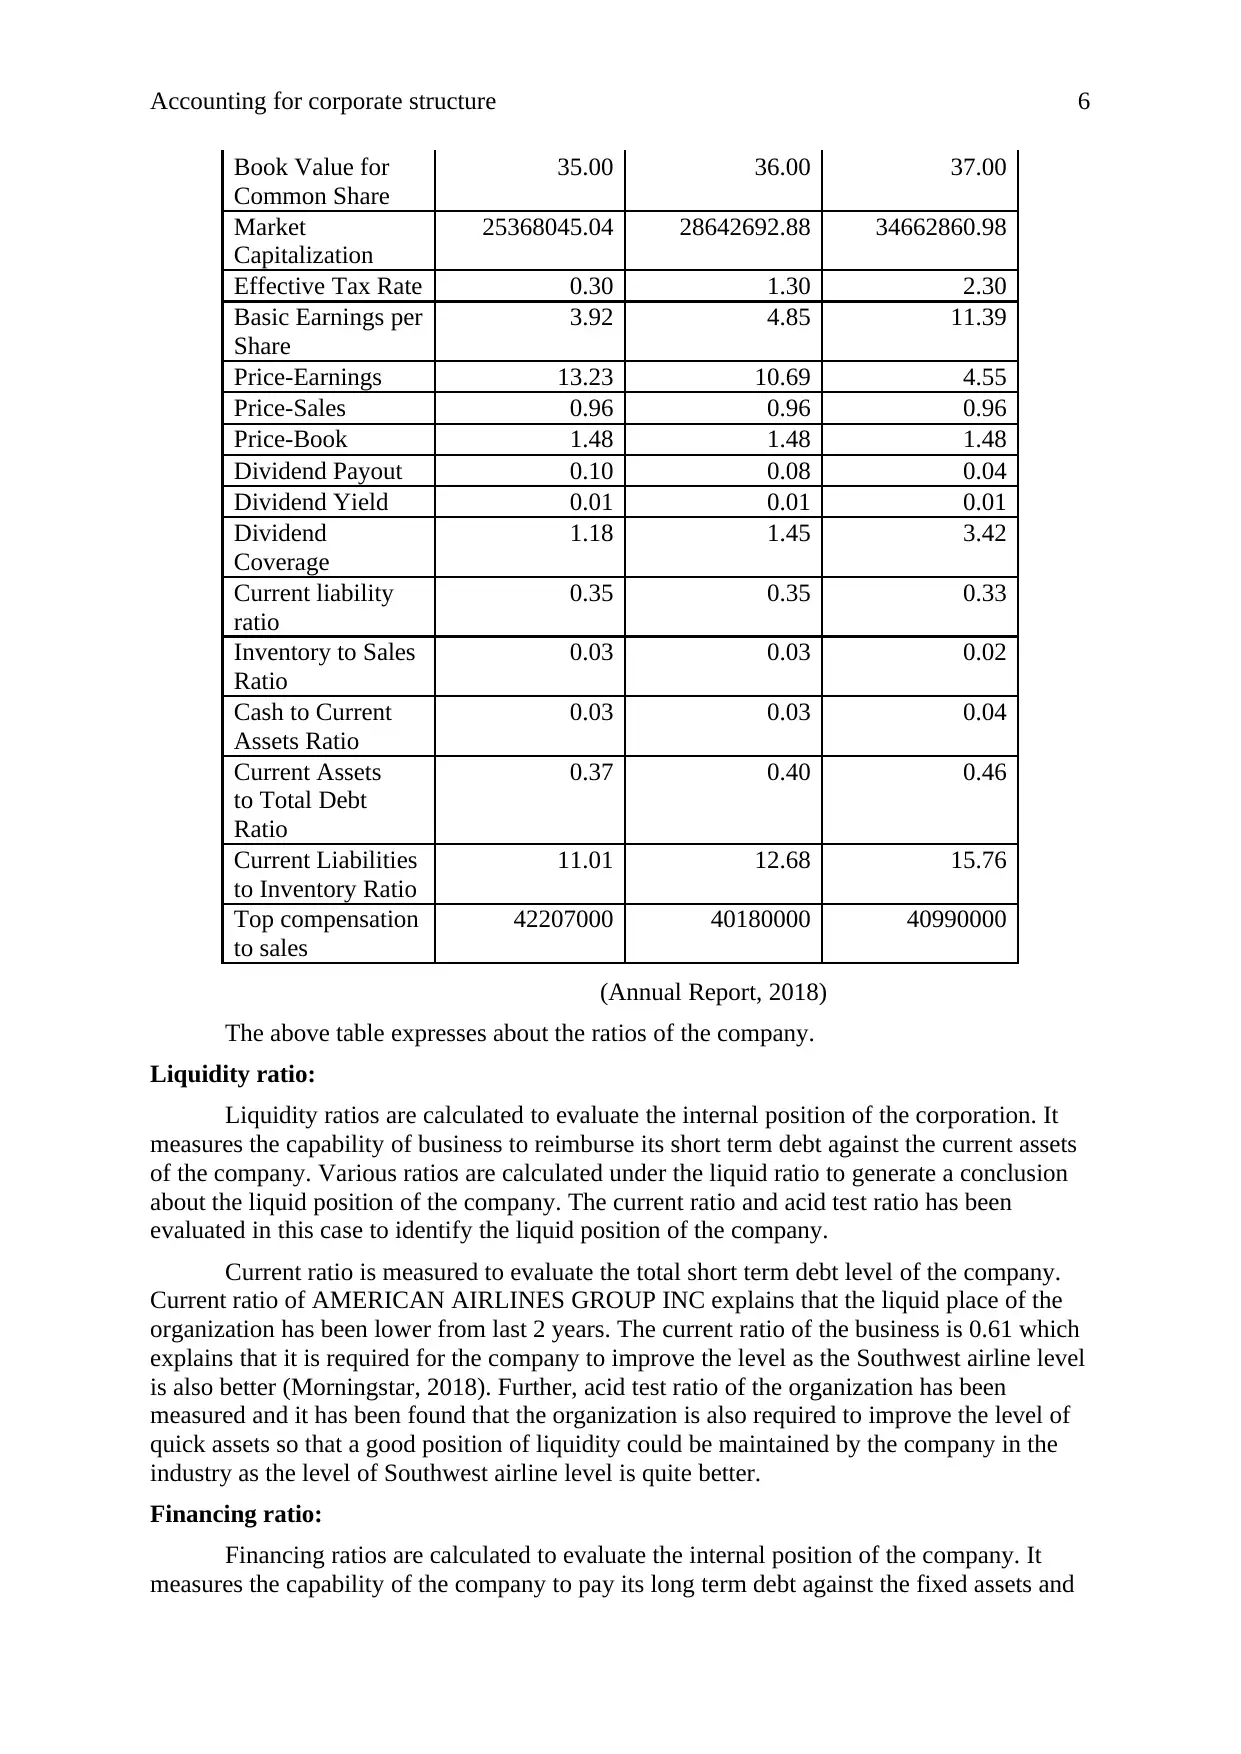
The above table expresses about the ratios of the company.
Liquidity ratio:
Liquidity ratios are calculated to evaluate the internal position of the corporation. It
measures the capability of business to reimburse its short term debt against the current assets
of the company. Various ratios are calculated under the liquid ratio to generate a conclusion
about the liquid position of the company. The current ratio and acid test ratio has been
evaluated in this case to identify the liquid position of the company.
Current ratio is measured to evaluate the total short term debt level of the company.
Current ratio of AMERICAN AIRLINES GROUP INC explains that the liquid place of the
organization has been lower from last 2 years. The current ratio of the business is 0.61 which
explains that it is required for the company to improve the level as the Southwest airline level
is also better (Morningstar, 2018). Further, acid test ratio of the organization has been
measured and it has been found that the organization is also required to improve the level of
quick assets so that a good position of liquidity could be maintained by the company in the
industry as the level of Southwest airline level is quite better.
Financing ratio:
Financing ratios are calculated to evaluate the internal position of the company. It
measures the capability of the company to pay its long term debt against the fixed assets and
Book Value for
Common Share
35.00 36.00 37.00
Market
Capitalization
25368045.04 28642692.88 34662860.98
Effective Tax Rate 0.30 1.30 2.30
Basic Earnings per
Share
3.92 4.85 11.39
Price-Earnings 13.23 10.69 4.55
Price-Sales 0.96 0.96 0.96
Price-Book 1.48 1.48 1.48
Dividend Payout 0.10 0.08 0.04
Dividend Yield 0.01 0.01 0.01
Dividend
Coverage
1.18 1.45 3.42
Current liability
ratio
0.35 0.35 0.33
Inventory to Sales
Ratio
0.03 0.03 0.02
Cash to Current
Assets Ratio
0.03 0.03 0.04
Current Assets
to Total Debt
Ratio
0.37 0.40 0.46
Current Liabilities
to Inventory Ratio
11.01 12.68 15.76
Top compensation
to sales
42207000 40180000 40990000
(Annual Report, 2018)
The above table expresses about the ratios of the company.
Liquidity ratio:
Liquidity ratios are calculated to evaluate the internal position of the corporation. It
measures the capability of business to reimburse its short term debt against the current assets
of the company. Various ratios are calculated under the liquid ratio to generate a conclusion
about the liquid position of the company. The current ratio and acid test ratio has been
evaluated in this case to identify the liquid position of the company.
Current ratio is measured to evaluate the total short term debt level of the company.
Current ratio of AMERICAN AIRLINES GROUP INC explains that the liquid place of the
organization has been lower from last 2 years. The current ratio of the business is 0.61 which
explains that it is required for the company to improve the level as the Southwest airline level
is also better (Morningstar, 2018). Further, acid test ratio of the organization has been
measured and it has been found that the organization is also required to improve the level of
quick assets so that a good position of liquidity could be maintained by the company in the
industry as the level of Southwest airline level is quite better.
Financing ratio:
Financing ratios are calculated to evaluate the internal position of the company. It
measures the capability of the company to pay its long term debt against the fixed assets and
⊘ This is a preview!⊘
Do you want full access?
Subscribe today to unlock all pages.
Trusted by 1+ million students worldwide
Accounting for corporate structure 7
equity of the company. Various ratios are calculated under the financing ratio to generate a
conclusion about the financing and capital structure position. The debt to equity ratio and
times interest earned ratio has been evaluated in this case to identify the financing position of
the company (Brigham and Ehrhardt, 2013).
The ratio of Debt to equity is measured to estimate the total long term debt level of
the business against the whole equity of the concern. It explains about the capital structure
position of AMERICAN AIRLINES GROUP INC. The ratio explains that the long term debt
payment capability of the company is quite higher in the industry. The debt equity ratio of the
company is 6.37 which explain that it is required for the company to reduce the level of
equity to manage the risk and return as the Southwest airline level is also lower (Deegan,
2013). Further, times interest earned ratio of the business has been measured and it has also
been evaluated that interest amount of the business has been lowered from most recent years
and it briefs about the inferior cost of capital of the business.
Activity ratio:
Further, activity ratios are calculated to appraise the efficiency spot of the business. It
measures the capability of the troupe to manage its assets and the working capital for the
daily operations. Various ratios are calculated under the activity ratio to generate a conclusion
about the working capital position of the company. The receivable turnover ratio, payable
turnover ratio and inventory turnover ratio has been evaluated in this case to identify the
activity and efficiency position of the company.
Receivable turnover ratio is measured to evaluate the total time in which the debtors
pay the amount to the company. It explains about the efficiency position of AMERICAN
AIRLINES GROUP INC. The ratio explains that the debtors’ turnover ratio of the company
is 15.15 days. Further, the accounts payable days and inventory turnover days have been
calculated to identify the efficient position of the company (Romney et al, 2006). The
accounts payable turnover days of the company are 34.94 days and inventory turnover days
are 11.75 days which explains that the efficiency position of the company is quite
competitive and it has been better from last year. It has also been found that the level of the
company is also better then the Southwest airline level.
Profitability ratio:
Further, the profitability ratios of the company have also been evaluated to identify
the capability of the company to generate the profit (Grinblatt and Titman, 2016). Gross
profit % and return on shareholder’s equity has been evaluated to identify the profitability
position of American Airlines group. The gross profit margin of the company is 58% which
has been lower from last year. Though, the position of the company is quite better. Further,
ROCE has been evaluated and it has been found that the ROCE of the company is 383.8
which have also been lower from last year. Though, the position of the company is quite
competitive (Morningstar, 2018).
Stock ratios:
Lastly, the stock ratios of the company have been evaluated to identify the capability
of the company to manage the market position. Earnings per share, price earnings ratio and
dividend yield has been evaluated to identity the stock position of American Airlines group
(Kiran and Singh, 2014). The earnings per share of the company are 3.92 which have been
lower from last year. Further, price earnings ratio and dividend yield of the company has
been evaluated and it has been found that the position of the corporation has been improved
and it is quite competitive in the industry.
Paraphrase This Document
Need a fresh take? Get an instant paraphrase of this document with our AI Paraphraser
Accounting for corporate structure 8
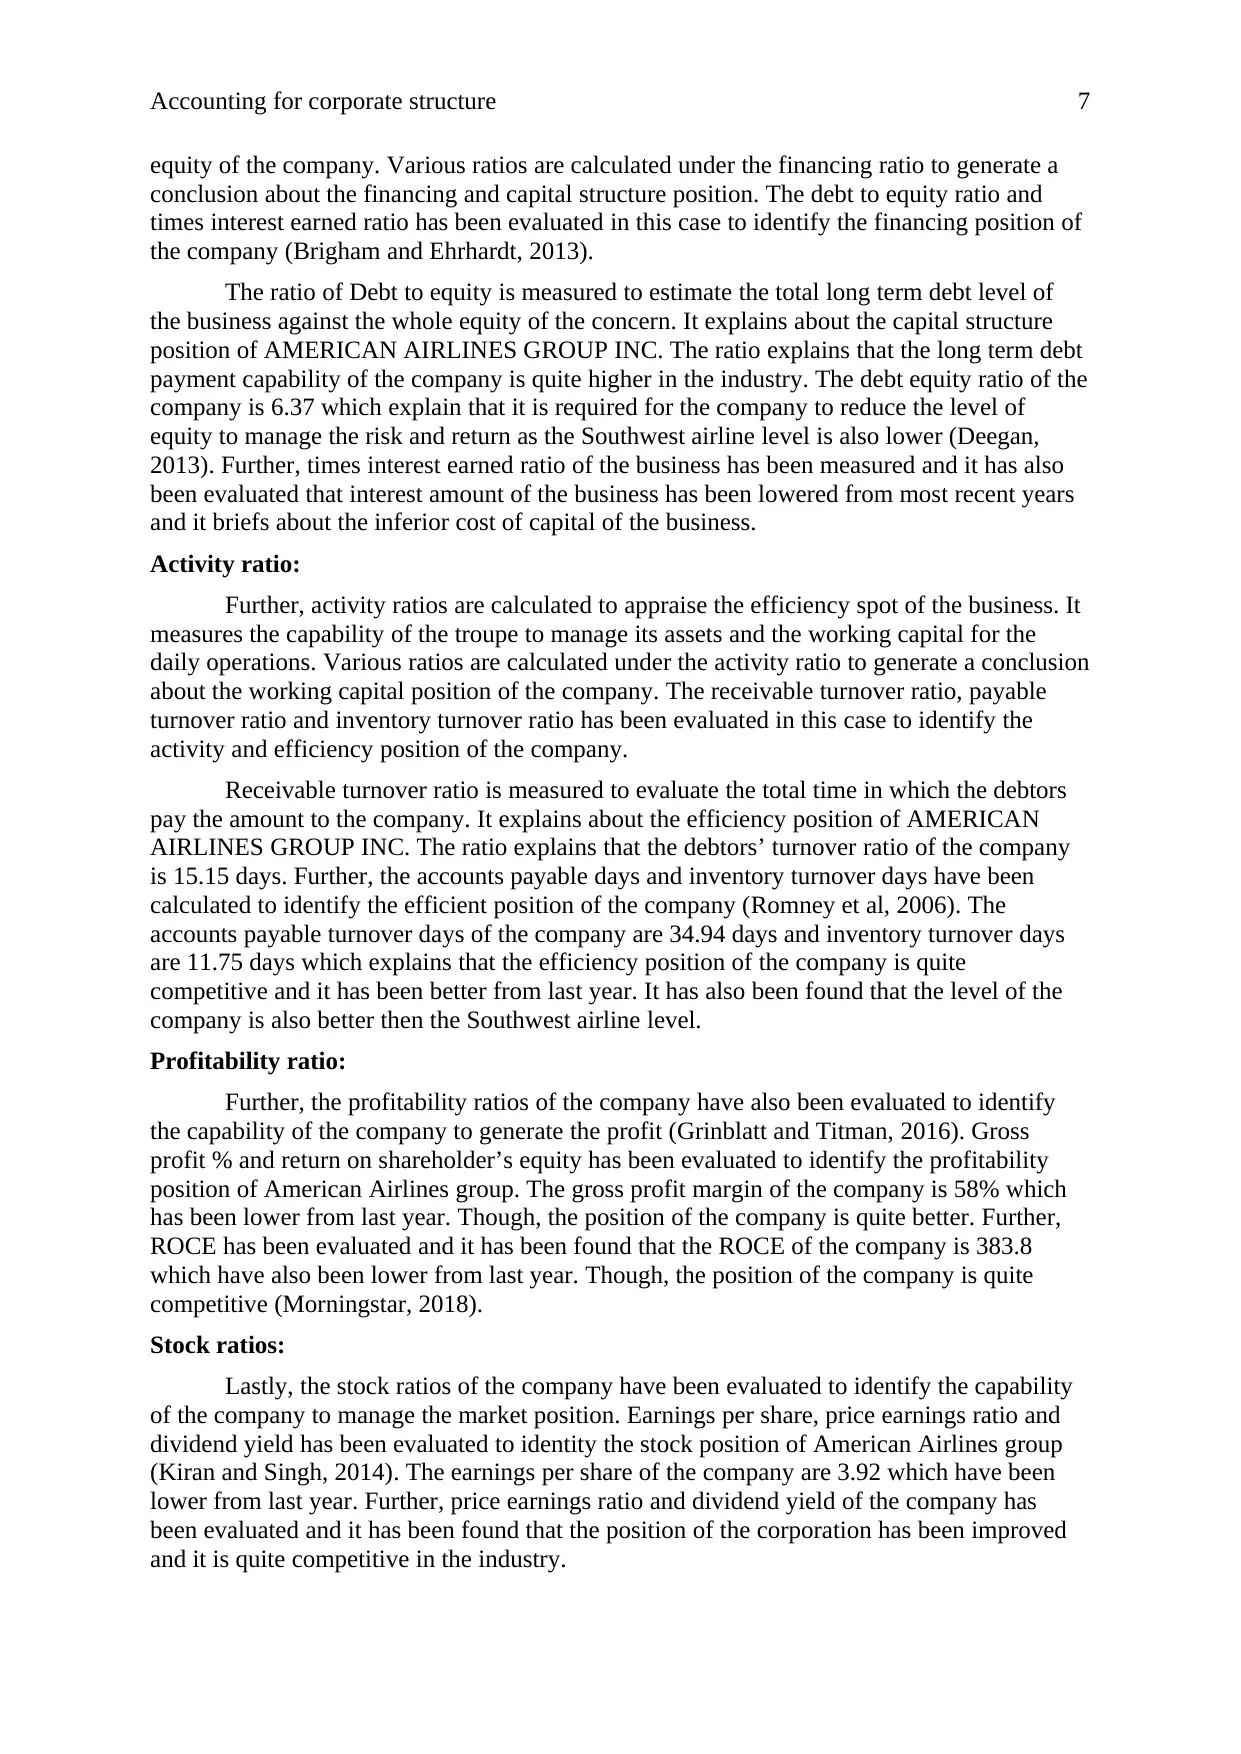
The above ratio analysis calculations of the business brief that the superior spot and
performance of the company.
Horizontal analysis:
Further, the horizontal statement of the organization has been evaluated to identify the
changes in the organization and the financial statement of the organization from last year.
Through the evaluation, it has been analyzed that the cash and company’s total current assets
have been lowered from last year. Further, the total assets and total current liabilities have
been enhanced and the total liabilities of the company have not been changed. Further,
evaluation briefs that diverse alterations have taken position into the financial performance of
the business from most recent years (Kaplan and Atkinson, 2015). The revenue position and
gross margin position of the company expresses about the positive changes in the
organization. Through the evaluation, it has been evaluated that the corporation’s position has
been improved from most recent years. And it would be much better in next few years.
Horizontal changes statement
2017 2016 2015
Cash -8.4% -17.4% -60.8%
Total current assets -11.4% 3.4% -17.6%
total assets 0.2% 5.9% 10.6%
Total current liabilities 7.9% 2.0% 1.3%
Total liabilities 0.0% 11.0% 2.5%
Retained earnings 104.9%
-
233.3% -85.6%
Total stockholder's equity 3.7% -32.8% 178.8%
Number of shares outstanding -11.4% -17.4% -6.8%
Net sales/ Revenue 5.0% -2.0% -3.9%
Cost of goods sold 10.8% -6.8% -22.8%
Gross margin 1.3% 1.4% 16.6%
Operating expenses 8.1% 7.1% 8.9%
Operating margin -23.2% -14.8% 46.0%
Interest expenses
-
100.0% 12.6% -0.8%
Net income -28.3% -64.8% 164.1%
Earnings per share -19.2% -57.4% 183.3%
(Deegan, 2013)
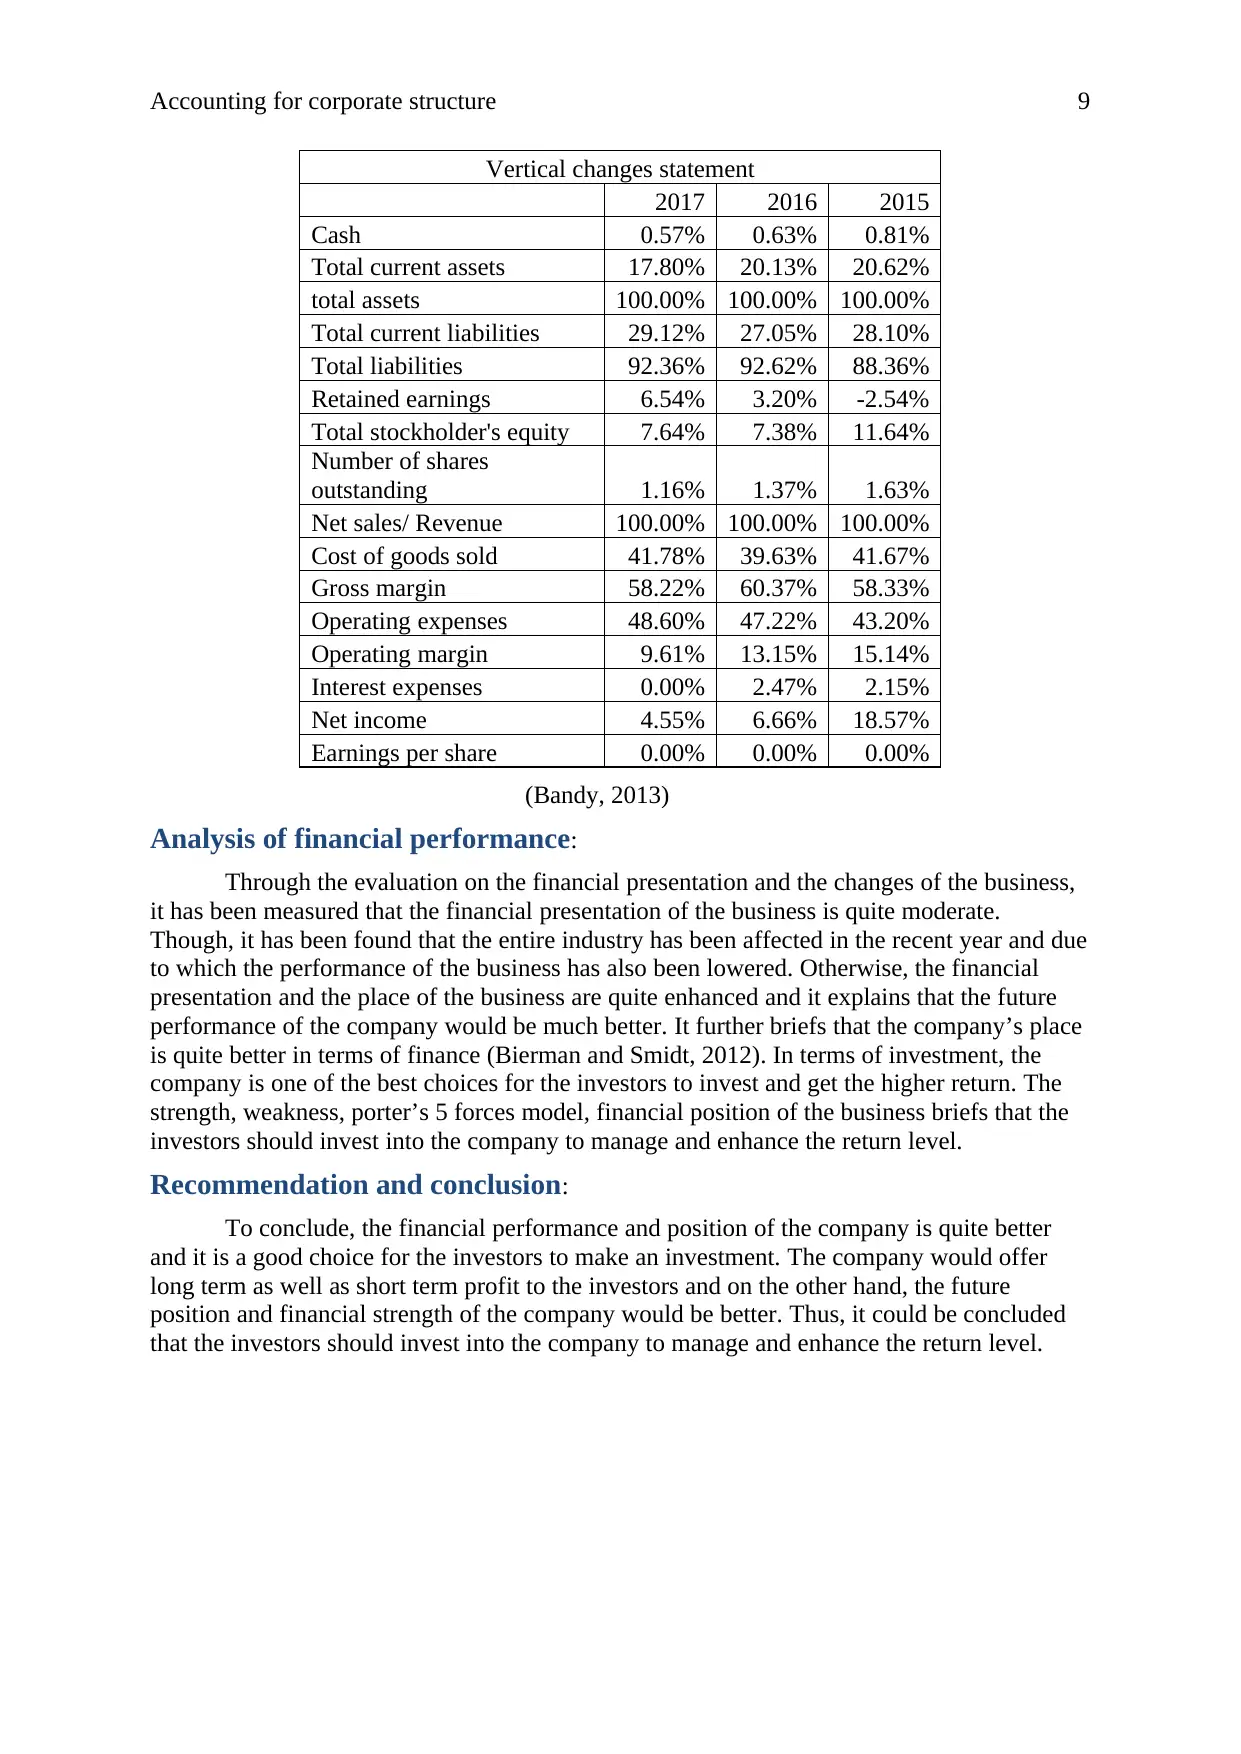
Vertical analysis:
Further, the vertical statement of the organization has been evaluated to recognize the
position of each item of the financial statement of the business. According to the evaluation,
it has been measured that the cash level and level of total current assets of the business
against the total current and noncurrent assets have been lowered from last year. Further, the
total current liabilities level has been enhanced against the total liabilities and equity of the
company (Du and Girma, 2009). The revenue position and gross margin position of the
company expresses about the positive changes in the organization. Through the evaluation, it
has been found that the company’s position has been better from last year. And it would be
much better in next few years.
The above ratio analysis calculations of the business brief that the superior spot and
performance of the company.
Horizontal analysis:
Further, the horizontal statement of the organization has been evaluated to identify the
changes in the organization and the financial statement of the organization from last year.
Through the evaluation, it has been analyzed that the cash and company’s total current assets
have been lowered from last year. Further, the total assets and total current liabilities have
been enhanced and the total liabilities of the company have not been changed. Further,
evaluation briefs that diverse alterations have taken position into the financial performance of
the business from most recent years (Kaplan and Atkinson, 2015). The revenue position and
gross margin position of the company expresses about the positive changes in the
organization. Through the evaluation, it has been evaluated that the corporation’s position has
been improved from most recent years. And it would be much better in next few years.
Horizontal changes statement
2017 2016 2015
Cash -8.4% -17.4% -60.8%
Total current assets -11.4% 3.4% -17.6%
total assets 0.2% 5.9% 10.6%
Total current liabilities 7.9% 2.0% 1.3%
Total liabilities 0.0% 11.0% 2.5%
Retained earnings 104.9%
-
233.3% -85.6%
Total stockholder's equity 3.7% -32.8% 178.8%
Number of shares outstanding -11.4% -17.4% -6.8%
Net sales/ Revenue 5.0% -2.0% -3.9%
Cost of goods sold 10.8% -6.8% -22.8%
Gross margin 1.3% 1.4% 16.6%
Operating expenses 8.1% 7.1% 8.9%
Operating margin -23.2% -14.8% 46.0%
Interest expenses
-
100.0% 12.6% -0.8%
Net income -28.3% -64.8% 164.1%
Earnings per share -19.2% -57.4% 183.3%
(Deegan, 2013)
Vertical analysis:
Further, the vertical statement of the organization has been evaluated to recognize the
position of each item of the financial statement of the business. According to the evaluation,
it has been measured that the cash level and level of total current assets of the business
against the total current and noncurrent assets have been lowered from last year. Further, the
total current liabilities level has been enhanced against the total liabilities and equity of the
company (Du and Girma, 2009). The revenue position and gross margin position of the
company expresses about the positive changes in the organization. Through the evaluation, it
has been found that the company’s position has been better from last year. And it would be
much better in next few years.
Accounting for corporate structure 9
Vertical changes statement
2017 2016 2015
Cash 0.57% 0.63% 0.81%
Total current assets 17.80% 20.13% 20.62%
total assets 100.00% 100.00% 100.00%
Total current liabilities 29.12% 27.05% 28.10%
Total liabilities 92.36% 92.62% 88.36%
Retained earnings 6.54% 3.20% -2.54%
Total stockholder's equity 7.64% 7.38% 11.64%
Number of shares
outstanding 1.16% 1.37% 1.63%
Net sales/ Revenue 100.00% 100.00% 100.00%
Cost of goods sold 41.78% 39.63% 41.67%
Gross margin 58.22% 60.37% 58.33%
Operating expenses 48.60% 47.22% 43.20%
Operating margin 9.61% 13.15% 15.14%
Interest expenses 0.00% 2.47% 2.15%
Net income 4.55% 6.66% 18.57%
Earnings per share 0.00% 0.00% 0.00%
(Bandy, 2013)
Analysis of financial performance:
Through the evaluation on the financial presentation and the changes of the business,
it has been measured that the financial presentation of the business is quite moderate.
Though, it has been found that the entire industry has been affected in the recent year and due
to which the performance of the business has also been lowered. Otherwise, the financial
presentation and the place of the business are quite enhanced and it explains that the future
performance of the company would be much better. It further briefs that the company’s place
is quite better in terms of finance (Bierman and Smidt, 2012). In terms of investment, the
company is one of the best choices for the investors to invest and get the higher return. The
strength, weakness, porter’s 5 forces model, financial position of the business briefs that the
investors should invest into the company to manage and enhance the return level.
Recommendation and conclusion:
To conclude, the financial performance and position of the company is quite better
and it is a good choice for the investors to make an investment. The company would offer
long term as well as short term profit to the investors and on the other hand, the future
position and financial strength of the company would be better. Thus, it could be concluded
that the investors should invest into the company to manage and enhance the return level.
⊘ This is a preview!⊘
Do you want full access?
Subscribe today to unlock all pages.
Trusted by 1+ million students worldwide
Accounting for corporate structure 10
References:
Annual Report. 2017. AMERICAN AIRLINES GROUP. [Online]. Available at:
https://americanairlines.gcs-web.com/static-files/17cae9f4-55b0-4a05-a2dc-33fcc0a01985
[Accessed as on 28th Mar 2018].
Bandy, G. 2013. Financial management and accounting in the public sector. Oxon:
Routledge.
Bierman Jr, H. and Smidt, S., 2012. The capital budgeting decision: economic analysis of
investment projects. Routledge.
Brigham, E.F. and Ehrhardt, M.C., 2013. Financial management: Theory & practice.
Cengage Learning.
Customer services. 2018. AMERICAN AIRLINES GROUP. [Online]. Available at:
https://www.aa.com/i18n/customer-service/about-us/american-airlines-group.jsp [Accessed
as on 28th Mar 2018].
Deegan, C., 2013. Financial accounting theory. McGraw-Hill Education Australia.
Du, J. and Girma, S., 2009. Source of finance, growth and firm size: evidence from
China (No. 2009.03). Research paper/UNU-WIDER.
Fernandes, D., Lynch Jr, J.G. and Netemeyer, R.G., 2014. Financial literacy, financial
education, and downstream financial behaviors. Management Science, 60(8), pp.1861-1883.
Gitman, L.J. and Zutter, C.J., 2012. Principles of managerial finance. Prentice Hall.
Grinblatt, M. and Titman, S., 2016. Financial markets & corporate strategy. Prentice Hall.
History. 2018.. Southwest AIRLINES GROUP. [Online]. Available at:
https://www.southwest.com/ [Accessed as on 28th Mar 2018].
Kaplan, R.S. and Atkinson, A.A., 2015. Advanced management accounting. PHI Learning.
Kiran, R. S., & Singh, V. K. 2014. How to make the financial analysis an easy task – A
comparative analysis between the traditional and the modern approach? International Journal
of Engineering Research and Applications, 4(8), 61-66.
Morningstar. 2018. AMERICAN AIRLINES GROUP. [Online]. Available at:
http://financials.morningstar.com/income-statement/is.html?
t=AAL®ion=usa&culture=en-US [Accessed as on 28th Mar 2018].
Morningstar. 2018.. Southwest AIRLINES GROUP. [Online]. Available at:
http://financials.morningstar.com/income-statement/is.html?t=LUV®ion=USA [Accessed
as on 28th Mar 2018].
Romney, M.B., Steinbart, P.J., Zhang, R. and Xu, G., 2006. Accounting information systems.
Pearson Education.
Shapiro, A.C., 2005. Capital budgeting and investment analysis. Prentice Hall.
Yahoo finance. 2018.. AMERICAN AIRLINES GROUP. [Online]. Available at:
https://finance.yahoo.com/quote/AAL/ [Accessed as on 28th Mar 2018].
Paraphrase This Document
Need a fresh take? Get an instant paraphrase of this document with our AI Paraphraser

Accounting for corporate structure 11
Accounting for corporate structure 12
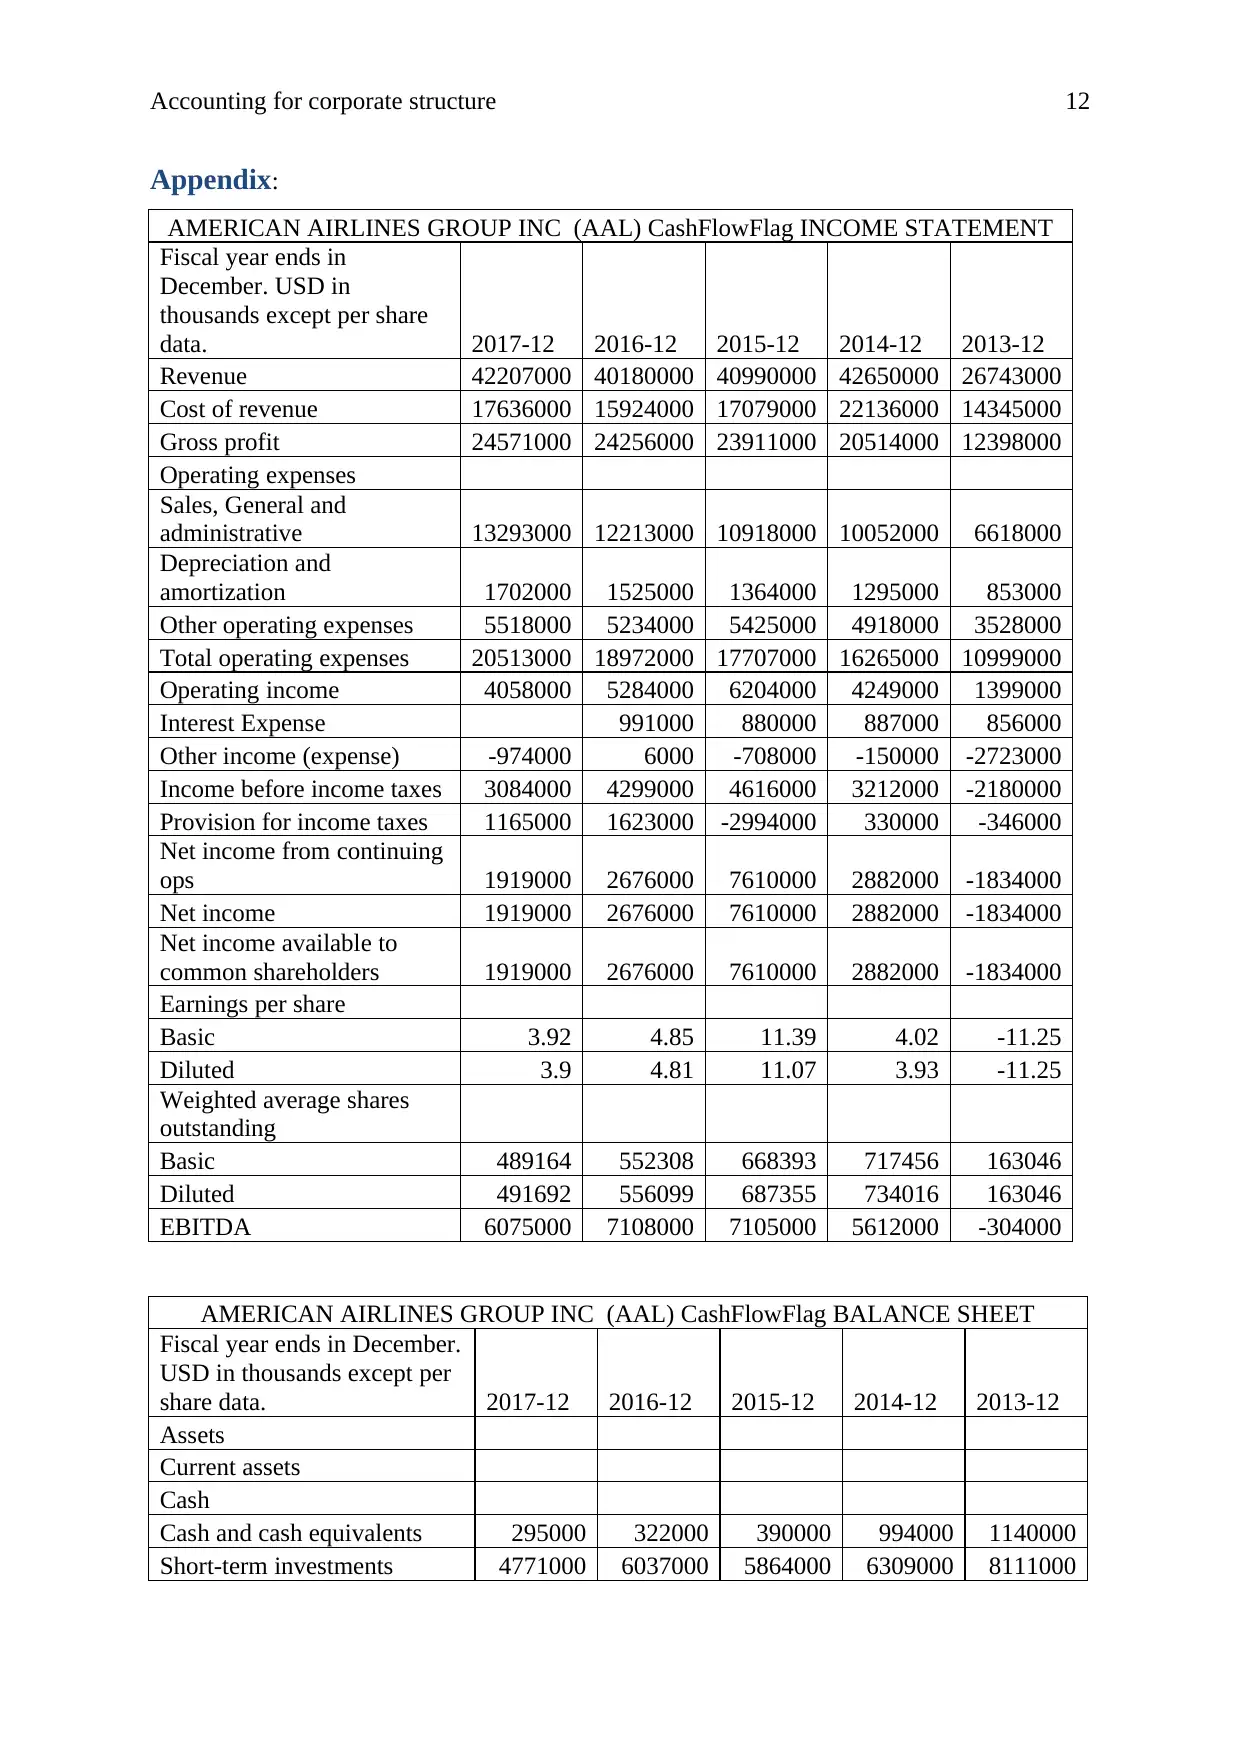
Appendix:
AMERICAN AIRLINES GROUP INC (AAL) CashFlowFlag INCOME STATEMENT
Fiscal year ends in
December. USD in
thousands except per share
data. 2017-12 2016-12 2015-12 2014-12 2013-12
Revenue 42207000 40180000 40990000 42650000 26743000
Cost of revenue 17636000 15924000 17079000 22136000 14345000
Gross profit 24571000 24256000 23911000 20514000 12398000
Operating expenses
Sales, General and
administrative 13293000 12213000 10918000 10052000 6618000
Depreciation and
amortization 1702000 1525000 1364000 1295000 853000
Other operating expenses 5518000 5234000 5425000 4918000 3528000
Total operating expenses 20513000 18972000 17707000 16265000 10999000
Operating income 4058000 5284000 6204000 4249000 1399000
Interest Expense 991000 880000 887000 856000
Other income (expense) -974000 6000 -708000 -150000 -2723000
Income before income taxes 3084000 4299000 4616000 3212000 -2180000
Provision for income taxes 1165000 1623000 -2994000 330000 -346000
Net income from continuing
ops 1919000 2676000 7610000 2882000 -1834000
Net income 1919000 2676000 7610000 2882000 -1834000
Net income available to
common shareholders 1919000 2676000 7610000 2882000 -1834000
Earnings per share
Basic 3.92 4.85 11.39 4.02 -11.25
Diluted 3.9 4.81 11.07 3.93 -11.25
Weighted average shares
outstanding
Basic 489164 552308 668393 717456 163046
Diluted 491692 556099 687355 734016 163046
EBITDA 6075000 7108000 7105000 5612000 -304000
AMERICAN AIRLINES GROUP INC (AAL) CashFlowFlag BALANCE SHEET
Fiscal year ends in December.
USD in thousands except per
share data. 2017-12 2016-12 2015-12 2014-12 2013-12
Assets
Current assets
Cash
Cash and cash equivalents 295000 322000 390000 994000 1140000
Short-term investments 4771000 6037000 5864000 6309000 8111000
⊘ This is a preview!⊘
Do you want full access?
Subscribe today to unlock all pages.
Trusted by 1+ million students worldwide
1 out of 20
Related Documents


Your All-in-One AI-Powered Toolkit for Academic Success.
+13062052269
info@desklib.com
Available 24*7 on WhatsApp / Email
![[object Object]](/_next/static/media/star-bottom.7253800d.svg)
Unlock your academic potential
Copyright © 2020–2026 A2Z Services. All Rights Reserved. Developed and managed by ZUCOL.