Financial Analysis and Share Valuation of AMP Limited Company
VerifiedAdded on 2020/10/04
|11
|2376
|75
Report
AI Summary
This report presents a comprehensive financial analysis of AMP Limited, a financial services company operating in Australia and New Zealand. The analysis begins with a description of AMP Limited's business activities and competitive advantages. The main body of the report focuses on calculating and analyzing various financial ratios, including short-term and long-term solvency ratios, turnover ratios, and profitability ratios, using data from 2016 and 2017. The report then compares share price movements of AMP Limited with the All Ordinaries Index over a two-year period, providing a graphical representation of the fluctuations. Furthermore, the report applies the constant dividend growth model to estimate the share valuation of AMP Limited, highlighting the differences between the calculated intrinsic value and the current market price. The conclusion summarizes the importance of financial statements in decision-making, the role of ratio analysis in evaluating financial performance, and the application of the constant dividend growth model in share valuation. The report references various academic sources and online resources to support its analysis.

FINANCIAL STATEMENTS
Paraphrase This Document
Need a fresh take? Get an instant paraphrase of this document with our AI Paraphraser
Table of Contents
INTRODUCTION...........................................................................................................................1
MAIN BODY...................................................................................................................................1
Description of the companies.................................................................................................1
Calculation and analysis of performance ratios......................................................................2
Graphs and comparison of share price movements................................................................3
Share valuation.......................................................................................................................6
CONCLUSION................................................................................................................................7
REFERENCES................................................................................................................................8
INTRODUCTION
Financial statements are considered as reports that represents the financial position of
organisation to stakeholders, owners, investors and directors that helps in financial planning and
decision making (Babalola and Abiola, 2013). There is a description of AMP limited which is a
financial service providing company in Australia and New Zealand defined in this report.
Financial potion of company illustrated with analysis of different ratios are illustrated in the basis
of financial statement of company. Graphical presentation subject to movement of share prices
for two years are also elaborated. Share valuation of AMP company by implementing the growth
model presented in this report.
MAIN BODY
Description of the companies
AMP limited is a financial services company who provides investment products,
superannuation, insurance, banking products like saving accounts and home loans and financial
advice in Australia and New Zealand. The Australian securities exchange included shares of
AMP limited and it's headquarter in Sydney, Australia. AMP has Four main function and core
activities of business -
Advice and banking – This area provides superannuation services for businesses,
financial planning and advice and product selected of banking.
Insurance and superannuation – It provides product and services such as self managed
super fund, superannuation and personal risk insurance product.
Customer solutions – This area focus on customers and maintain his companies
according to customer needs, sales offer according to market.
AMP capital – This Area is largest investment managers of Asia pacific. It invest in
fixed interest, equities, property, infrastructure, and diversified funds.
Competitive Advantages-
AMP Ltd. Have clear strategy about providence of long term growth and operate their
functions in the market which are growing. Large number of business activities are conducted
within the organisation which allows them to serve the different needs of customers. Along with
that this organisation has large number of suppliers which allows them to effectively provide
1
⊘ This is a preview!⊘
Do you want full access?
Subscribe today to unlock all pages.
Trusted by 1+ million students worldwide
their services in market. It helps the organisation in the scenario of attaining competitive
advantage.
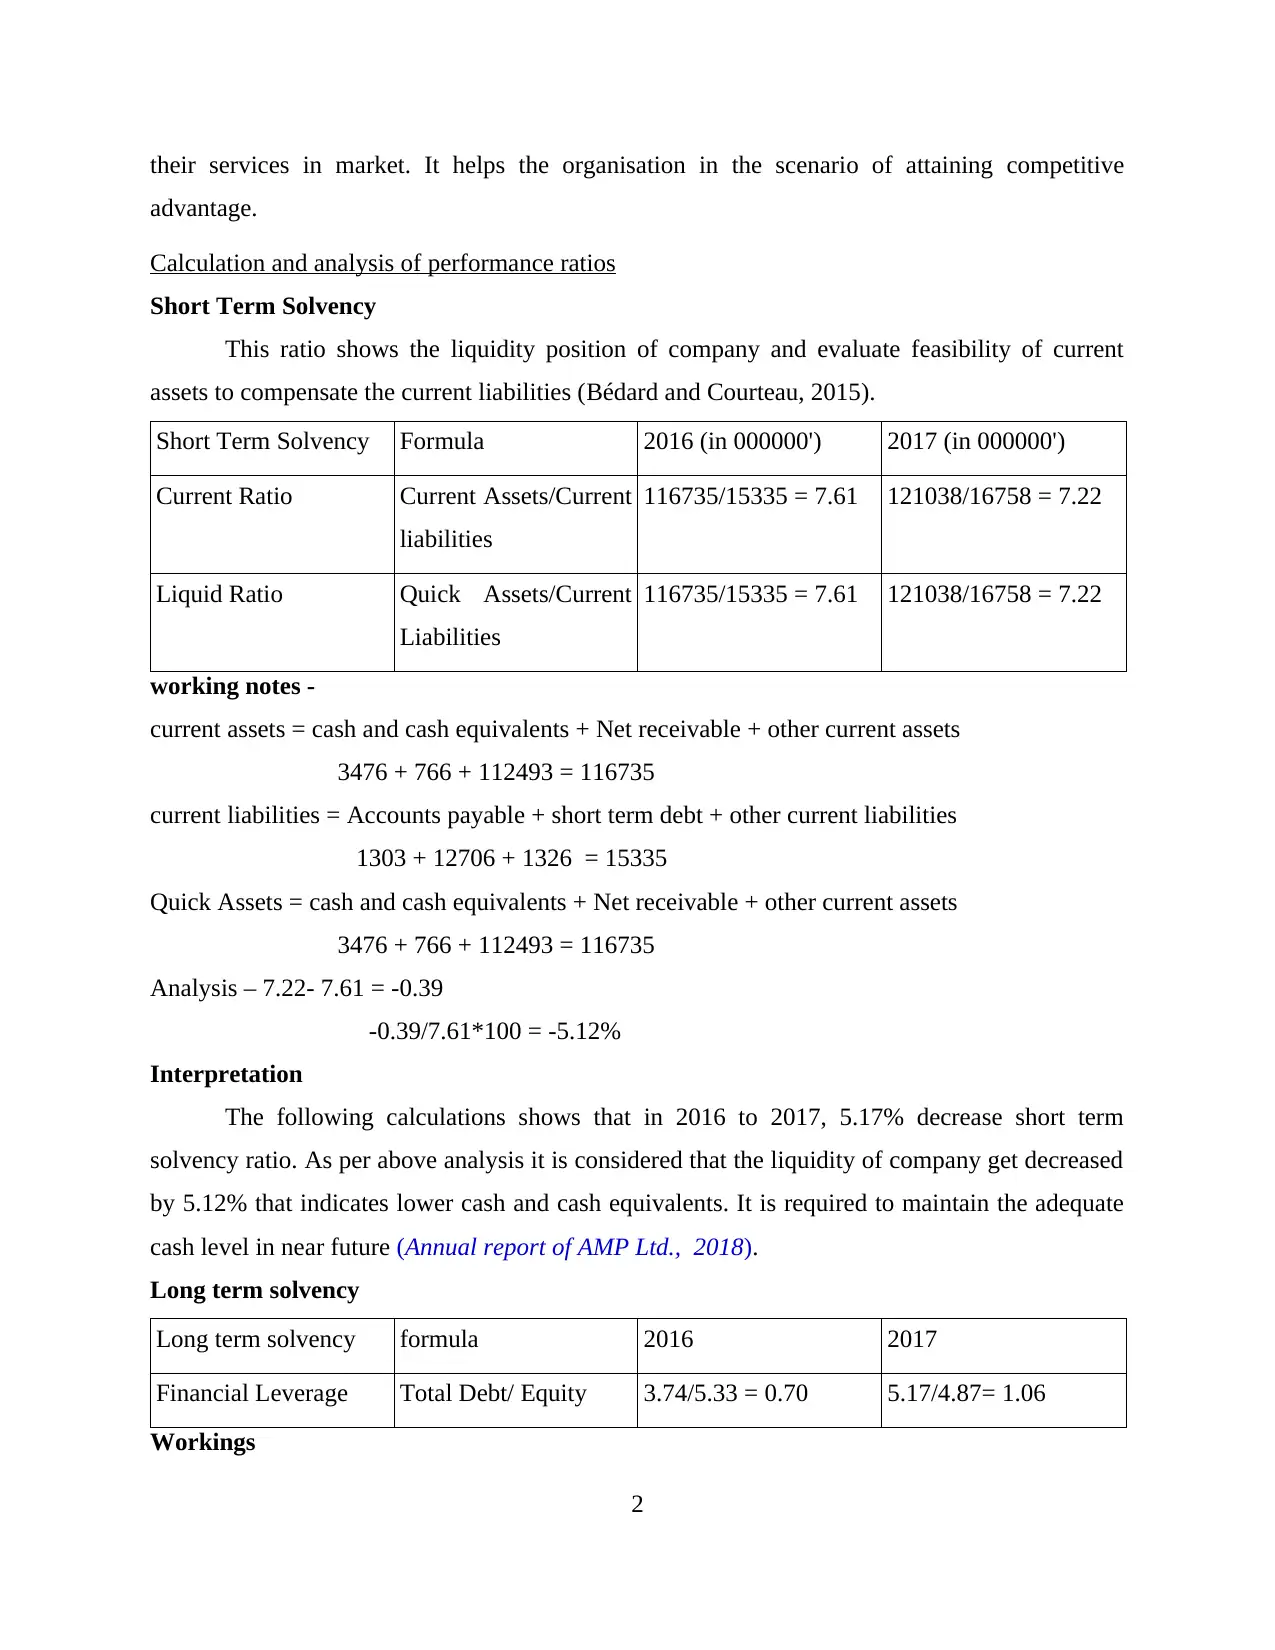
Calculation and analysis of performance ratios
Short Term Solvency
This ratio shows the liquidity position of company and evaluate feasibility of current
assets to compensate the current liabilities (Bédard and Courteau, 2015).
Short Term Solvency Formula 2016 (in 000000') 2017 (in 000000')
Current Ratio Current Assets/Current
liabilities
116735/15335 = 7.61 121038/16758 = 7.22
Liquid Ratio Quick Assets/Current
Liabilities
116735/15335 = 7.61 121038/16758 = 7.22
working notes -
current assets = cash and cash equivalents + Net receivable + other current assets
3476 + 766 + 112493 = 116735
current liabilities = Accounts payable + short term debt + other current liabilities
1303 + 12706 + 1326 = 15335
Quick Assets = cash and cash equivalents + Net receivable + other current assets
3476 + 766 + 112493 = 116735
Analysis – 7.22- 7.61 = -0.39
-0.39/7.61*100 = -5.12%
Interpretation
The following calculations shows that in 2016 to 2017, 5.17% decrease short term
solvency ratio. As per above analysis it is considered that the liquidity of company get decreased
by 5.12% that indicates lower cash and cash equivalents. It is required to maintain the adequate
cash level in near future (Annual report of AMP Ltd., 2018).
Long term solvency
Long term solvency formula 2016 2017
Financial Leverage Total Debt/ Equity 3.74/5.33 = 0.70 5.17/4.87= 1.06
Workings
2
advantage.
Calculation and analysis of performance ratios
Short Term Solvency
This ratio shows the liquidity position of company and evaluate feasibility of current
assets to compensate the current liabilities (Bédard and Courteau, 2015).
Short Term Solvency Formula 2016 (in 000000') 2017 (in 000000')
Current Ratio Current Assets/Current
liabilities
116735/15335 = 7.61 121038/16758 = 7.22
Liquid Ratio Quick Assets/Current
Liabilities
116735/15335 = 7.61 121038/16758 = 7.22
working notes -
current assets = cash and cash equivalents + Net receivable + other current assets
3476 + 766 + 112493 = 116735
current liabilities = Accounts payable + short term debt + other current liabilities
1303 + 12706 + 1326 = 15335
Quick Assets = cash and cash equivalents + Net receivable + other current assets
3476 + 766 + 112493 = 116735
Analysis – 7.22- 7.61 = -0.39
-0.39/7.61*100 = -5.12%
Interpretation
The following calculations shows that in 2016 to 2017, 5.17% decrease short term
solvency ratio. As per above analysis it is considered that the liquidity of company get decreased
by 5.12% that indicates lower cash and cash equivalents. It is required to maintain the adequate
cash level in near future (Annual report of AMP Ltd., 2018).
Long term solvency
Long term solvency formula 2016 2017
Financial Leverage Total Debt/ Equity 3.74/5.33 = 0.70 5.17/4.87= 1.06
Workings
2
Paraphrase This Document
Need a fresh take? Get an instant paraphrase of this document with our AI Paraphraser
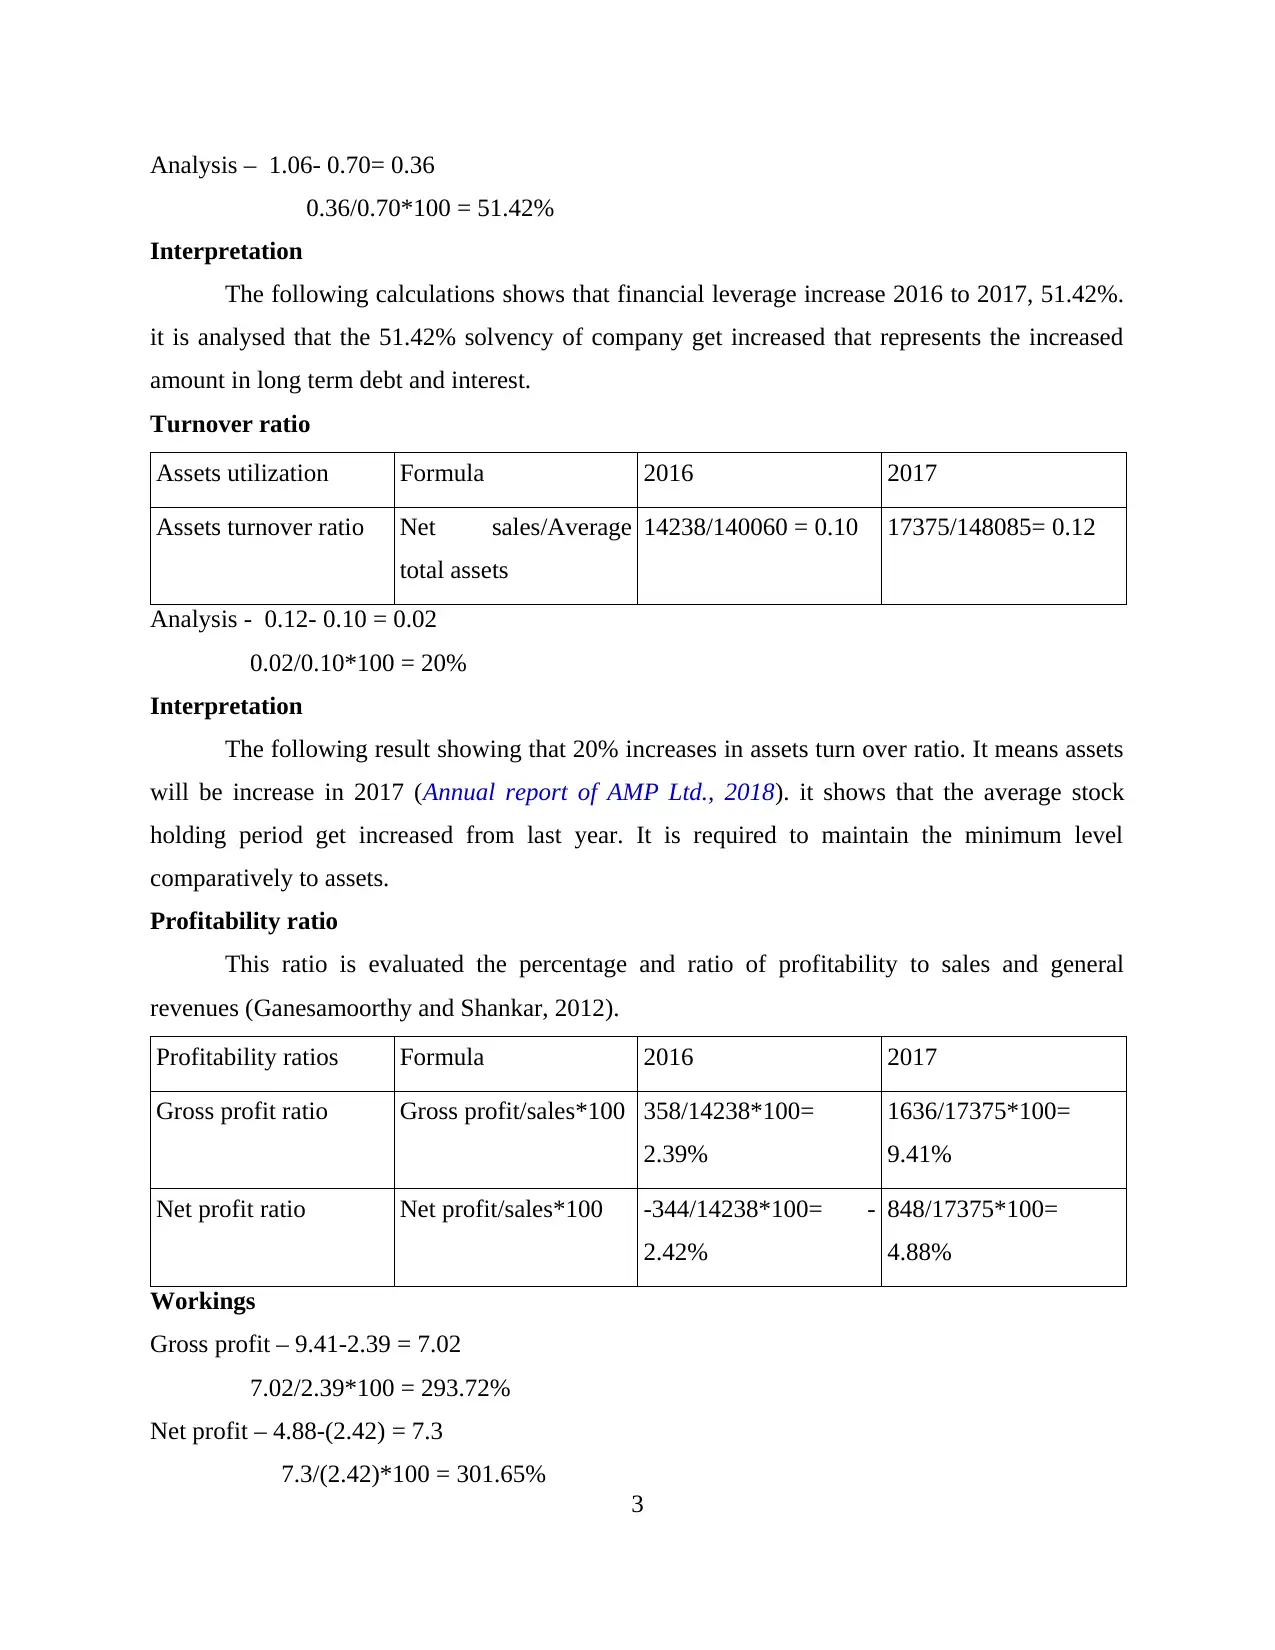
Analysis – 1.06- 0.70= 0.36
0.36/0.70*100 = 51.42%
Interpretation
The following calculations shows that financial leverage increase 2016 to 2017, 51.42%.
it is analysed that the 51.42% solvency of company get increased that represents the increased
amount in long term debt and interest.
Turnover ratio
Assets utilization Formula 2016 2017
Assets turnover ratio Net sales/Average
total assets
14238/140060 = 0.10 17375/148085= 0.12
Analysis - 0.12- 0.10 = 0.02
0.02/0.10*100 = 20%
Interpretation
The following result showing that 20% increases in assets turn over ratio. It means assets
will be increase in 2017 (Annual report of AMP Ltd., 2018). it shows that the average stock
holding period get increased from last year. It is required to maintain the minimum level
comparatively to assets.
Profitability ratio
This ratio is evaluated the percentage and ratio of profitability to sales and general
revenues (Ganesamoorthy and Shankar, 2012).
Profitability ratios Formula 2016 2017
Gross profit ratio Gross profit/sales*100 358/14238*100=
2.39%
1636/17375*100=
9.41%
Net profit ratio Net profit/sales*100 -344/14238*100= -
2.42%
848/17375*100=
4.88%
Workings
Gross profit – 9.41-2.39 = 7.02
7.02/2.39*100 = 293.72%
Net profit – 4.88-(2.42) = 7.3
7.3/(2.42)*100 = 301.65%
3
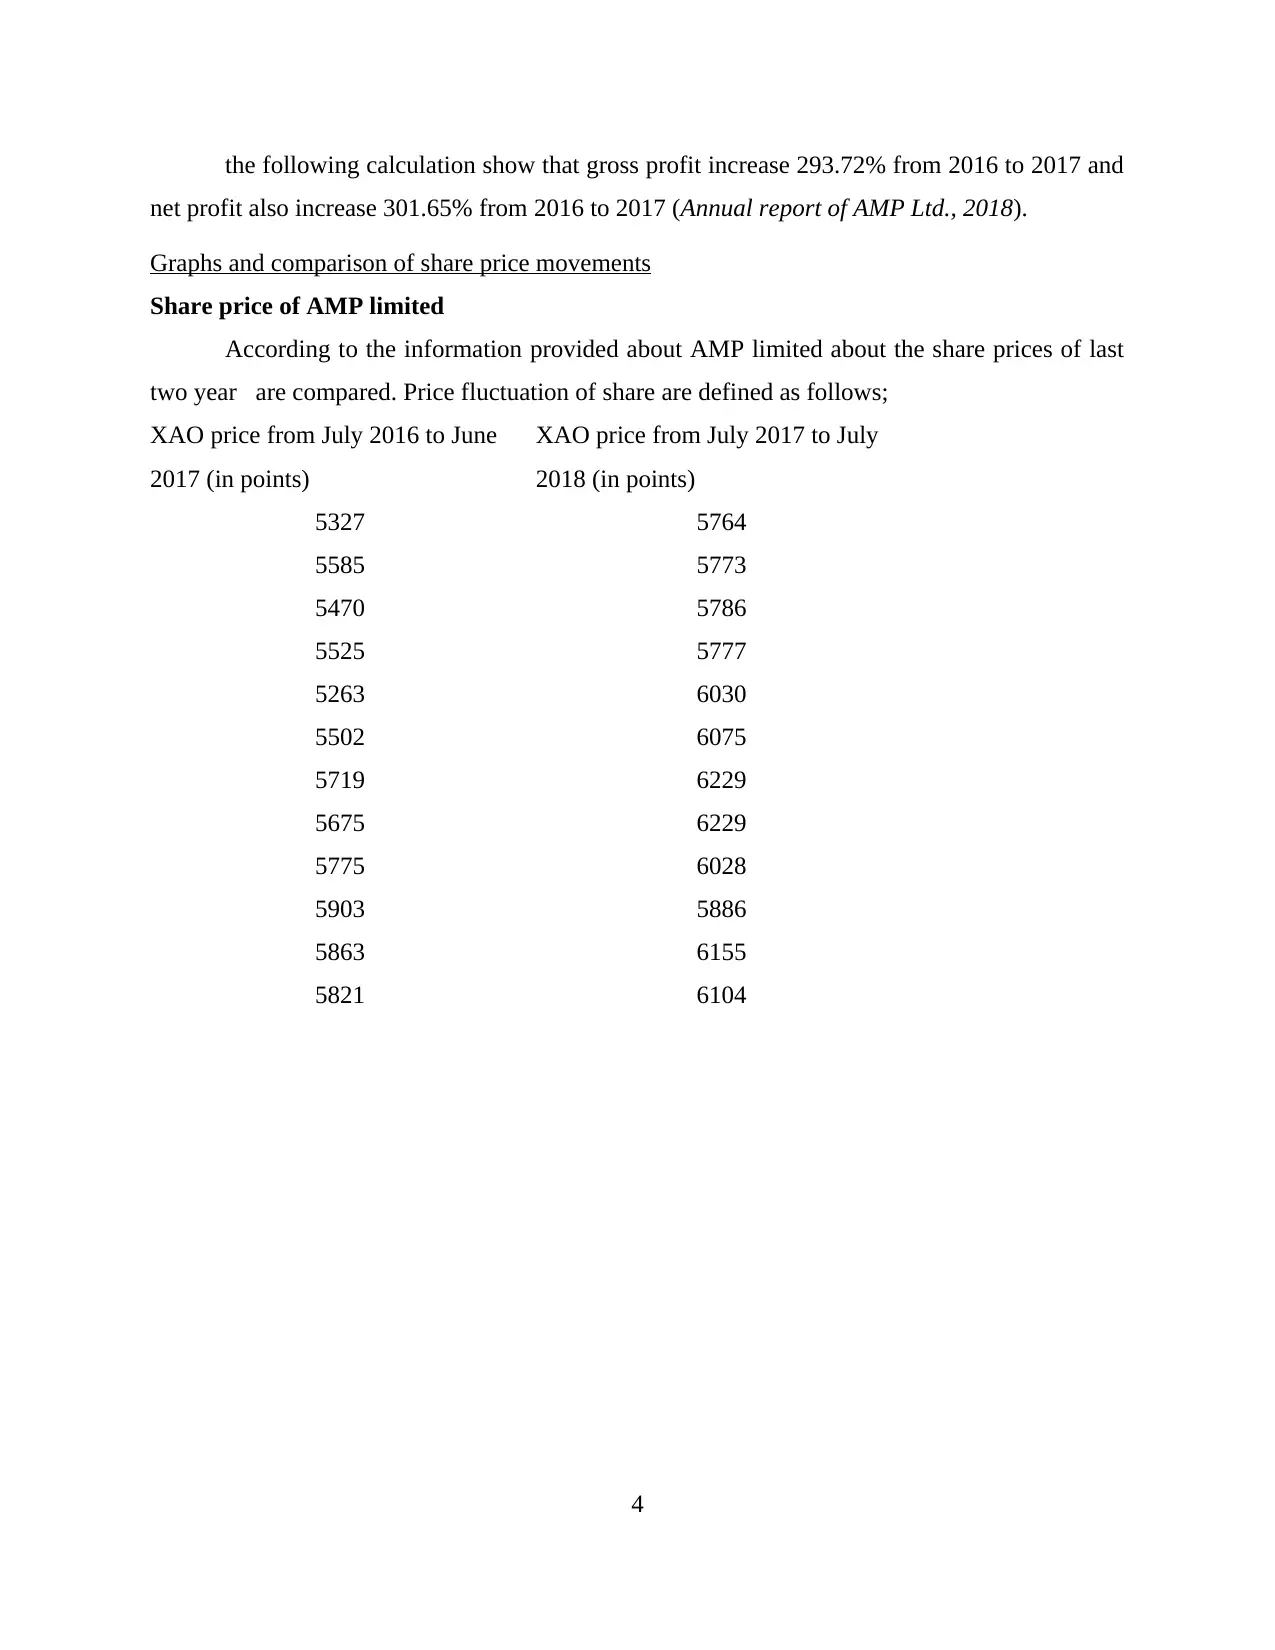
the following calculation show that gross profit increase 293.72% from 2016 to 2017 and
net profit also increase 301.65% from 2016 to 2017 (Annual report of AMP Ltd., 2018).
Graphs and comparison of share price movements
Share price of AMP limited
According to the information provided about AMP limited about the share prices of last
two year are compared. Price fluctuation of share are defined as follows;
XAO price from July 2016 to June
2017 (in points)
XAO price from July 2017 to July
2018 (in points)
5327 5764
5585 5773
5470 5786
5525 5777
5263 6030
5502 6075
5719 6229
5675 6229
5775 6028
5903 5886
5863 6155
5821 6104
4
⊘ This is a preview!⊘
Do you want full access?
Subscribe today to unlock all pages.
Trusted by 1+ million students worldwide
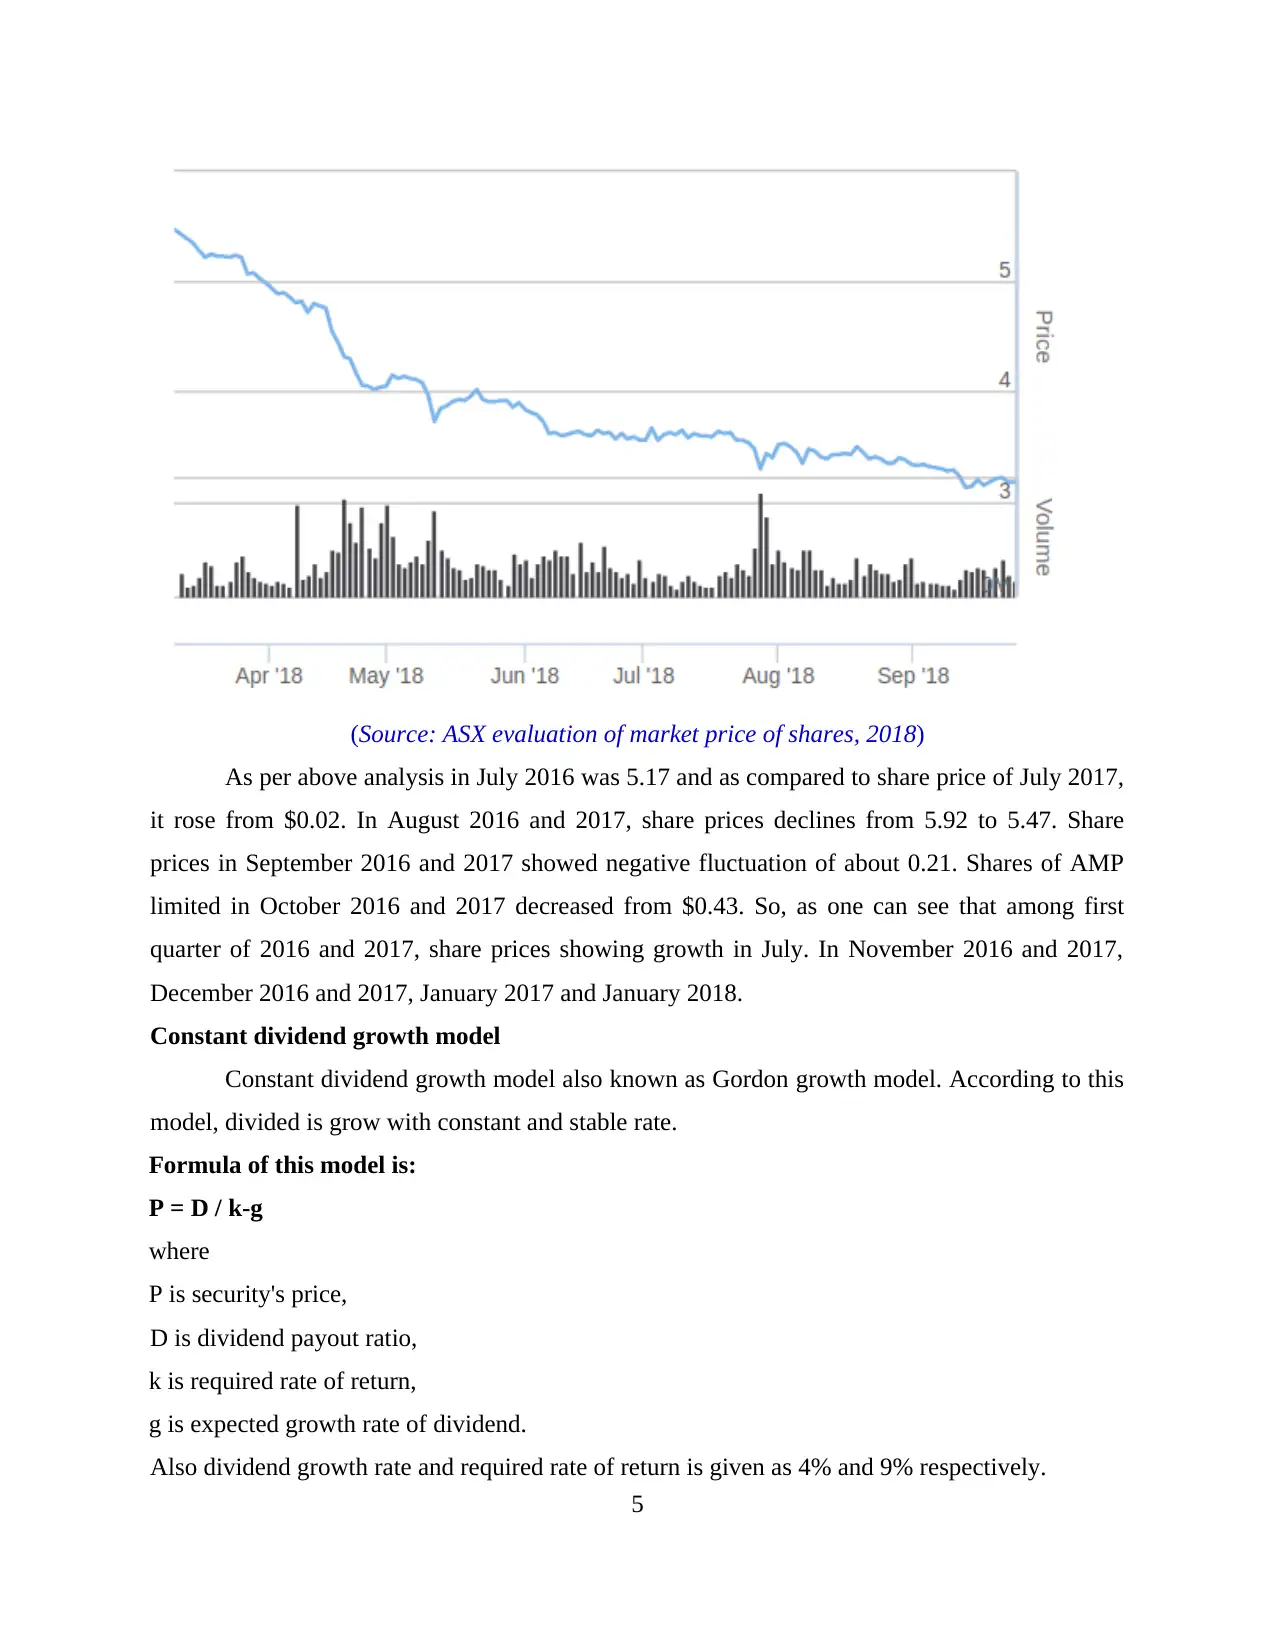
(Source: ASX evaluation of market price of shares, 2018)
As per above analysis in July 2016 was 5.17 and as compared to share price of July 2017,
it rose from $0.02. In August 2016 and 2017, share prices declines from 5.92 to 5.47. Share
prices in September 2016 and 2017 showed negative fluctuation of about 0.21. Shares of AMP
limited in October 2016 and 2017 decreased from $0.43. So, as one can see that among first
quarter of 2016 and 2017, share prices showing growth in July. In November 2016 and 2017,
December 2016 and 2017, January 2017 and January 2018.
Constant dividend growth model
Constant dividend growth model also known as Gordon growth model. According to this
model, divided is grow with constant and stable rate.
Formula of this model is:
P = D / k-g
where
P is security's price,
D is dividend payout ratio,
k is required rate of return,
g is expected growth rate of dividend.
Also dividend growth rate and required rate of return is given as 4% and 9% respectively.
5
Paraphrase This Document
Need a fresh take? Get an instant paraphrase of this document with our AI Paraphraser
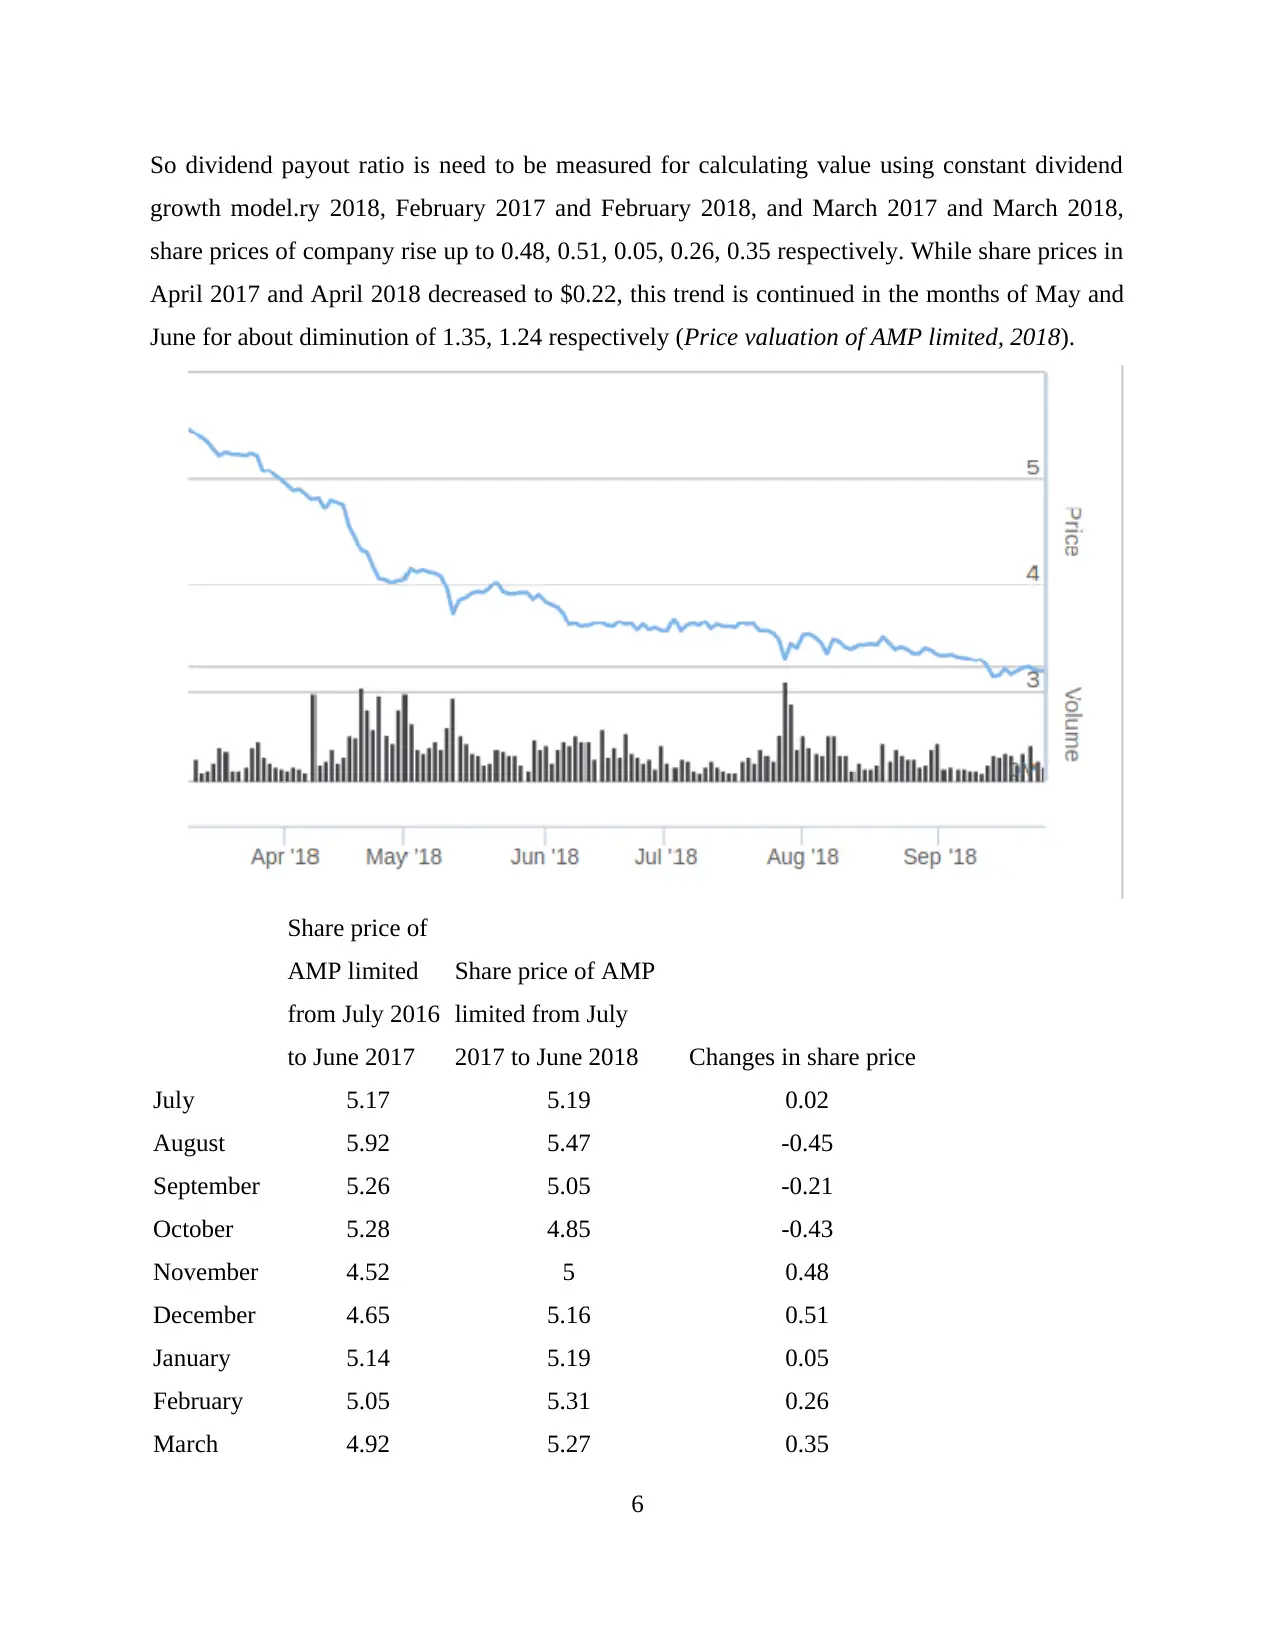
So dividend payout ratio is need to be measured for calculating value using constant dividend
growth model.ry 2018, February 2017 and February 2018, and March 2017 and March 2018,
share prices of company rise up to 0.48, 0.51, 0.05, 0.26, 0.35 respectively. While share prices in
April 2017 and April 2018 decreased to $0.22, this trend is continued in the months of May and
June for about diminution of 1.35, 1.24 respectively (Price valuation of AMP limited, 2018).
Share price of
AMP limited
from July 2016
to June 2017
Share price of AMP
limited from July
2017 to June 2018 Changes in share price
July 5.17 5.19 0.02
August 5.92 5.47 -0.45
September 5.26 5.05 -0.21
October 5.28 4.85 -0.43
November 4.52 5 0.48
December 4.65 5.16 0.51
January 5.14 5.19 0.05
February 5.05 5.31 0.26
March 4.92 5.27 0.35
6
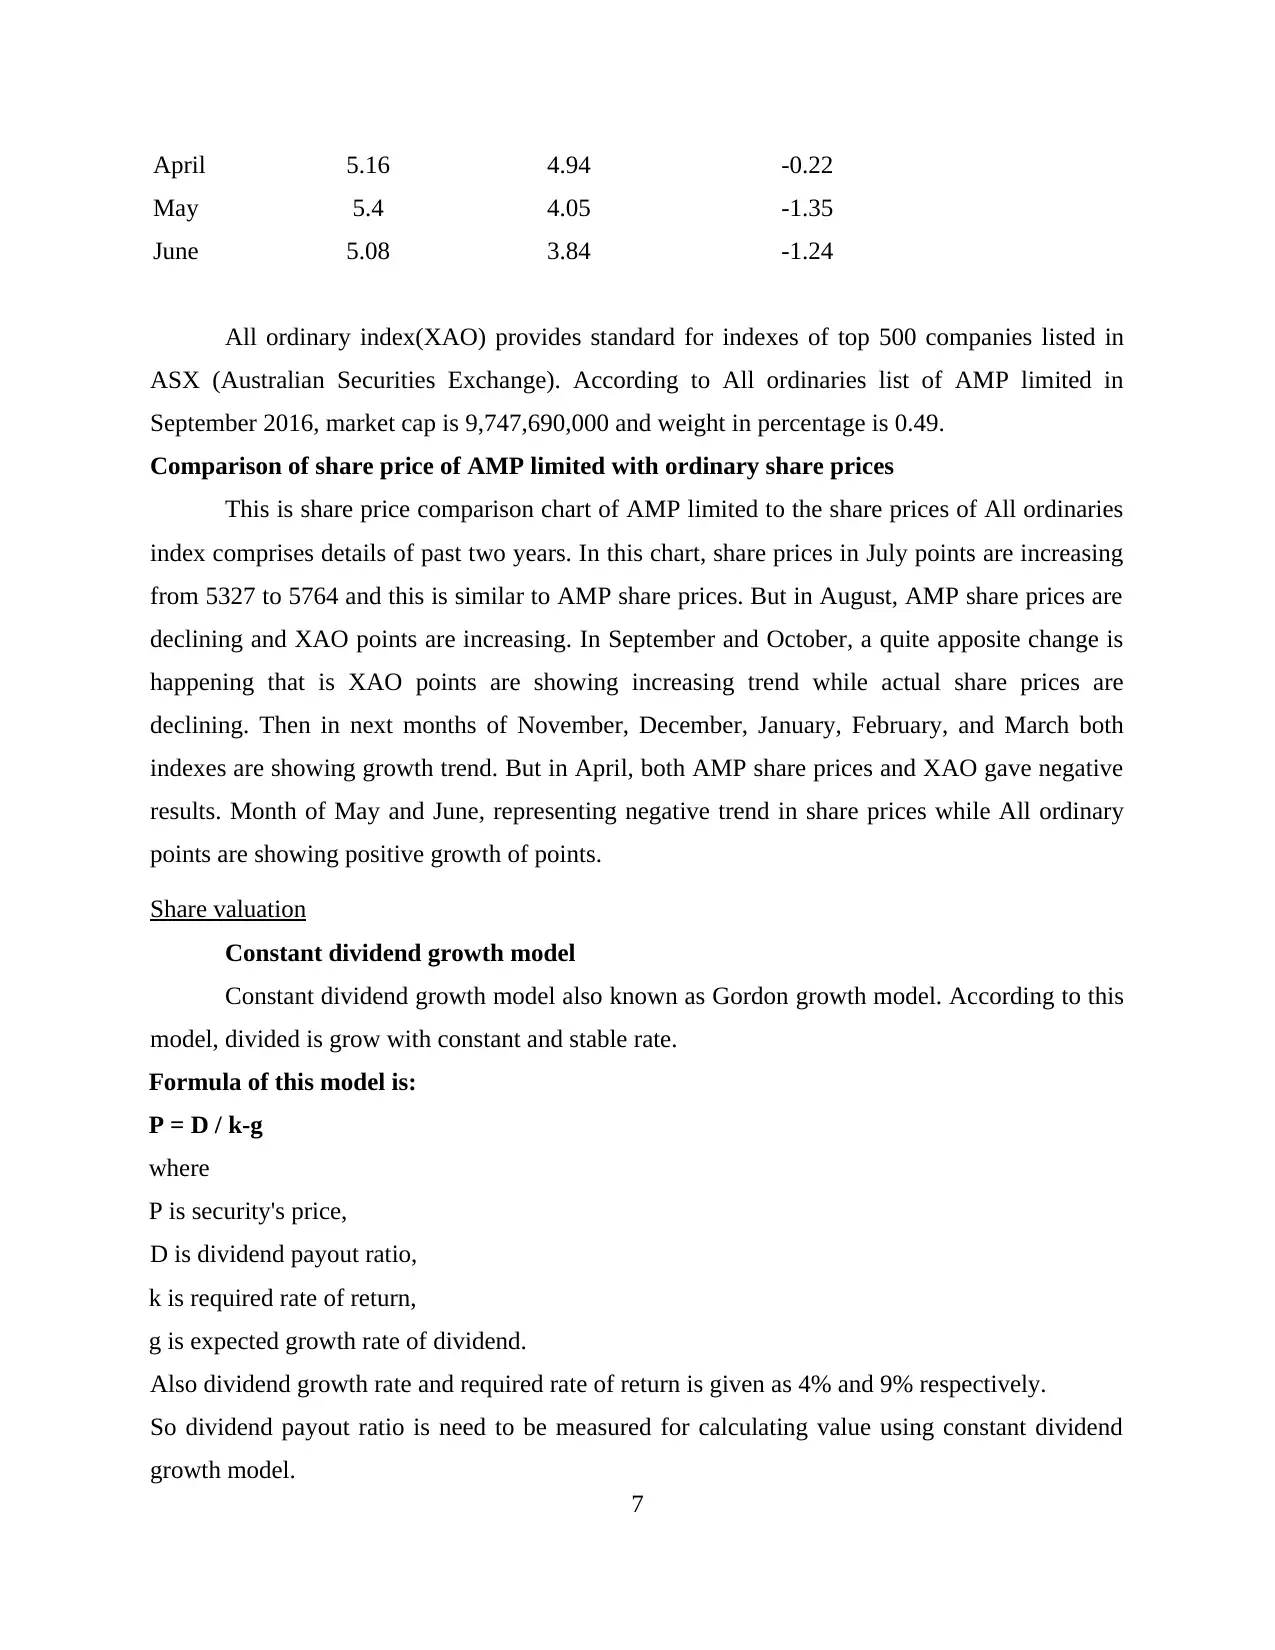
April 5.16 4.94 -0.22
May 5.4 4.05 -1.35
June 5.08 3.84 -1.24
All ordinary index(XAO) provides standard for indexes of top 500 companies listed in
ASX (Australian Securities Exchange). According to All ordinaries list of AMP limited in
September 2016, market cap is 9,747,690,000 and weight in percentage is 0.49.
Comparison of share price of AMP limited with ordinary share prices
This is share price comparison chart of AMP limited to the share prices of All ordinaries
index comprises details of past two years. In this chart, share prices in July points are increasing
from 5327 to 5764 and this is similar to AMP share prices. But in August, AMP share prices are
declining and XAO points are increasing. In September and October, a quite apposite change is
happening that is XAO points are showing increasing trend while actual share prices are
declining. Then in next months of November, December, January, February, and March both
indexes are showing growth trend. But in April, both AMP share prices and XAO gave negative
results. Month of May and June, representing negative trend in share prices while All ordinary
points are showing positive growth of points.
Share valuation
Constant dividend growth model
Constant dividend growth model also known as Gordon growth model. According to this
model, divided is grow with constant and stable rate.
Formula of this model is:
P = D / k-g
where
P is security's price,
D is dividend payout ratio,
k is required rate of return,
g is expected growth rate of dividend.
Also dividend growth rate and required rate of return is given as 4% and 9% respectively.
So dividend payout ratio is need to be measured for calculating value using constant dividend
growth model.
7
⊘ This is a preview!⊘
Do you want full access?
Subscribe today to unlock all pages.
Trusted by 1+ million students worldwide
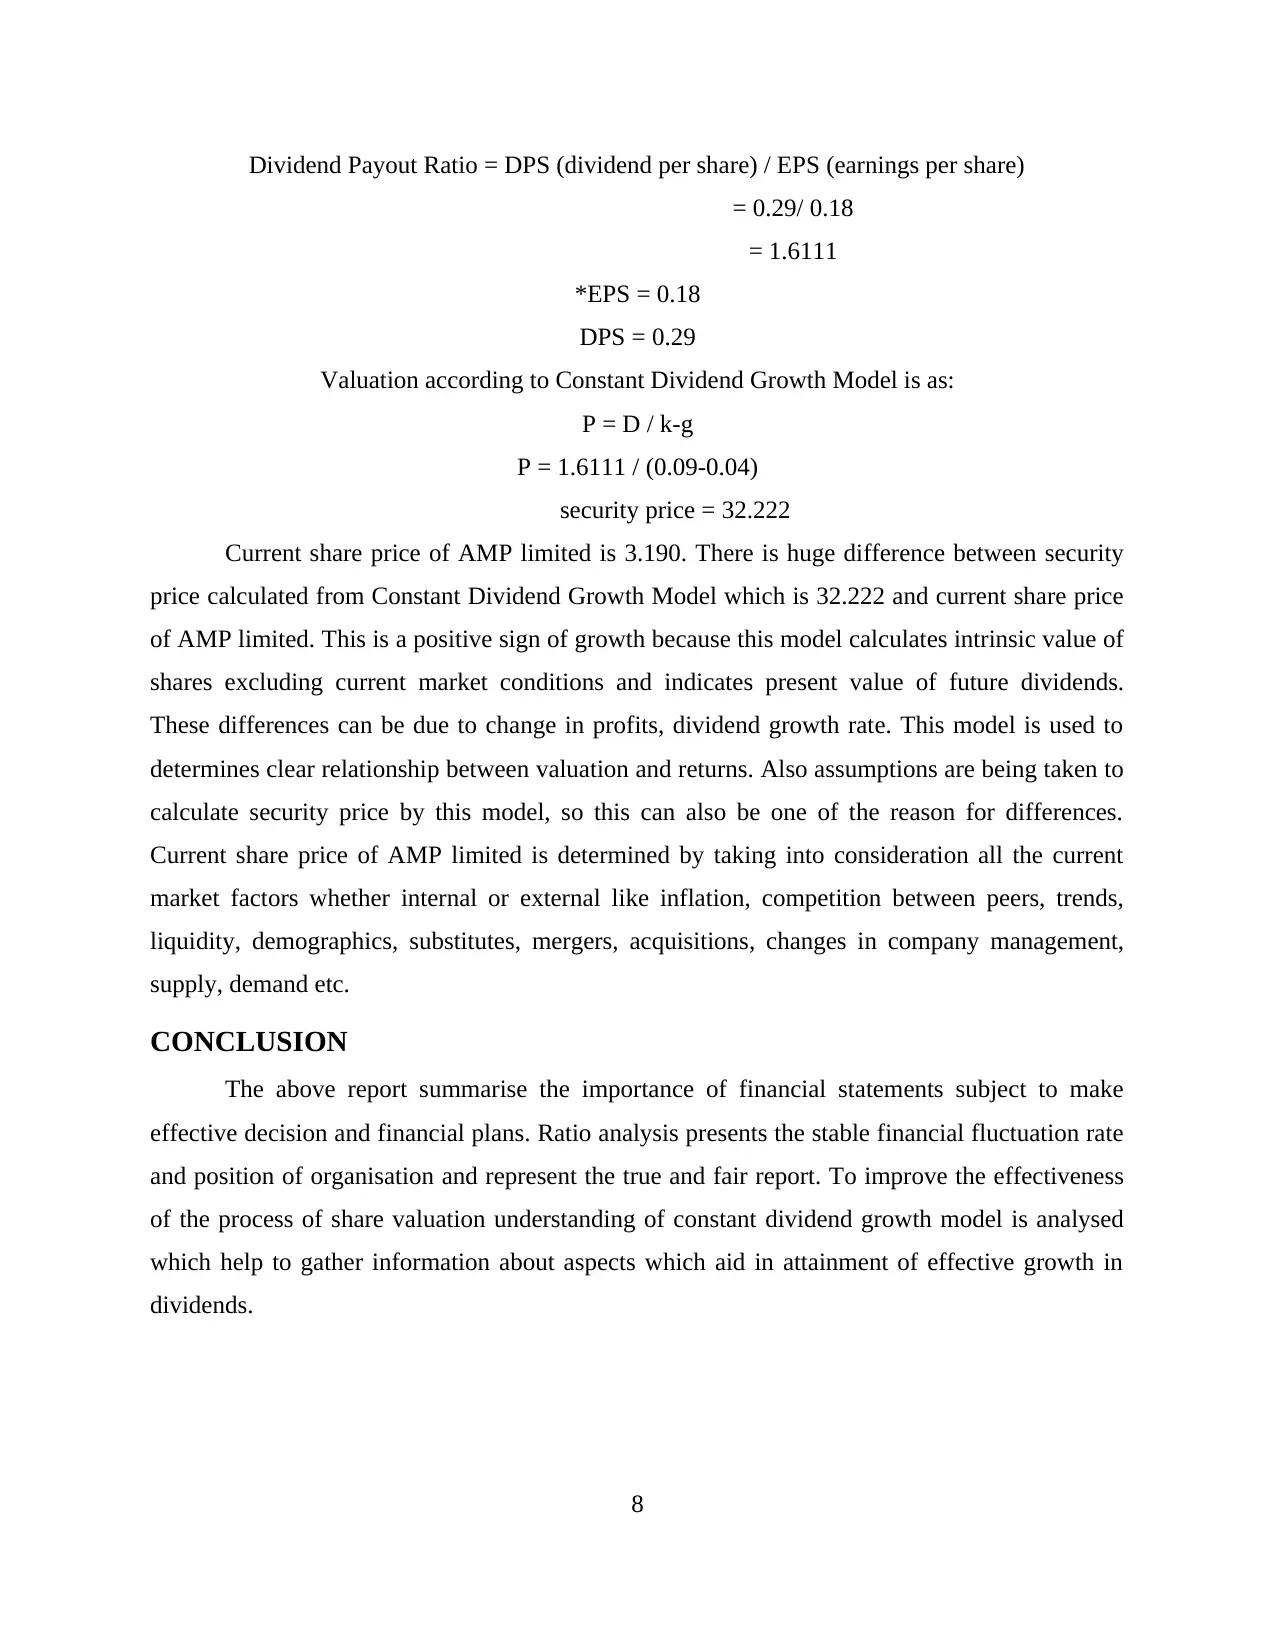
Dividend Payout Ratio = DPS (dividend per share) / EPS (earnings per share)
= 0.29/ 0.18
= 1.6111
*EPS = 0.18
DPS = 0.29
Valuation according to Constant Dividend Growth Model is as:
P = D / k-g
P = 1.6111 / (0.09-0.04)
security price = 32.222
Current share price of AMP limited is 3.190. There is huge difference between security
price calculated from Constant Dividend Growth Model which is 32.222 and current share price
of AMP limited. This is a positive sign of growth because this model calculates intrinsic value of
shares excluding current market conditions and indicates present value of future dividends.
These differences can be due to change in profits, dividend growth rate. This model is used to
determines clear relationship between valuation and returns. Also assumptions are being taken to
calculate security price by this model, so this can also be one of the reason for differences.
Current share price of AMP limited is determined by taking into consideration all the current
market factors whether internal or external like inflation, competition between peers, trends,
liquidity, demographics, substitutes, mergers, acquisitions, changes in company management,
supply, demand etc.
CONCLUSION
The above report summarise the importance of financial statements subject to make
effective decision and financial plans. Ratio analysis presents the stable financial fluctuation rate
and position of organisation and represent the true and fair report. To improve the effectiveness
of the process of share valuation understanding of constant dividend growth model is analysed
which help to gather information about aspects which aid in attainment of effective growth in
dividends.
8
Paraphrase This Document
Need a fresh take? Get an instant paraphrase of this document with our AI Paraphraser
REFERENCES
Books and Journals:
Babalola, Y. A. and Abiola, F. R., 2013. Financial ratio analysis of firms: A tool for decision
making. International journal of management sciences.1(4). pp.132-137.
Bédard, J. and Courteau, L., 2015. Benefits and costs of auditor's assurance: Evidence from the
review of quarterly financial statements. Contemporary Accounting Research. 32(1).
pp.308-335.
Ganesamoorthy, L. and Shankar, H., 2012. Market Timing-Implications Of Market Valuation On
Share Issues By Indian Companies. Indian Journal of Applied Research. 1(4). pp.36-38.
Grossi, G. and Soverchia, M., 2011. European Commission adoption of IPSAS to reform
financial reporting. Babacus. 47(4). pp.525-552.x
Hail, L., 2011. Discussion of consequences and institutional determinants of unregulated
corporate financial statements: Evidence from embedded value reporting. Journal of
Accounting Research. 49(2). pp.573-594.
Huizinga, H. and Laeven, L., 2012. Bank valuation and accounting discretion during a financial
crisis. Journal of Financial Economics.106(3). pp.614-634.
Uechi, L. and et. al., 2015. Sector dominance ratio analysis of financial markets. Physica A:
Statistical Mechanics and its Applications.421, pp.488-509.
Online
Price valuation of AMP limited, 2018. [online]. Available through:
<https://www.reuters.com/finance/stocks/financial-highlights/AMP.AX>.
Annual report of AMP Ltd., 2018. [online]. Available
through:<http://www.annualreports.com/HostedData/AnnualReports/PDF/
OTC_AMLTY_2017.pdf>.
ASX evaluation of market price of shares, 2018. [online]. Available through:<[online]. Available
through:<http://www.annualreports.com/HostedData/AnnualReports/PDF/
OTC_AMLTY_2017.pdf>. >.
9
1 out of 11
Related Documents


Your All-in-One AI-Powered Toolkit for Academic Success.
+13062052269
info@desklib.com
Available 24*7 on WhatsApp / Email
![[object Object]](/_next/static/media/star-bottom.7253800d.svg)
Unlock your academic potential
Copyright © 2020–2026 A2Z Services. All Rights Reserved. Developed and managed by ZUCOL.