University Finance Report: Financial Analysis of AMP Company

Verified

Added on  2021/05/27

|26
|4161
|28
Report
AI Summary
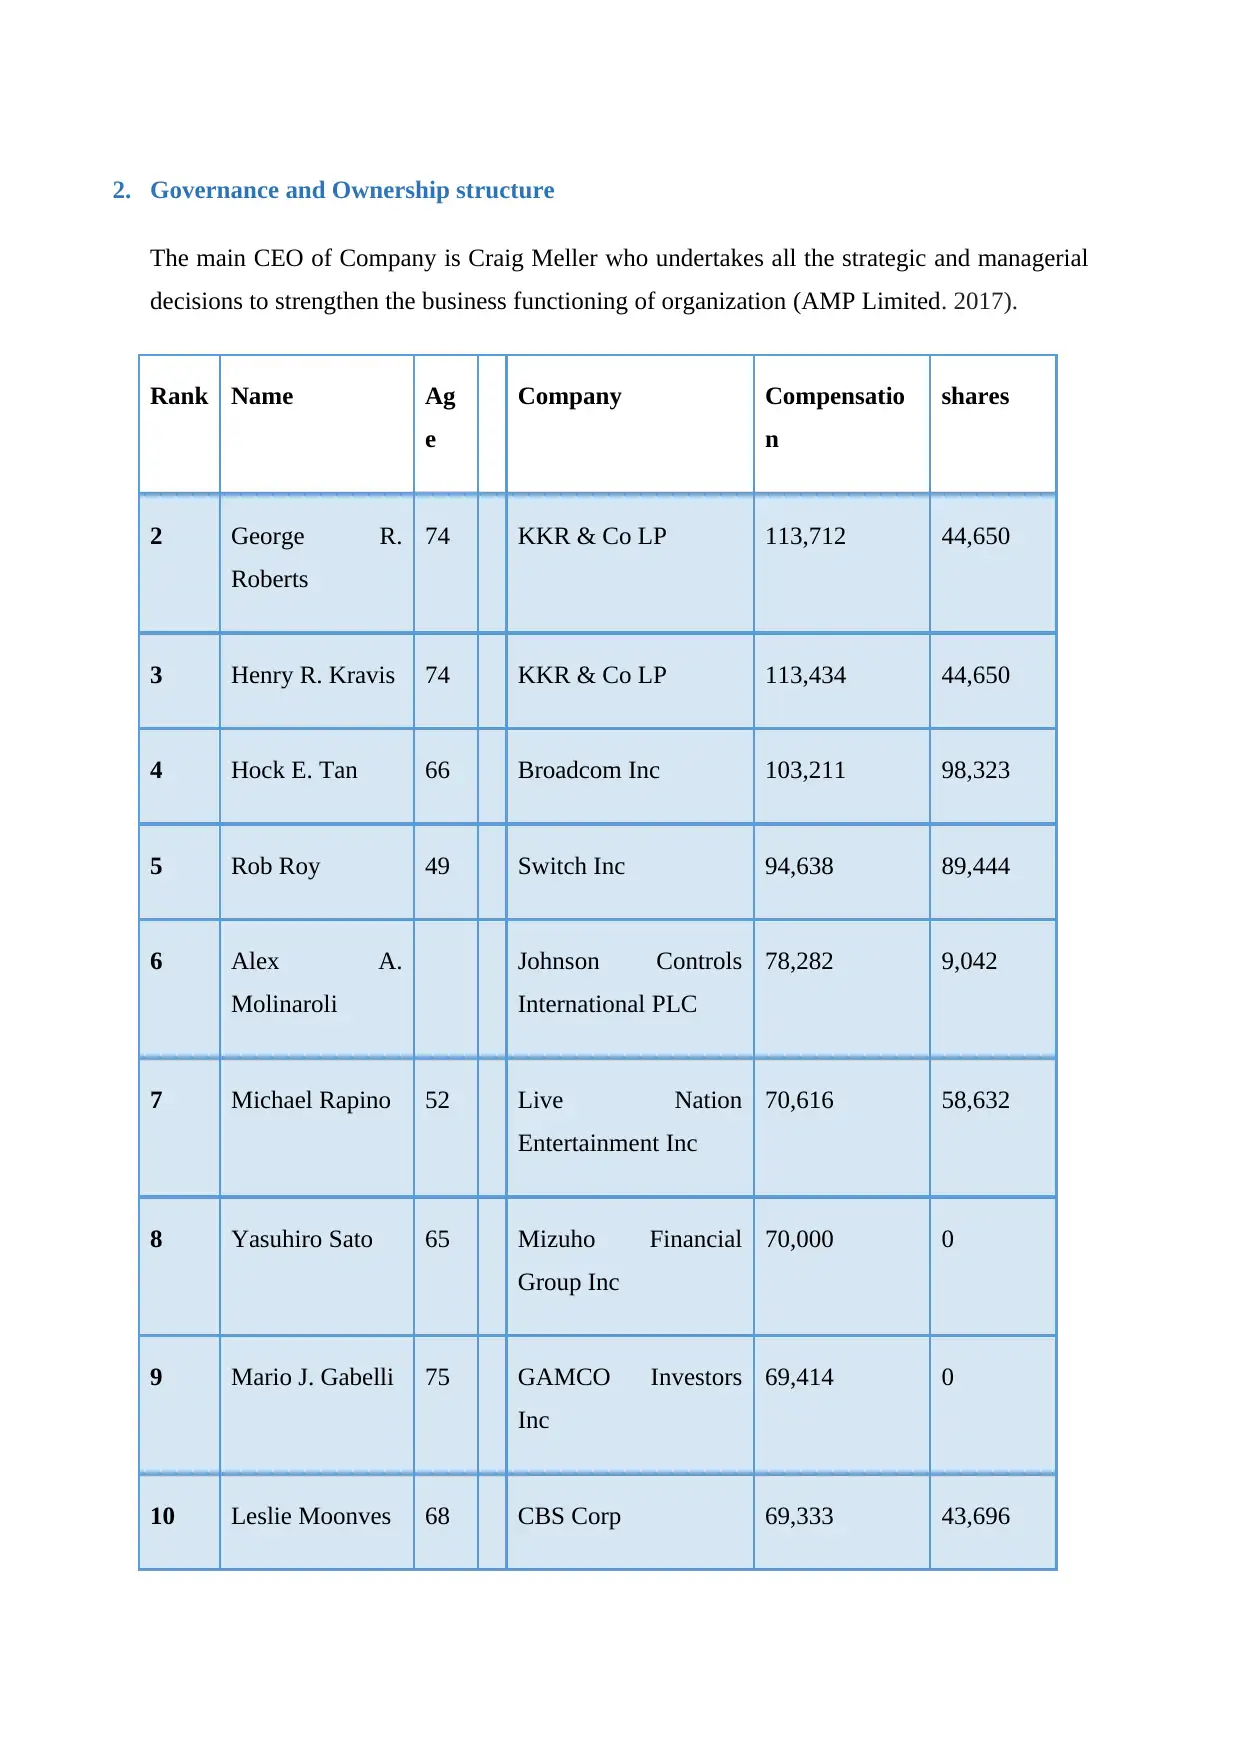
This report presents a financial analysis of AMP Company, examining its performance using various financial tools and ratios. It includes an overview of AMP Limited, its governance and ownership structure, and a detailed analysis of its short-term and long-term solvency ratios, asset utilization, profitability, and market value ratios. The report also includes a share price graph analysis, beta calculation, computation of the required rate of return using the CAPM method, and determination of an investment method (conservative investment). Furthermore, it covers the computation of the weighted average cost of capital (WACC), debt ratio considerations, and dividend policies. The analysis draws on information from financial statements, market data, and internet research to provide a comprehensive assessment of AMP Company's financial health and investment potential. The conclusion summarizes key findings and recommendations.
Document Page
RUNNING HEAD: Financial analysis of AMP Company
1
Name of the student
Topic- Financial analysis of AMP Company
University name
tabler-icon-diamond-filled.svg

Paraphrase This Document

Need a fresh take? Get an instant paraphrase of this document with our AI Paraphraser
Document Page
Table of Contents
Introduction...........................................................................................................................................3
1. Description of AMP Limited.....................................................................................................3
2. Governance and Ownership structure............................................................................................4
3. Performance ratio analysis of AMP Limited..................................................................................7
Short term solvency ratio...................................................................................................................7
Proving the equation.........................................................................................................................9
Long term Solvency ratios.................................................................................................................9
Asset utilization...............................................................................................................................10
Profitability ratios............................................................................................................................11
Market value ratios..........................................................................................................................13
4. Share price graph of the AMP Limited........................................................................................14
4.1 Graph reflecting the share price movement of AMP Company and All ordinary share price
index 14
4.2 The comparison between the Share price movement of AMP Limited and share price movement
of all ordinary stock exchange.........................................................................................................14
5. Announcements...........................................................................................................................16
6. Research via internet....................................................................................................................16
6.1 Beta calculation...................................................................................................................16
6.2 Computation of required rate of return by using CAPM method...............................................17
6.3 Determining the investment method (Conservative investment)................................................17
7. Computation of the weighted average cost of capital...................................................................18
7.1 Computed Cost of Capital through Capital Assets Pricing model........................................18
7.2 Implications that a higher WACC on investment decision........................................................18
8. Debt ratio consideration of AMP Limited....................................................................................19
8.1 Stable Debt to equity ratio of company..........................................................................................19
Dividend policies of company..............................................................................................................20
Letter of recommendation..................................................................................................................20
Conclusion...........................................................................................................................................21
9. References...................................................................................................................................22
10. Appendix.................................................................................................................................24
Document Page
Financial analysis of AMP Company 3
Introduction
It is evaluated that management and directors of company needs to make effective use
of financial tools which could be used to analysis the financial performance of Company.
The ratio analysis, top down analysis, bottom up analysis and du Pont analysis could be used
to evaluate the financial performance of company. In this report, capital structure of the
company and profitability of the company has been analyzed by using the effective strategic
financial tools. .
1. Description of AMP Limited
It is evaluated that the AMP Australia is the New Zealand Company which has been
providing superannuation benefit, investment products and financial and banking service. It
has been providing its financial and advisory services to investors to make the good value on
their investment (AMP limited. (2018).
Document Page
2. Governance and Ownership structure
The main CEO of Company is Craig Meller who undertakes all the strategic and managerial
decisions to strengthen the business functioning of organization (AMP Limited. 2017).
Rank Name Ag
e
Company Compensatio
n
shares
2 George R.
Roberts
74 KKR & Co LP 113,712 44,650
3 Henry R. Kravis 74 KKR & Co LP 113,434 44,650
4 Hock E. Tan 66 Broadcom Inc 103,211 98,323
5 Rob Roy 49 Switch Inc 94,638 89,444
6 Alex A.
Molinaroli
Johnson Controls
International PLC
78,282 9,042
7 Michael Rapino 52 Live Nation
Entertainment Inc
70,616 58,632
8 Yasuhiro Sato 65 Mizuho Financial
Group Inc
70,000 0
9 Mario J. Gabelli 75 GAMCO Investors
Inc
69,414 0
10 Leslie Moonves 68 CBS Corp 69,333 43,696
tabler-icon-diamond-filled.svg

Paraphrase This Document

Need a fresh take? Get an instant paraphrase of this document with our AI Paraphraser
Document Page
Financial analysis of AMP Company 5
11 Christopher
Terrill
50 ANGI Homeservices
Inc
68,798 3,800
12 Andrew N.
Liveris
63 DowDuPont Inc 65,689 12,174
13 Jeffery Fairburn 51 Persimmon PLC 63,697 0
14 W. Nicholas
Howley
65 TransDigm Group Inc 61,023 0
15 Douglas R.
Lebda
48 LendingTree Inc 59,591 0
16 Simon Anthony
Peckham
55 Melrose Industries
PLC
57,849 0
17 Douglas S.
Ingram
55 Sarepta Therapeutics
Inc
56,866 11,608
18 Thomas E.
Dooley
Viacom Inc 53,648 0
19 Ronald Clarke 62 Fleetcor Technologies
Inc
52,644 15,127
20 Stephen Kaufer 55 TripAdvisor Inc 47,933 28,578
21 Gregory B.
Maffei
56 Qurate Retail Inc
QVC Group
47,810 2,293
Document Page
22 Stephen B Burke 59 Comcast Corp 46,537 5,338
23 Brian
Duperreault
70 American
International Group
Inc
43,087 11,157
24 Kathleen
Eisbrenner
NextDecade Corp 43,086 42,145
25 Dirk Van de Put 57 Mondelez
International Inc
42,443 30,002
(Yahoo Finance, 2017).
There are several shareholders who have bought the shares in AMP Limited. However, there
are main five shareholders
HSBC Custody.
JP Morgan
Citi Corp
National Nominee
Document Page
Financial analysis of AMP Company 7
(AMP Limited. 2017).
3. Performance ratio analysis of AMP Limited
The ratio analysis is used to establish the relation between the two financial factors. (AMP
Limited, 2015).
Short term solvency ratio
1. Current ratio
The current ratio of company divulges how well company pay off its short term long term
debts out of the available current assets (AMP Limited, 2017).
Liquidity ratio Years
2017 2016
Current ratio .0025 .0031
Quick ratio .0025 .0031
tabler-icon-diamond-filled.svg

Paraphrase This Document

Need a fresh take? Get an instant paraphrase of this document with our AI Paraphraser
Document Page
Interpretation
The AMP Company has maintained stable financial current ratio. However, in 2017,
company has kept 0.025 current ratio which reflects that company has lower down its
investment in its current assets which will eventually increase its burden to maintain
effective.
Quick ratio
The quick ratio of company is equal to its current ratio. It is evaluated that company
has not maintained inventory in its business.
Document Page
Financial analysis of AMP Company 9
Proving the equation
Providing equation 2014 2015 2016 2017
Net profit After tax/OE 0.55154
0.47597938
5 0.42241 0.34557
EBIT/TA*NPAT/EBIT*TA/OE 0.55154
0.47597938
5 0.42241 0.34557
.
Long term Solvency ratios
Debt to equity
The debt to equity of company has increase throughout which shows that company
has increased its financial leverage throughout the time. It is evaluated that the debt to equity
of company has been 95% in 2017 which reflects that company needs to lower down its cost
of capital if it wants to maintain its business in long run (AMP Limited. 2015).
Computation of debt to equity of Company
3. Debt Ratio
2014 2015 2016 2017
A. Total Liabilities 1,26,470 1,30,813 1,32,519 140802
B. Total assets 1,34,855 1,39,708 1,40,060 1,48,085.0
0
(A/B) 94% 94% 95% 95%
Interpretation
The debt of equity of company has been around 95% which shows that company need
to lower down its debt portion to make its business less risky in long run. In addition to this,
Document Page
company has kept high financial leverage which eventually impacts the cost of capital and
will increase the overall return on capital employed.
Gearing ratio discussion
The gearing ratio shows company’s ability to cover its interest payment out of the
available earnings before interest and tax (AMP. 2017).
Gearing Ratio
2014 2015 2016 2017
Gearing Ratio 5% 6% 4% 4%
The gearing ratio of AMP Limited is too low which reflects that company has to
increase its profitability if it wants to add value in its investment.
Asset utilization
1. Inventory turnover ratio
The inventory turnover ratio of company is zero which reflects that company has not been
having inventory turnover ratio (AMP Limited. 2017).
Efficiency ratio Years
2017 2016
Inventory turnover ratio 0 0
Asset turnover ratio 0.120 2.10
Receivable turnover ratio 0 0
Days' sales in inventory 0 0
Days' sales in receivables 0 0
(AMP, 2017)
tabler-icon-diamond-filled.svg

Paraphrase This Document

Need a fresh take? Get an instant paraphrase of this document with our AI Paraphraser
Document Page
Financial analysis of AMP Company 11
2. Assets turnover ratio
The assets turnover ratio of AMP is too low which divulges that if company does not increase
its profitability then it will eventually increase the overall outcomes (AMP Limited. 2016).
3. Debtor turnover ratio
The debtor turnover ratio of AMP Company has been increased which reflects that company
has maintained its busienss more effectively. .
Profitability ratios
The profitability ratio divulges AMP Company’s ability to earn profit from its overall
turnover (AMP Limited. 2017).
Return on assets
1. Rate of Return on Assets
2014 2015 2016 2017
A. Net income 884 972 -344 848
B. Total assets 1,34,855 1,39,708 1,40,060 1,48,085
(A/B) 0.66% 1% 0% 1%
Interpretation
The return on assets of AMP Company has been zero since last four year. However, in 2017
the return on assets increased to 1 % which reflects the positive indicator for the future
growth of the business.
Return
2. Rate of Return on Equity
2014 2015 2016 2017
A. Net income available to
equity shareholders.
884 972 -344 848
B. Shareholder’s Equity 8,186
17,981
7,462 7,202.00
(A/B) 10.80% 5.41% -4.61% 11.77%
Document Page
Interpretation of the data
The return on equity of company has been very low and shown the negative results. It
is observed that company has increased its overall turnover since last two years. It has also
positively impacted the share price of company and return on capital employed at large (AMP
Limited. 2017).
chevron_up_icon
1 out of 26
circle_padding
hide_on_mobile
zoom_out_icon
[object Object]