Detailed Financial Analysis of AMP Limited: Capital Structure and Risk

Verified

Added on  2023/06/05

|11
|1731
|144
Report
AI Summary
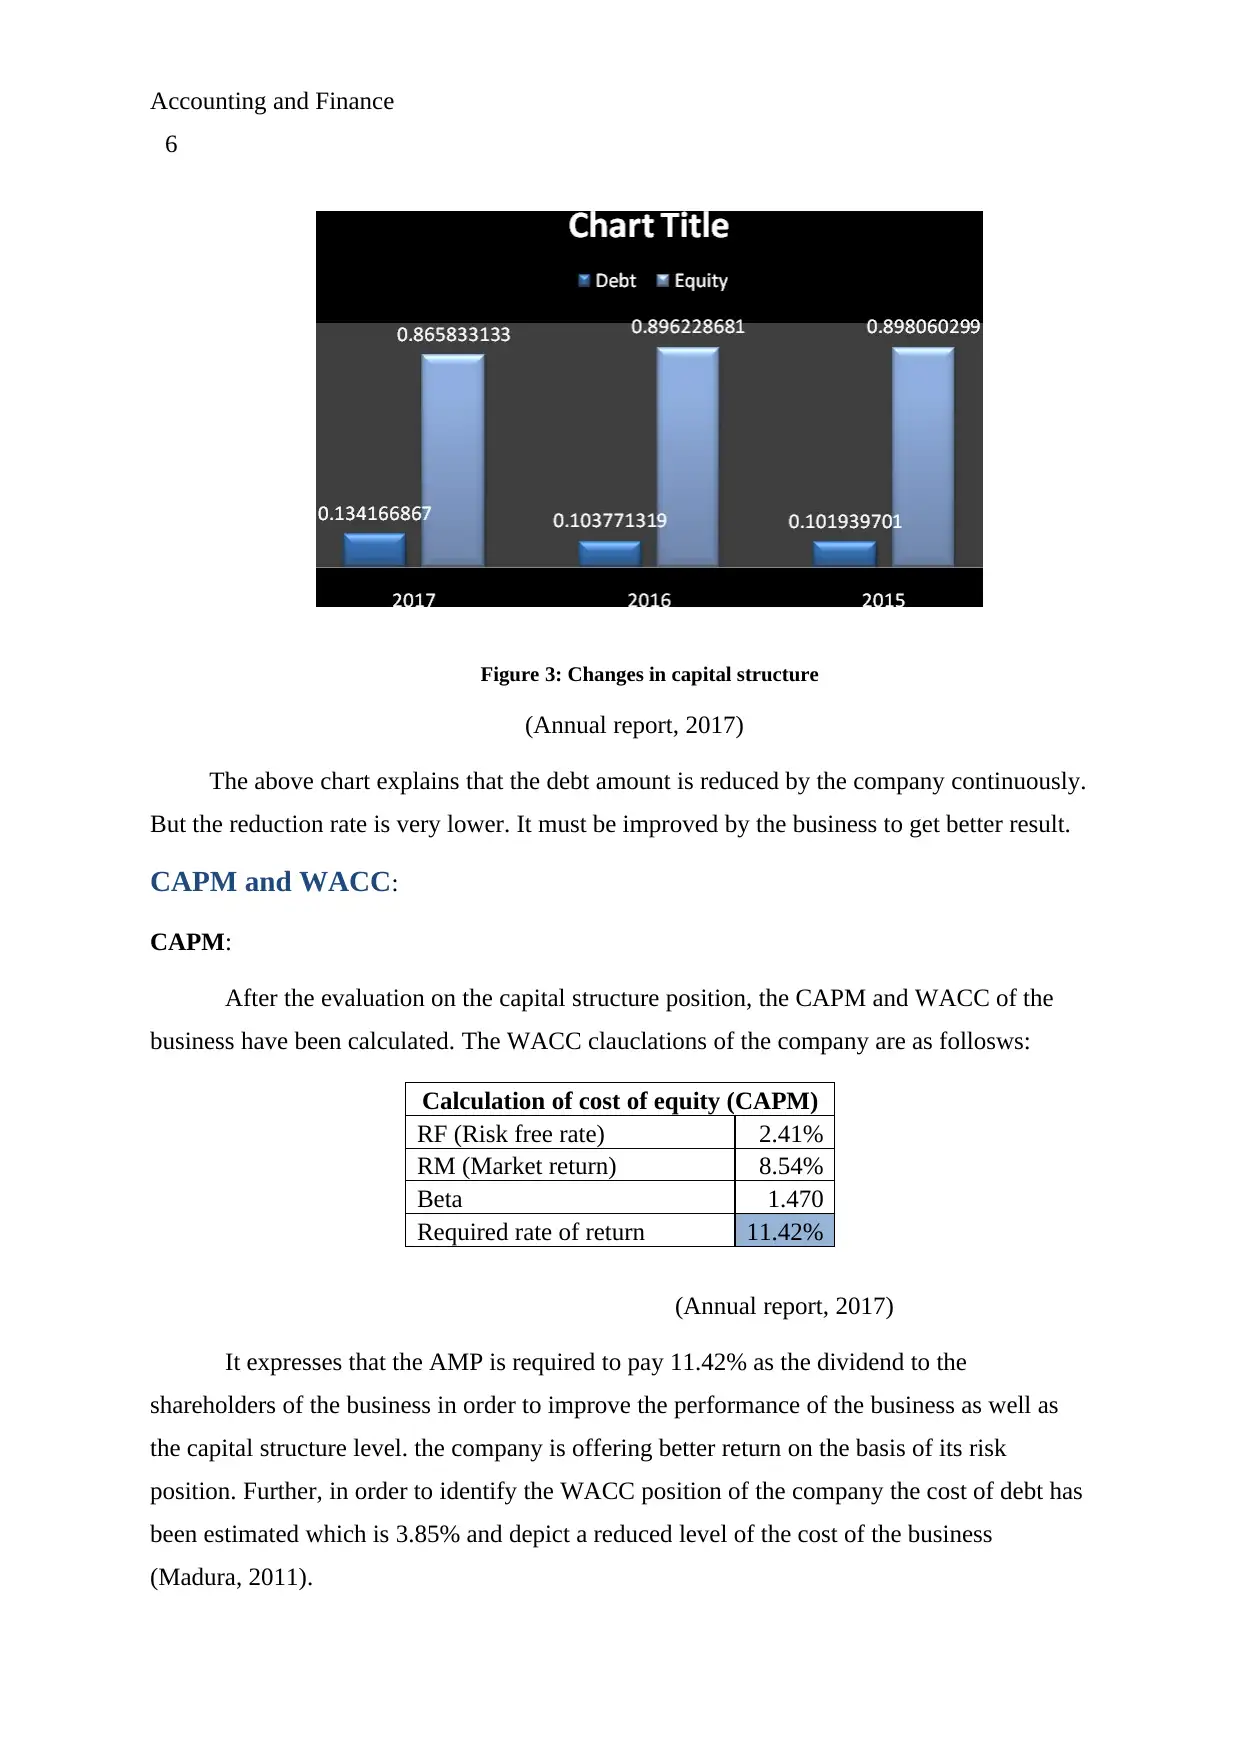
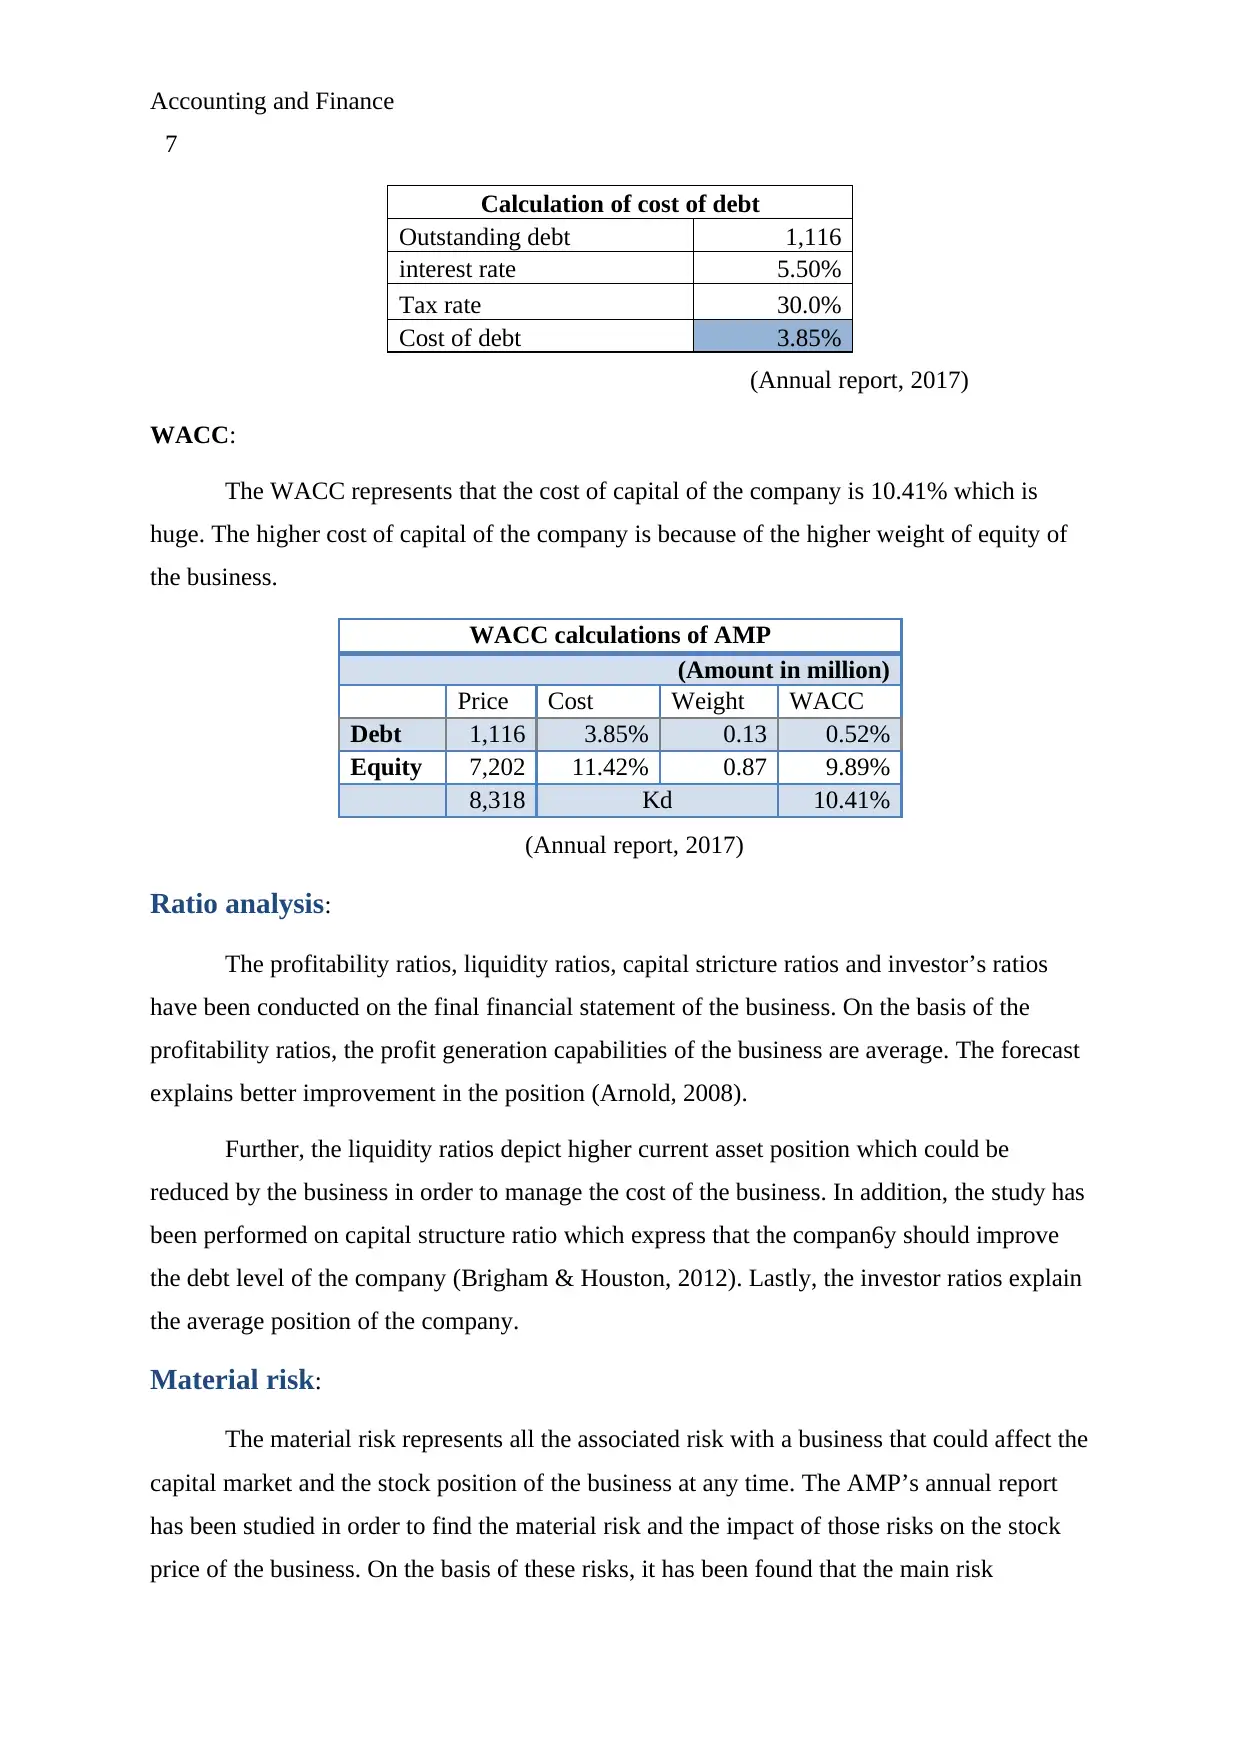
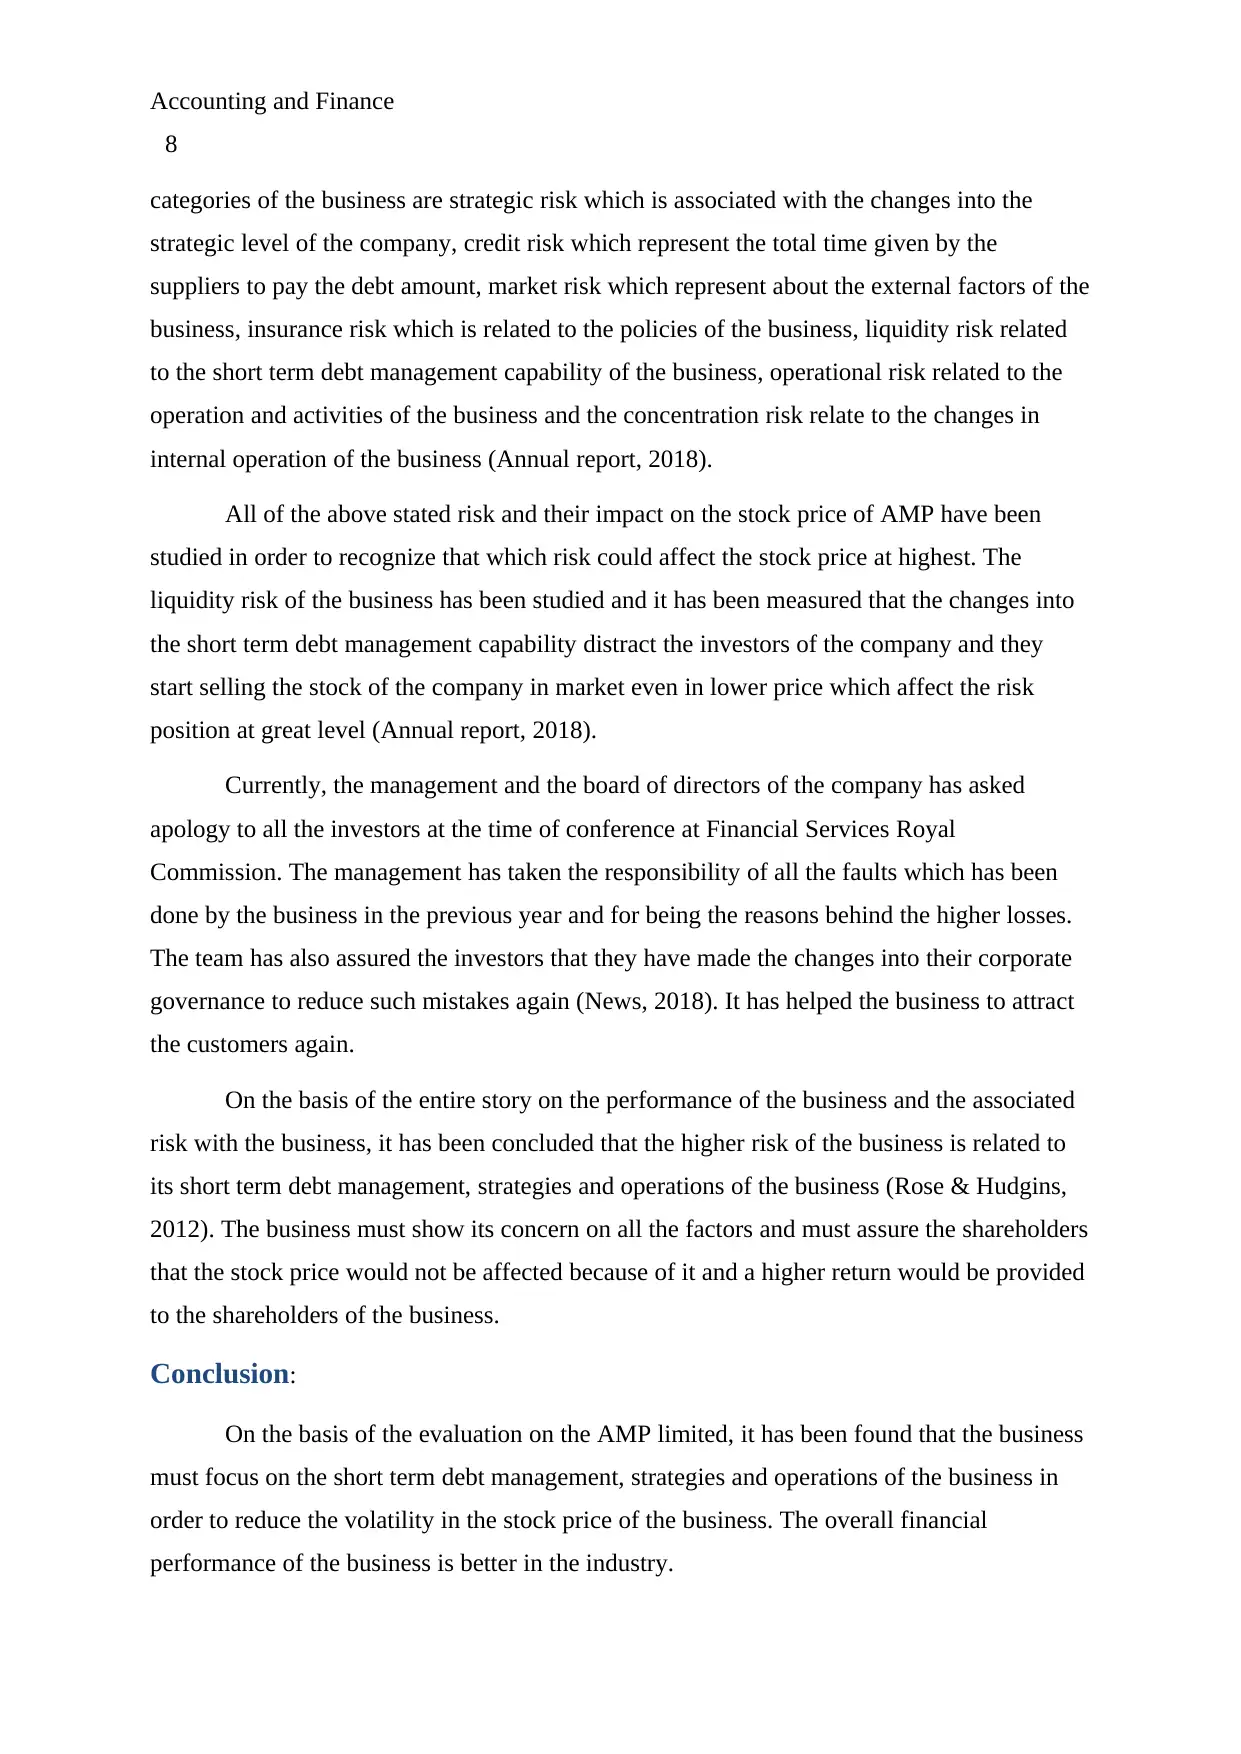
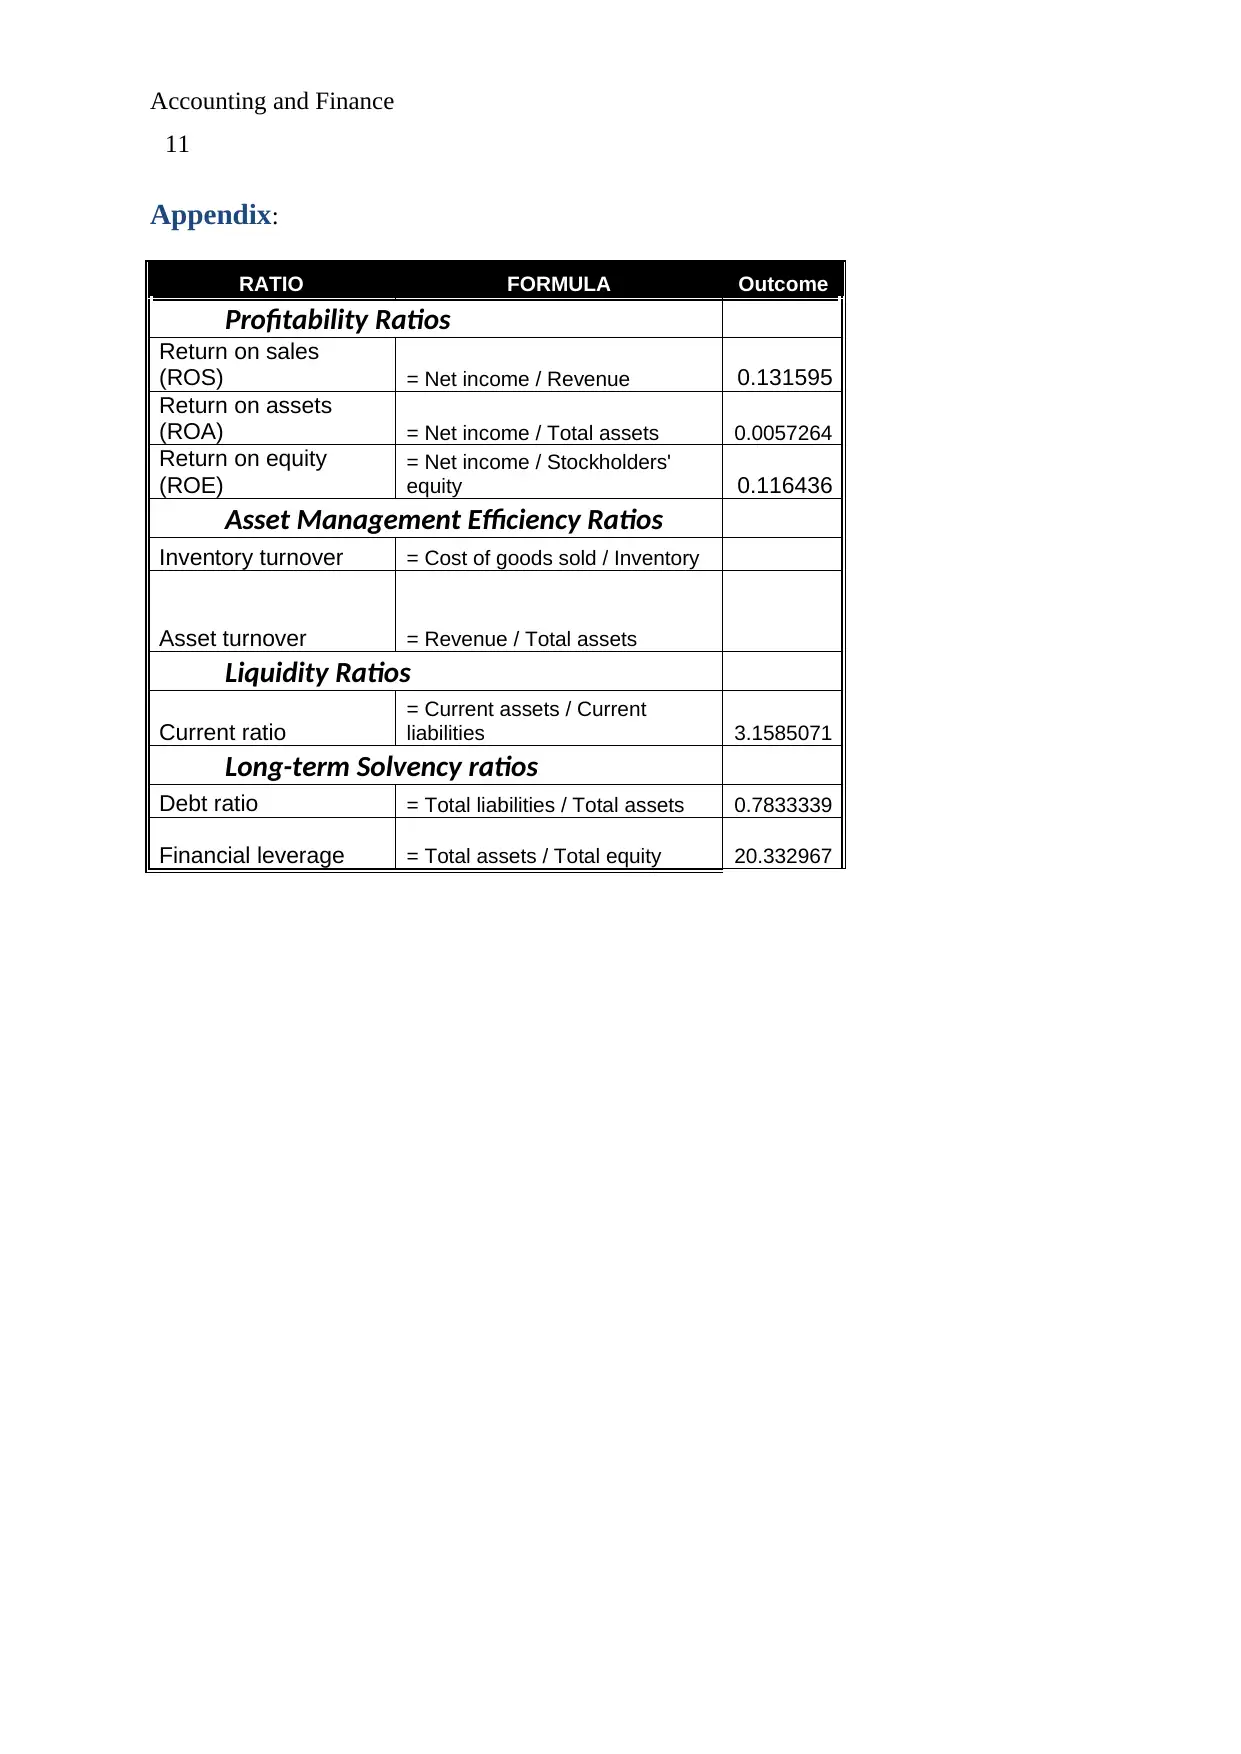
This report provides a comprehensive financial analysis of AMP Limited, an Australian financial services company. It examines the company's capital structure, comparing its debt and equity positions with those of a competitor, ANZ. The report calculates the Cost of Equity (CAPM) and WACC, highlighting the impact of equity weight on the cost of capital. Ratio analysis is performed to evaluate profitability, liquidity, capital structure, and investor ratios. The study identifies key material risks, including strategic, credit, market, and liquidity risks, with a particular focus on the impact of short-term debt management on stock price. The report concludes that AMP Limited should prioritize short-term debt management and operational strategies to mitigate stock price volatility, while acknowledging the company's overall positive financial performance within the industry.
Document Page
Running Head: Accounting and Finance
1
Project Report: Accounting and Finance
tabler-icon-diamond-filled.svg

Paraphrase This Document

Need a fresh take? Get an instant paraphrase of this document with our AI Paraphraser
Document Page
Accounting and Finance
2
Executive summary:
The report mainly focuses on an Australian company; AMP limited, the various
financial tools such as capital structure, WACC, cost of equity, ratio analysis and risk
position of the company has been identified in order to found the investment position of the
company. The study explains that the financial performance of the business is better in the
industry. The company is required to focus on the short term debt management, strategies and
operations of the business in order to reduce the volatility in the stock price of the business.
Document Page
Accounting and Finance
3
Contents
Introduction.......................................................................................................................4
Capital structure................................................................................................................4
CAPM and WACC...........................................................................................................6
Ratio analysis....................................................................................................................7
Material risk......................................................................................................................7
Conclusion........................................................................................................................8
References.........................................................................................................................9
Appendix.........................................................................................................................10
Document Page
Accounting and Finance
4
Part B:
Introduction:
The report has been prepared to identify the financial and non financial performance
of AMP limited. It focuses on the various financial tools to recognize the financial changes
and the current performance of the business. AMP limited is an Australian bank which
operates its business in the Australian and New Zealand market (Home, 2018). The report
focuses on the financial ratio, capital structure and the risk associated with the business on the
investor’s point of view.
Capital structure:
Debt and equity position:
Capital structure defines about the weight of various sources through which the funds
has been raised by the business (Moyer, McGuigan, Rao & Kretlow, 2011). The main item of
capital structure in a business is equity and debt. The AMP’s debt and equity share is as
follows:
Figure 1: Capital structure
(Annual report, 2017)
Competitor analysis:
tabler-icon-diamond-filled.svg

Paraphrase This Document

Need a fresh take? Get an instant paraphrase of this document with our AI Paraphraser
Document Page
Accounting and Finance
5
The capital position of AMP has been compared with ANZ, the competitor of the
company to evaluate the market position of capital structure. Below is the difference among
both the company’s capital structure:
Figure 2: Capital structure difference
(Annual report, 2017)
Changes in last 3 years:
The difference explains that the performance of ANZ is better in terms of managing
the financial gearing level and the cost of capital of the business. AMP must make the
required changes in the capital structure to make it more competitive.
The capital structure of the company of last 3 years has been studied further to
recognize the changes and the capital structure position of the company:
Document Page
Accounting and Finance
6
Figure 3: Changes in capital structure
(Annual report, 2017)
The above chart explains that the debt amount is reduced by the company continuously.
But the reduction rate is very lower. It must be improved by the business to get better result.
CAPM and WACC:
CAPM:
After the evaluation on the capital structure position, the CAPM and WACC of the
business have been calculated. The WACC clauclations of the company are as follosws:
Calculation of cost of equity (CAPM)
RF (Risk free rate) 2.41%
RM (Market return) 8.54%
Beta 1.470
Required rate of return 11.42%
(Annual report, 2017)
It expresses that the AMP is required to pay 11.42% as the dividend to the
shareholders of the business in order to improve the performance of the business as well as
the capital structure level. the company is offering better return on the basis of its risk
position. Further, in order to identify the WACC position of the company the cost of debt has
been estimated which is 3.85% and depict a reduced level of the cost of the business
(Madura, 2011).
Document Page
Accounting and Finance
7
Calculation of cost of debt
Outstanding debt 1,116
interest rate 5.50%
Tax rate 30.0%
Cost of debt 3.85%
(Annual report, 2017)
WACC:
The WACC represents that the cost of capital of the company is 10.41% which is
huge. The higher cost of capital of the company is because of the higher weight of equity of
the business.
WACC calculations of AMP
(Amount in million)
Price Cost Weight WACC
Debt 1,116 3.85% 0.13 0.52%
Equity 7,202 11.42% 0.87 9.89%
8,318 Kd 10.41%
(Annual report, 2017)
Ratio analysis:
The profitability ratios, liquidity ratios, capital stricture ratios and investor’s ratios
have been conducted on the final financial statement of the business. On the basis of the
profitability ratios, the profit generation capabilities of the business are average. The forecast
explains better improvement in the position (Arnold, 2008).
Further, the liquidity ratios depict higher current asset position which could be
reduced by the business in order to manage the cost of the business. In addition, the study has
been performed on capital structure ratio which express that the compan6y should improve
the debt level of the company (Brigham & Houston, 2012). Lastly, the investor ratios explain
the average position of the company.
Material risk:
The material risk represents all the associated risk with a business that could affect the
capital market and the stock position of the business at any time. The AMP’s annual report
has been studied in order to find the material risk and the impact of those risks on the stock
price of the business. On the basis of these risks, it has been found that the main risk
tabler-icon-diamond-filled.svg

Paraphrase This Document

Need a fresh take? Get an instant paraphrase of this document with our AI Paraphraser
Document Page
Accounting and Finance
8
categories of the business are strategic risk which is associated with the changes into the
strategic level of the company, credit risk which represent the total time given by the
suppliers to pay the debt amount, market risk which represent about the external factors of the
business, insurance risk which is related to the policies of the business, liquidity risk related
to the short term debt management capability of the business, operational risk related to the
operation and activities of the business and the concentration risk relate to the changes in
internal operation of the business (Annual report, 2018).
All of the above stated risk and their impact on the stock price of AMP have been
studied in order to recognize that which risk could affect the stock price at highest. The
liquidity risk of the business has been studied and it has been measured that the changes into
the short term debt management capability distract the investors of the company and they
start selling the stock of the company in market even in lower price which affect the risk
position at great level (Annual report, 2018).
Currently, the management and the board of directors of the company has asked
apology to all the investors at the time of conference at Financial Services Royal
Commission. The management has taken the responsibility of all the faults which has been
done by the business in the previous year and for being the reasons behind the higher losses.
The team has also assured the investors that they have made the changes into their corporate
governance to reduce such mistakes again (News, 2018). It has helped the business to attract
the customers again.
On the basis of the entire story on the performance of the business and the associated
risk with the business, it has been concluded that the higher risk of the business is related to
its short term debt management, strategies and operations of the business (Rose & Hudgins,
2012). The business must show its concern on all the factors and must assure the shareholders
that the stock price would not be affected because of it and a higher return would be provided
to the shareholders of the business.
Conclusion:
On the basis of the evaluation on the AMP limited, it has been found that the business
must focus on the short term debt management, strategies and operations of the business in
order to reduce the volatility in the stock price of the business. The overall financial
performance of the business is better in the industry.
Document Page
Accounting and Finance
9
Document Page
Accounting and Finance
10
References:
Annual Report. (2018). AMP Limited. [online]. Retrieved from:
http://member.afraccess.com/media?id=CMN://2A1072055&filename=20180320/
AMP_01963508.pdf
Arnold, G. (2008). Corporate financial management. Pearson Education.
Brigham, E. F., & Houston, J. F. (2012). Fundamentals of financial management. Cengage
Learning.
Home. (2018). AMP Limited. [online]. Retrieved from: https://www.amp.com.au/
Madura, J. (2011). International financial management. Cengage Learning.
Moyer, R. C., McGuigan, J., Rao, R., & Kretlow, W. (2011). Contemporary financial
management. Nelson Education.
News. (2018). AMP Limited. [online]. Retrieved from:
https://www.amp.com.au/news/2018/may/AMP-and-the-Royal-Commission
Rose, P. S., & Hudgins, S. C. (2012). Bank management & financial services. McGraw-Hill
Education.
tabler-icon-diamond-filled.svg

Paraphrase This Document

Need a fresh take? Get an instant paraphrase of this document with our AI Paraphraser
Document Page
Accounting and Finance
11
Appendix:
RATIO FORMULA Outcome
Profitability Ratios
Return on sales
(ROS) = Net income / Revenue 0.131595
Return on assets
(ROA) = Net income / Total assets 0.0057264
Return on equity
(ROE)
= Net income / Stockholders'
equity 0.116436
Asset Management Efficiency Ratios
Inventory turnover = Cost of goods sold / Inventory
Asset turnover = Revenue / Total assets
Liquidity Ratios
Current ratio
= Current assets / Current
liabilities 3.1585071
Long-term Solvency ratios
Debt ratio = Total liabilities / Total assets 0.7833339
Financial leverage = Total assets / Total equity 20.332967
chevron_up_icon
1 out of 11
circle_padding
hide_on_mobile
zoom_out_icon
[object Object]