Comprehensive Financial Performance Analysis of ANZ Banking Group
VerifiedAdded on 2021/06/14
|16
|3987
|17
Report
AI Summary
This report provides a comprehensive financial analysis of the Australia and New Zealand Banking Group (ANZ). It begins with an executive summary and an introduction to ANZ's business background. The company analysis section delves into the bank's current financial performance and economic outlook, highlighting positive trends in economic growth and falling unemployment. The report then examines ANZ's financial statements, including key ratios such as Return on Equity, cost-to-income ratio, and Earnings Per Share, demonstrating improved financial performance in 2017. Ratio analysis is conducted, covering profitability, efficiency, liquidity, and gearing ratios over a two-year period, revealing increased profitability and market value ratios. The report concludes with recommendations and an overall assessment of ANZ's financial health and future prospects, suggesting a positive economic outlook for the bank. Supporting data is included in an attached Excel spreadsheet.
ANZ
FINA6017 T1 2018
NAME: STUDENT ID:
FINA6017 T1 2018
NAME: STUDENT ID:
Paraphrase This Document
Need a fresh take? Get an instant paraphrase of this document with our AI Paraphraser
Student name – ID FINA6017 T1 2018
Assignment – ANZ
Executive Summary
The report contains an overall analysis of the Australia and New Zealand Banking Group. ANZ is
the largest banking group which is listed in top 100 banks of Australia. The bank provides various
financial services and products such as bank overdrafts, insurance services, credit card facility,
financial advices and solutions. The first part provides a brief introduction about the business and
background of ANZ.
The second part deals with the company analysis which includes current financial performance and
economic outlook of the bank. As per the research for the economic outlook, it is observed that in
the coming years, economy will enjoy a wide growth and also a fall will be there in the
unemployment level of the country. It will show positive trends and there will be a positive growth
of the banking group. The financial performance of the banking group reported in last year was
commendable. The bank has provided high returns to its shareholders and has also reduced it’s cost.
This has boosted up its cost to income ratio at 50.7% from 46.1% in the last year. Along with this,
its liquidity position has also increased from 126% to 135% in accordance with a rise in EPS at
237.1 cents. Overall, it is observed that group’s financial performance has improved in the last year.
Ratio analysis is done in the third part which includes the calculation of all the ratios that measure
the profitability, liquidity, efficiency and solvency of the firm over the past two years. The analysis
reflected that the bank has increased profitability and market value ratio. Also the ratios calculated
for determining the efficiency of the bank shows that ANZ’s capability of generating revenue from
its assets has increased over the years.
The final part of the report provides overall recommendation and conclusion of the analysis that
includes the findings of the report. The findings suggested that the overall financial performance of
the group has increased in 2017 and it is expected that the bank will have a positive economic
changes in future.
1
Student name – ID FINA6017 T1 2018
Assignment – ANZ
Contents
Page Number
1 Introduction 2
1.1 Background and Business
2 Company Analysis
2.1 Analysis of financial statements of the business
Current Financial performance, economic outlook
3 Ratio Analysis
3.1 Profitability ratios
3.2 Efficiency ratios
3.3 Liquidity ratios
3.4 Gearing ratios
4 Recommendations and overall assessment
5 References/Bibliography
Appendices – attached Excel Spreadsheet
2
⊘ This is a preview!⊘
Do you want full access?
Subscribe today to unlock all pages.
Trusted by 1+ million students worldwide
Student name – ID FINA6017 T1 2018
Assignment – ANZ
1 Introduction
1.1 Background and Business
Australia and New Zealand Banking Group Ltd is the largest company in Australia and New
Zealand. It is the major international banking group listed in top 100 banks of the world. ANZ
started its business in 1830s and its headquarters are located in Melbourne. In 1835, ANZ
commenced its business in London when The Bank of Australasia was established. Later in 1970,
the bank got merged with the English, Scottish and Australian Bank in order to form an organization
which is now named as Australia and New Zealand Banking Group Ltd. This is usually considered
as the largest merger in the banking industry of Australia (ANZ.com. 2018).
Being the largest group, it serves over 5 million customers and have assets worth AUD$ 247 billion.
More than 28,000 people are employed in the primary markets of Australia and New Zealand,
United States, UK and Asia Pacific. ANZ is counted in the list of 10 largest companies in Australia
having a price of AUD $27.91 per share (Reuters.com. 2018). ANZ key business is to provide
banking products and services to every type of customer whether individual, corporate or rural
customers. The company also deals in accepting term deposits, current and savings account, foreign
currency accounts and many more. Services offered by ANZ include personal and business loans,
credit cards, financing solutions, overdrafts, mortgages, insurance services and products, financial
advisory and other banking services.
ANZ is listed on ASX and is traded with a ticker symbol of ASX: ANZ. It has the largest market
capitalization and is a dominator in retail and commercial banking business. The CEO of the group
is Shayne Elliott and the chairman is David Gonski. The company is operating well and is focused
towards future growth (Bloomberg.com. 2018).
2 Company Analysis
3
Paraphrase This Document
Need a fresh take? Get an instant paraphrase of this document with our AI Paraphraser
Student name – ID FINA6017 T1 2018
Assignment – ANZ
2.1 Financial statements, Current Financial performance, economic outlook
Financial statement analysis is the critical review of company’s financials in order to make
appropriate and suitable business and economic decisions. The analysis is done with the help of
various ratios which are calculated later in the report. In order to raise the finance for the group’s
operation, ANZ mainly relies on the loans and advances it provides to its customers. These are the
main source and the interest earned on them is the income of the bank. Instead of relying more on
borrowings, the company finance its business operations through equity. The same is reflected in its
debt ratio and debt to equity ratio.
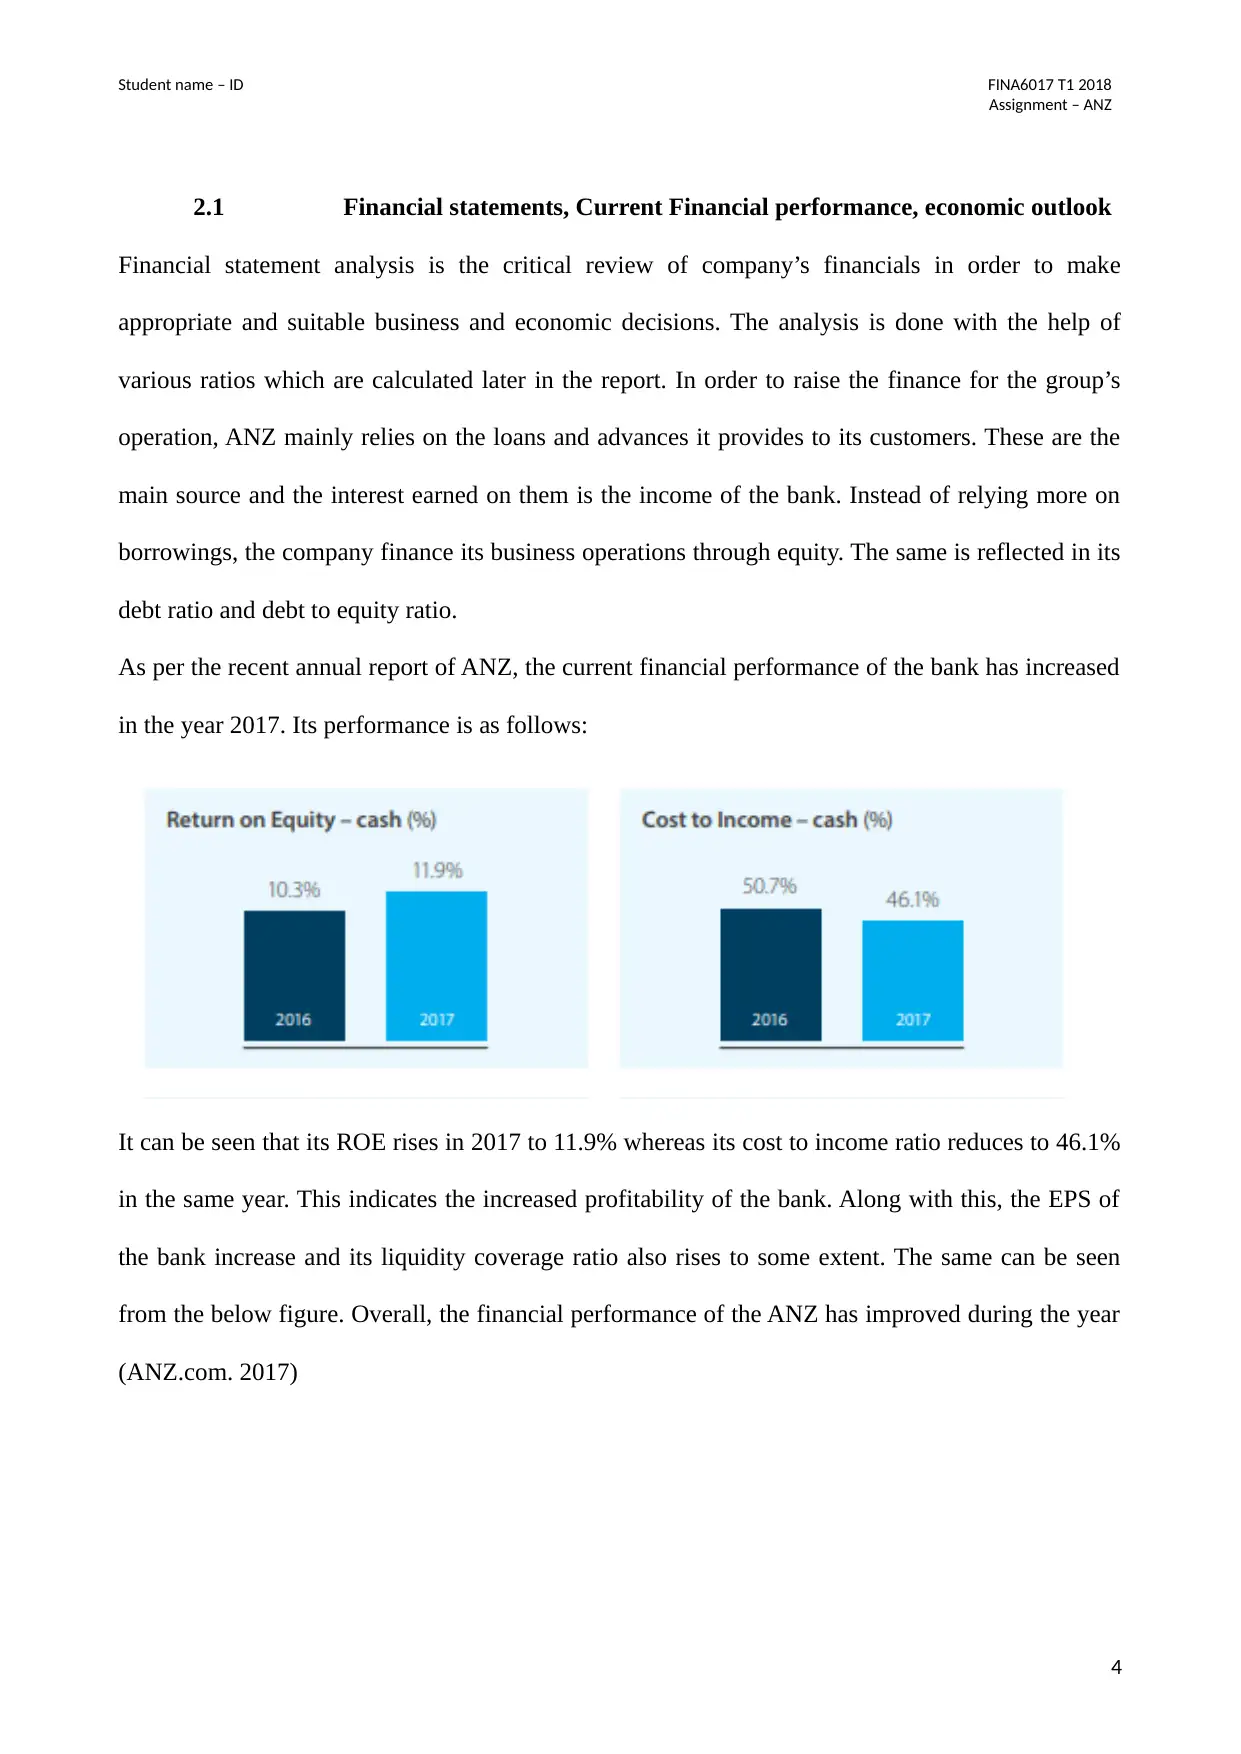
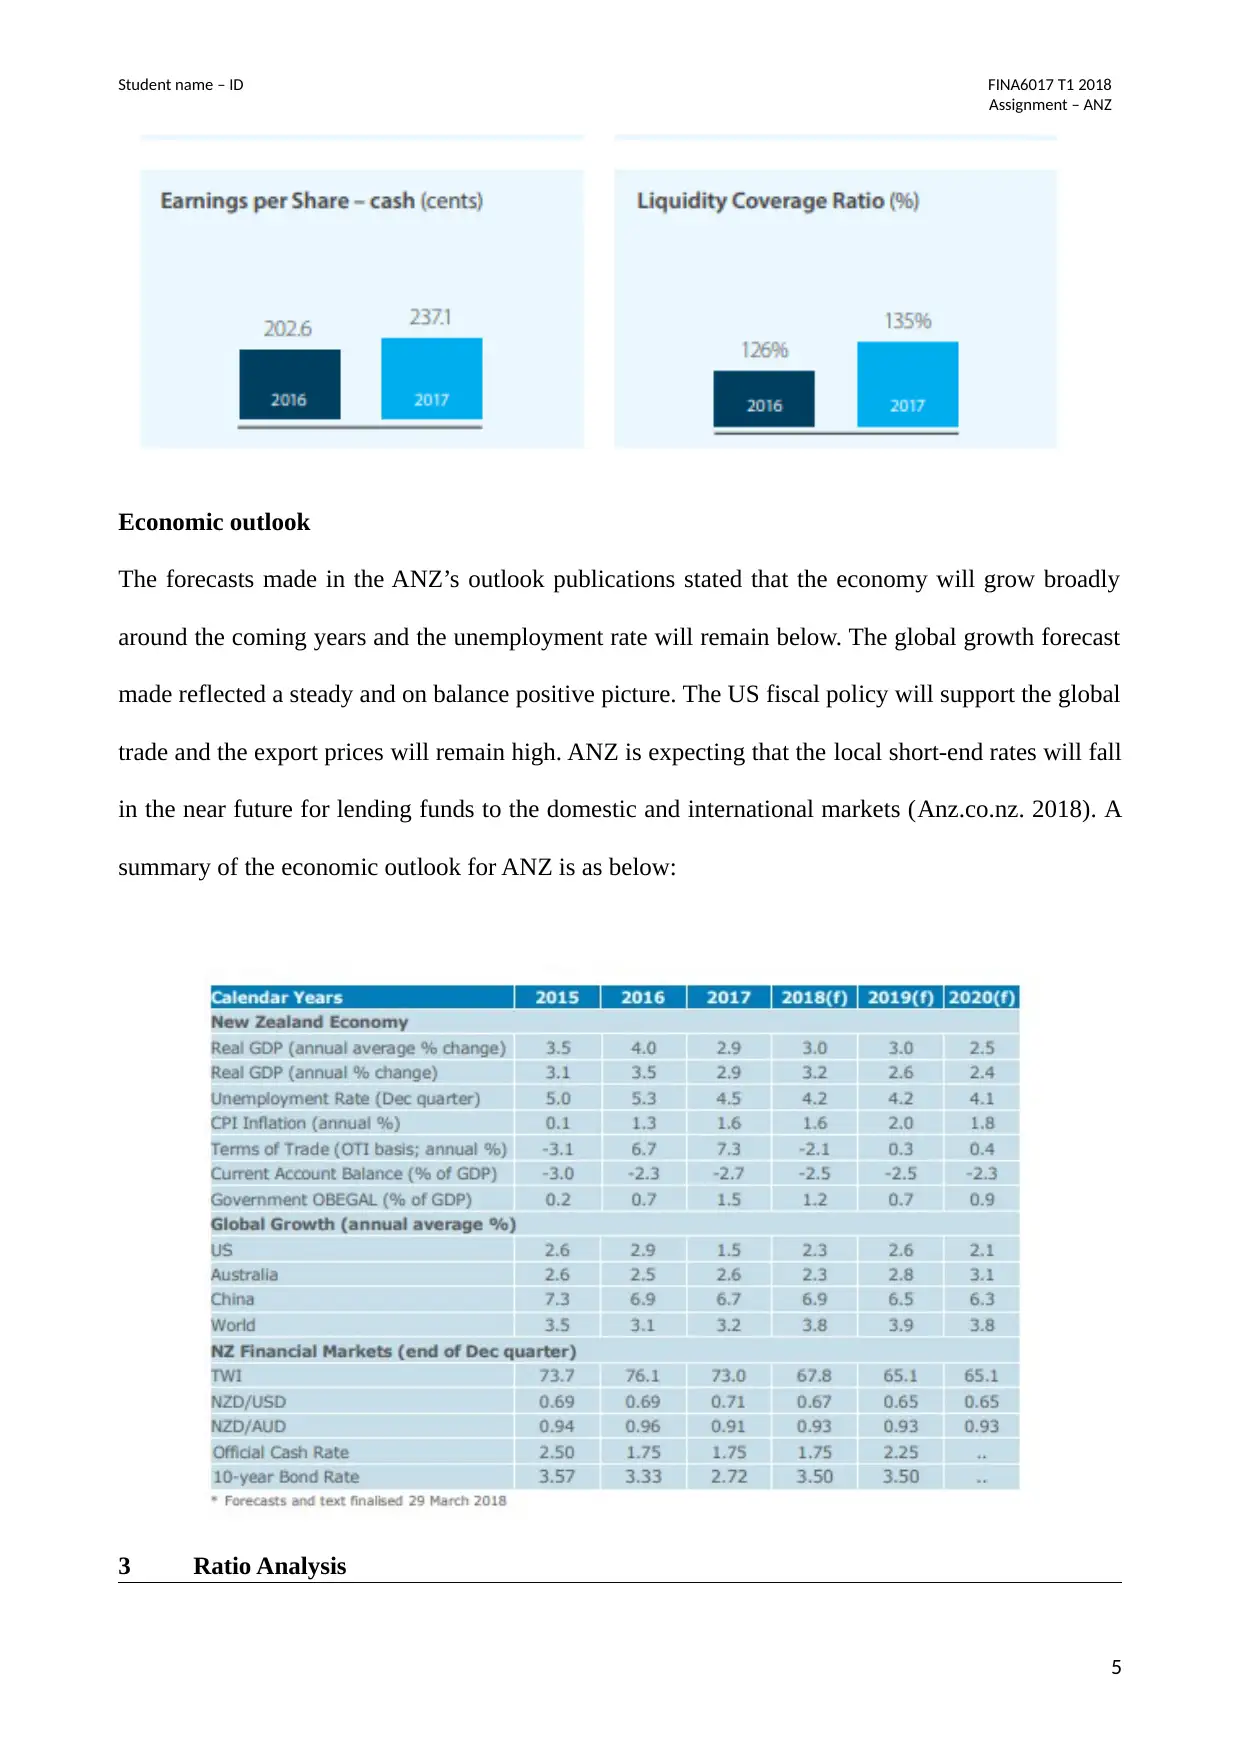
As per the recent annual report of ANZ, the current financial performance of the bank has increased
in the year 2017. Its performance is as follows:
It can be seen that its ROE rises in 2017 to 11.9% whereas its cost to income ratio reduces to 46.1%
in the same year. This indicates the increased profitability of the bank. Along with this, the EPS of
the bank increase and its liquidity coverage ratio also rises to some extent. The same can be seen
from the below figure. Overall, the financial performance of the ANZ has improved during the year
(ANZ.com. 2017)
4
Assignment – ANZ
2.1 Financial statements, Current Financial performance, economic outlook
Financial statement analysis is the critical review of company’s financials in order to make
appropriate and suitable business and economic decisions. The analysis is done with the help of
various ratios which are calculated later in the report. In order to raise the finance for the group’s
operation, ANZ mainly relies on the loans and advances it provides to its customers. These are the
main source and the interest earned on them is the income of the bank. Instead of relying more on
borrowings, the company finance its business operations through equity. The same is reflected in its
debt ratio and debt to equity ratio.
As per the recent annual report of ANZ, the current financial performance of the bank has increased
in the year 2017. Its performance is as follows:
It can be seen that its ROE rises in 2017 to 11.9% whereas its cost to income ratio reduces to 46.1%
in the same year. This indicates the increased profitability of the bank. Along with this, the EPS of
the bank increase and its liquidity coverage ratio also rises to some extent. The same can be seen
from the below figure. Overall, the financial performance of the ANZ has improved during the year
(ANZ.com. 2017)
4
Student name – ID FINA6017 T1 2018
Assignment – ANZ
Economic outlook
The forecasts made in the ANZ’s outlook publications stated that the economy will grow broadly
around the coming years and the unemployment rate will remain below. The global growth forecast
made reflected a steady and on balance positive picture. The US fiscal policy will support the global
trade and the export prices will remain high. ANZ is expecting that the local short-end rates will fall
in the near future for lending funds to the domestic and international markets (Anz.co.nz. 2018). A
summary of the economic outlook for ANZ is as below:
3 Ratio Analysis
5
⊘ This is a preview!⊘
Do you want full access?
Subscribe today to unlock all pages.
Trusted by 1+ million students worldwide
Student name – ID FINA6017 T1 2018
Assignment – ANZ
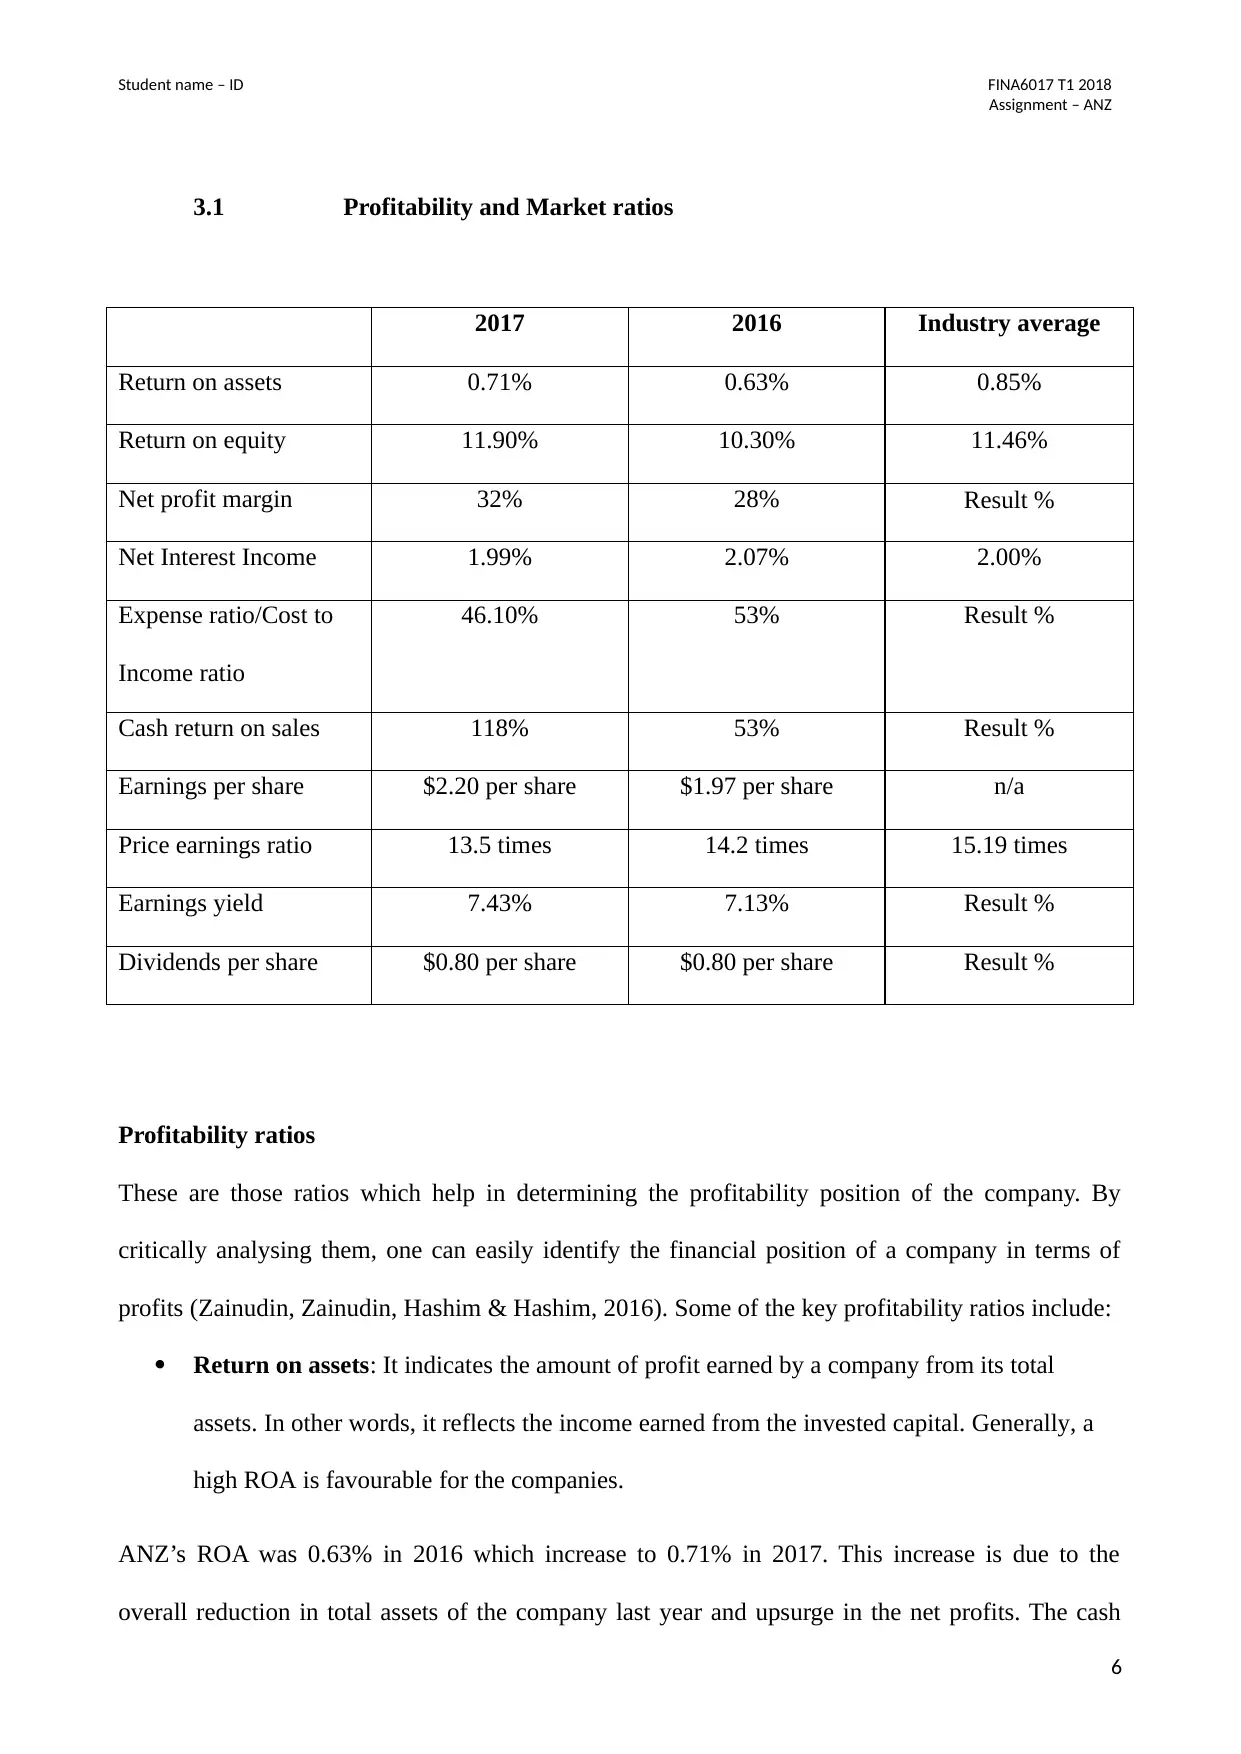
3.1 Profitability and Market ratios
2017 2016 Industry average
Return on assets 0.71% 0.63% 0.85%
Return on equity 11.90% 10.30% 11.46%
Net profit margin 32% 28% Result %
Net Interest Income 1.99% 2.07% 2.00%
Expense ratio/Cost to
Income ratio
46.10% 53% Result %
Cash return on sales 118% 53% Result %
Earnings per share $2.20 per share $1.97 per share n/a
Price earnings ratio 13.5 times 14.2 times 15.19 times
Earnings yield 7.43% 7.13% Result %
Dividends per share $0.80 per share $0.80 per share Result %
Profitability ratios
These are those ratios which help in determining the profitability position of the company. By
critically analysing them, one can easily identify the financial position of a company in terms of
profits (Zainudin, Zainudin, Hashim & Hashim, 2016). Some of the key profitability ratios include:
Return on assets: It indicates the amount of profit earned by a company from its total
assets. In other words, it reflects the income earned from the invested capital. Generally, a
high ROA is favourable for the companies.
ANZ’s ROA was 0.63% in 2016 which increase to 0.71% in 2017. This increase is due to the
overall reduction in total assets of the company last year and upsurge in the net profits. The cash
6
Assignment – ANZ
3.1 Profitability and Market ratios
2017 2016 Industry average
Return on assets 0.71% 0.63% 0.85%
Return on equity 11.90% 10.30% 11.46%
Net profit margin 32% 28% Result %
Net Interest Income 1.99% 2.07% 2.00%
Expense ratio/Cost to
Income ratio
46.10% 53% Result %
Cash return on sales 118% 53% Result %
Earnings per share $2.20 per share $1.97 per share n/a
Price earnings ratio 13.5 times 14.2 times 15.19 times
Earnings yield 7.43% 7.13% Result %
Dividends per share $0.80 per share $0.80 per share Result %
Profitability ratios
These are those ratios which help in determining the profitability position of the company. By
critically analysing them, one can easily identify the financial position of a company in terms of
profits (Zainudin, Zainudin, Hashim & Hashim, 2016). Some of the key profitability ratios include:
Return on assets: It indicates the amount of profit earned by a company from its total
assets. In other words, it reflects the income earned from the invested capital. Generally, a
high ROA is favourable for the companies.
ANZ’s ROA was 0.63% in 2016 which increase to 0.71% in 2017. This increase is due to the
overall reduction in total assets of the company last year and upsurge in the net profits. The cash
6
Paraphrase This Document
Need a fresh take? Get an instant paraphrase of this document with our AI Paraphraser
Student name – ID FINA6017 T1 2018
Assignment – ANZ
balance of the group increases which indicates that the company has utilized its assets very well.
However, the ratio was less than the industry average of 0.85%.
Return on equity: It indicates the amount of return offered by an entity to its investors and
shareholders on their equity. Usually, investors prefer a high ROE (Vogel, 2014).
The same trend follows in ROE of ANZ. It has increased during the period of 2016 to 2017. The
ROE of ANZ was 10.30% in 2016 which was increased to 11.90% in 2017. Reason being, rise in
the net income of the group from $5720 million to $6421 million. Also the ratio was more than the
industry average of 11.46%.
Net profit margin: This ratio expresses the amount of net profit as a percentage of total
revenue. It shows the overall profitability of the company (Saleem & Rehman, 2011).
In 2016, ANZ’s NPR was 28% which rise to 32% in 2017. An increase of 4% was there last year
which anyhow enhances the profitability position of the company. This was due to the ongoing
improvement in the credit quality of the bank.
Net interest income: it is basically a difference between the amount of interest received and
interest paid.
The ANZ’s net interest margin was 2.07% in 2016 which reduces to 1.99% in 2017, less than the
industry average of 2%. This is because of the increase in the average interest earning assets which
stimulates a slower growth environment.
Cost to income ratio: This ratio measures the cost and of a company in relation to its
operating income. The lower the ratio, the profitable bank will be (Levi & Segal, 2015).
ANZ’s ratio is reduced from 53% to 46.10% in 2017. This implies that the cost of running the
business is reduced and the bank has generated more operating income last year.
Cash return on sales: This ratio measures the company’s operation efficiency and also
known as operating profit margin.
The ROS of ANZ was more than double in 2017 as compare to that of in 2016. It was 53% in 2016
7
Student name – ID FINA6017 T1 2018
Assignment – ANZ
and the same rises to 118% in 2017. Such huge increase is due to the rise in amount of cash balance
which makes the bank more efficient.
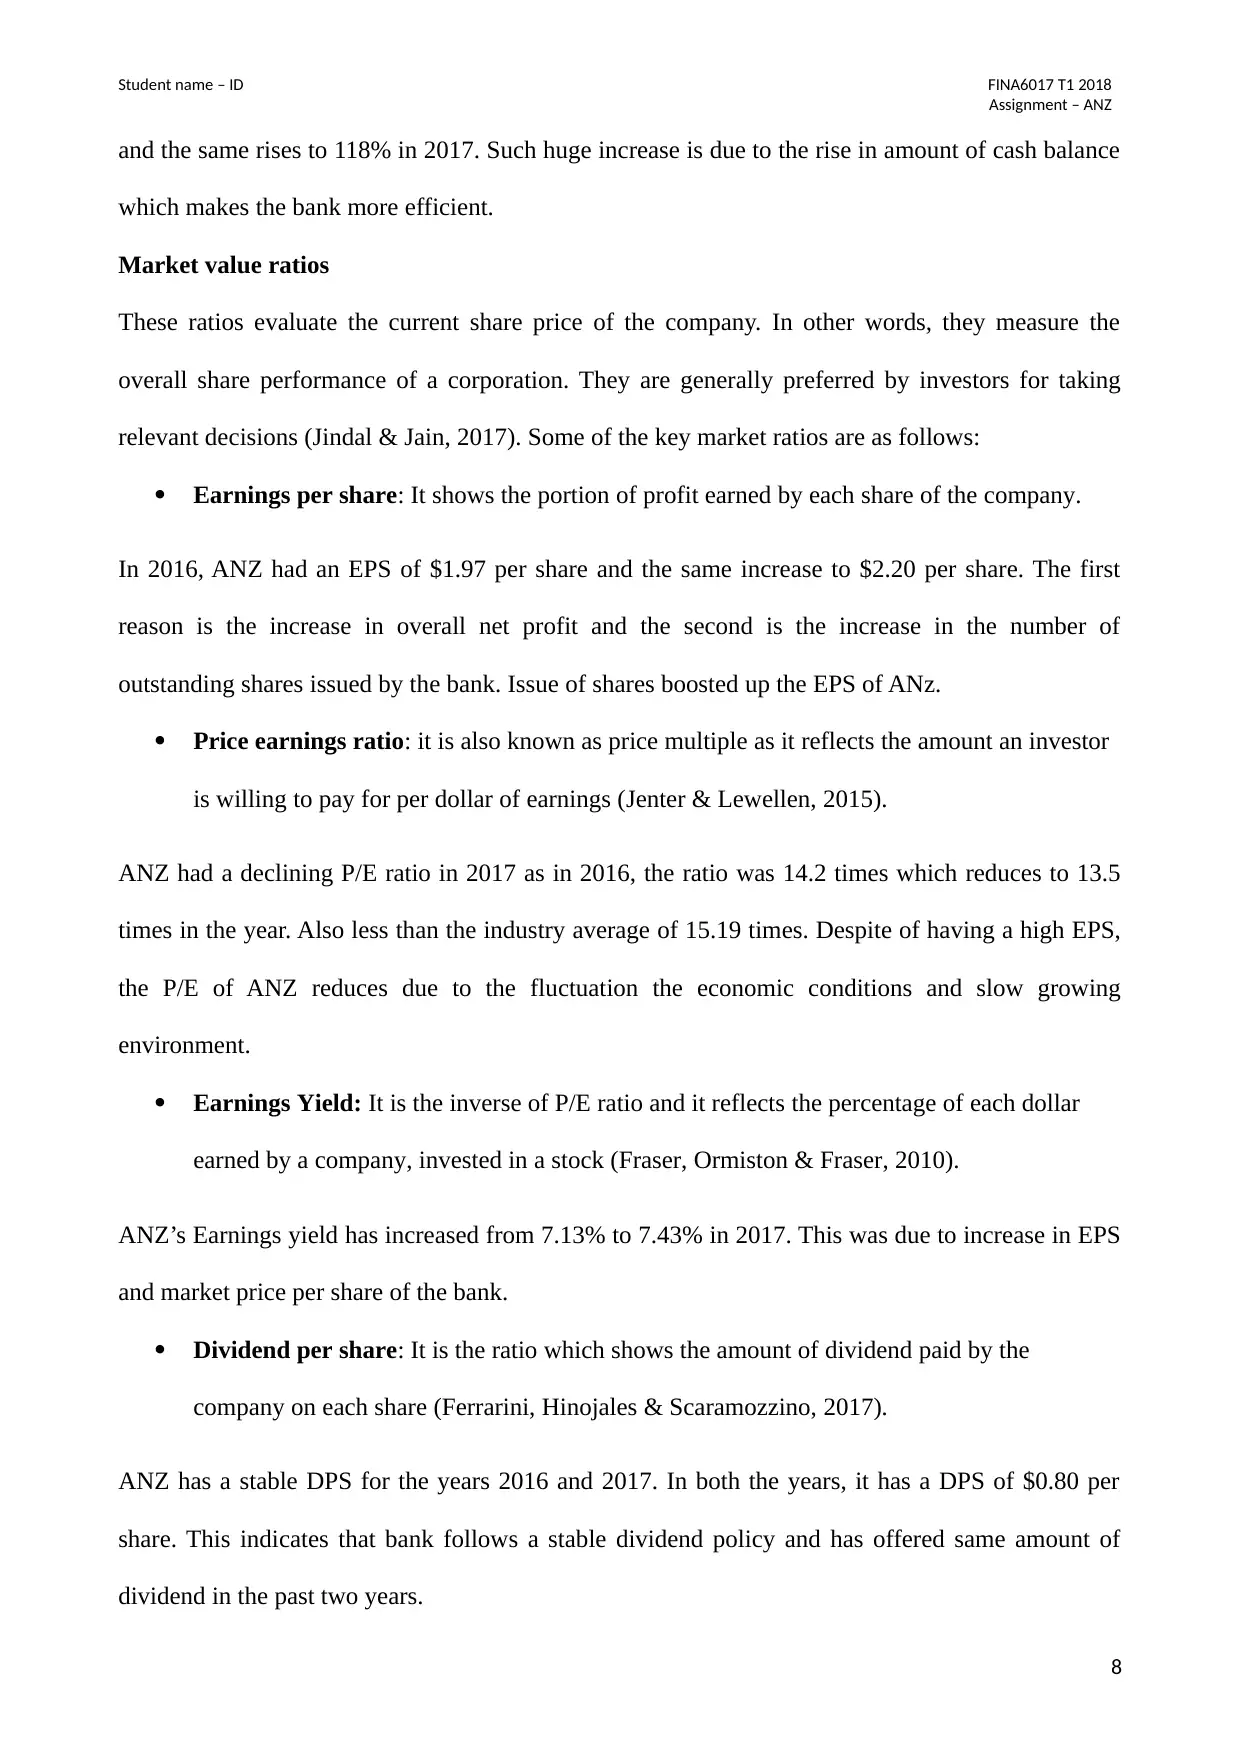
Market value ratios
These ratios evaluate the current share price of the company. In other words, they measure the
overall share performance of a corporation. They are generally preferred by investors for taking
relevant decisions (Jindal & Jain, 2017). Some of the key market ratios are as follows:
Earnings per share: It shows the portion of profit earned by each share of the company.
In 2016, ANZ had an EPS of $1.97 per share and the same increase to $2.20 per share. The first
reason is the increase in overall net profit and the second is the increase in the number of
outstanding shares issued by the bank. Issue of shares boosted up the EPS of ANz.
Price earnings ratio: it is also known as price multiple as it reflects the amount an investor
is willing to pay for per dollar of earnings (Jenter & Lewellen, 2015).
ANZ had a declining P/E ratio in 2017 as in 2016, the ratio was 14.2 times which reduces to 13.5
times in the year. Also less than the industry average of 15.19 times. Despite of having a high EPS,
the P/E of ANZ reduces due to the fluctuation the economic conditions and slow growing
environment.
Earnings Yield: It is the inverse of P/E ratio and it reflects the percentage of each dollar
earned by a company, invested in a stock (Fraser, Ormiston & Fraser, 2010).
ANZ’s Earnings yield has increased from 7.13% to 7.43% in 2017. This was due to increase in EPS
and market price per share of the bank.
Dividend per share: It is the ratio which shows the amount of dividend paid by the
company on each share (Ferrarini, Hinojales & Scaramozzino, 2017).
ANZ has a stable DPS for the years 2016 and 2017. In both the years, it has a DPS of $0.80 per
share. This indicates that bank follows a stable dividend policy and has offered same amount of
dividend in the past two years.
8
Assignment – ANZ
and the same rises to 118% in 2017. Such huge increase is due to the rise in amount of cash balance
which makes the bank more efficient.
Market value ratios
These ratios evaluate the current share price of the company. In other words, they measure the
overall share performance of a corporation. They are generally preferred by investors for taking
relevant decisions (Jindal & Jain, 2017). Some of the key market ratios are as follows:
Earnings per share: It shows the portion of profit earned by each share of the company.
In 2016, ANZ had an EPS of $1.97 per share and the same increase to $2.20 per share. The first
reason is the increase in overall net profit and the second is the increase in the number of
outstanding shares issued by the bank. Issue of shares boosted up the EPS of ANz.
Price earnings ratio: it is also known as price multiple as it reflects the amount an investor
is willing to pay for per dollar of earnings (Jenter & Lewellen, 2015).
ANZ had a declining P/E ratio in 2017 as in 2016, the ratio was 14.2 times which reduces to 13.5
times in the year. Also less than the industry average of 15.19 times. Despite of having a high EPS,
the P/E of ANZ reduces due to the fluctuation the economic conditions and slow growing
environment.
Earnings Yield: It is the inverse of P/E ratio and it reflects the percentage of each dollar
earned by a company, invested in a stock (Fraser, Ormiston & Fraser, 2010).
ANZ’s Earnings yield has increased from 7.13% to 7.43% in 2017. This was due to increase in EPS
and market price per share of the bank.
Dividend per share: It is the ratio which shows the amount of dividend paid by the
company on each share (Ferrarini, Hinojales & Scaramozzino, 2017).
ANZ has a stable DPS for the years 2016 and 2017. In both the years, it has a DPS of $0.80 per
share. This indicates that bank follows a stable dividend policy and has offered same amount of
dividend in the past two years.
8
⊘ This is a preview!⊘
Do you want full access?
Subscribe today to unlock all pages.
Trusted by 1+ million students worldwide
Student name – ID FINA6017 T1 2018
Assignment – ANZ
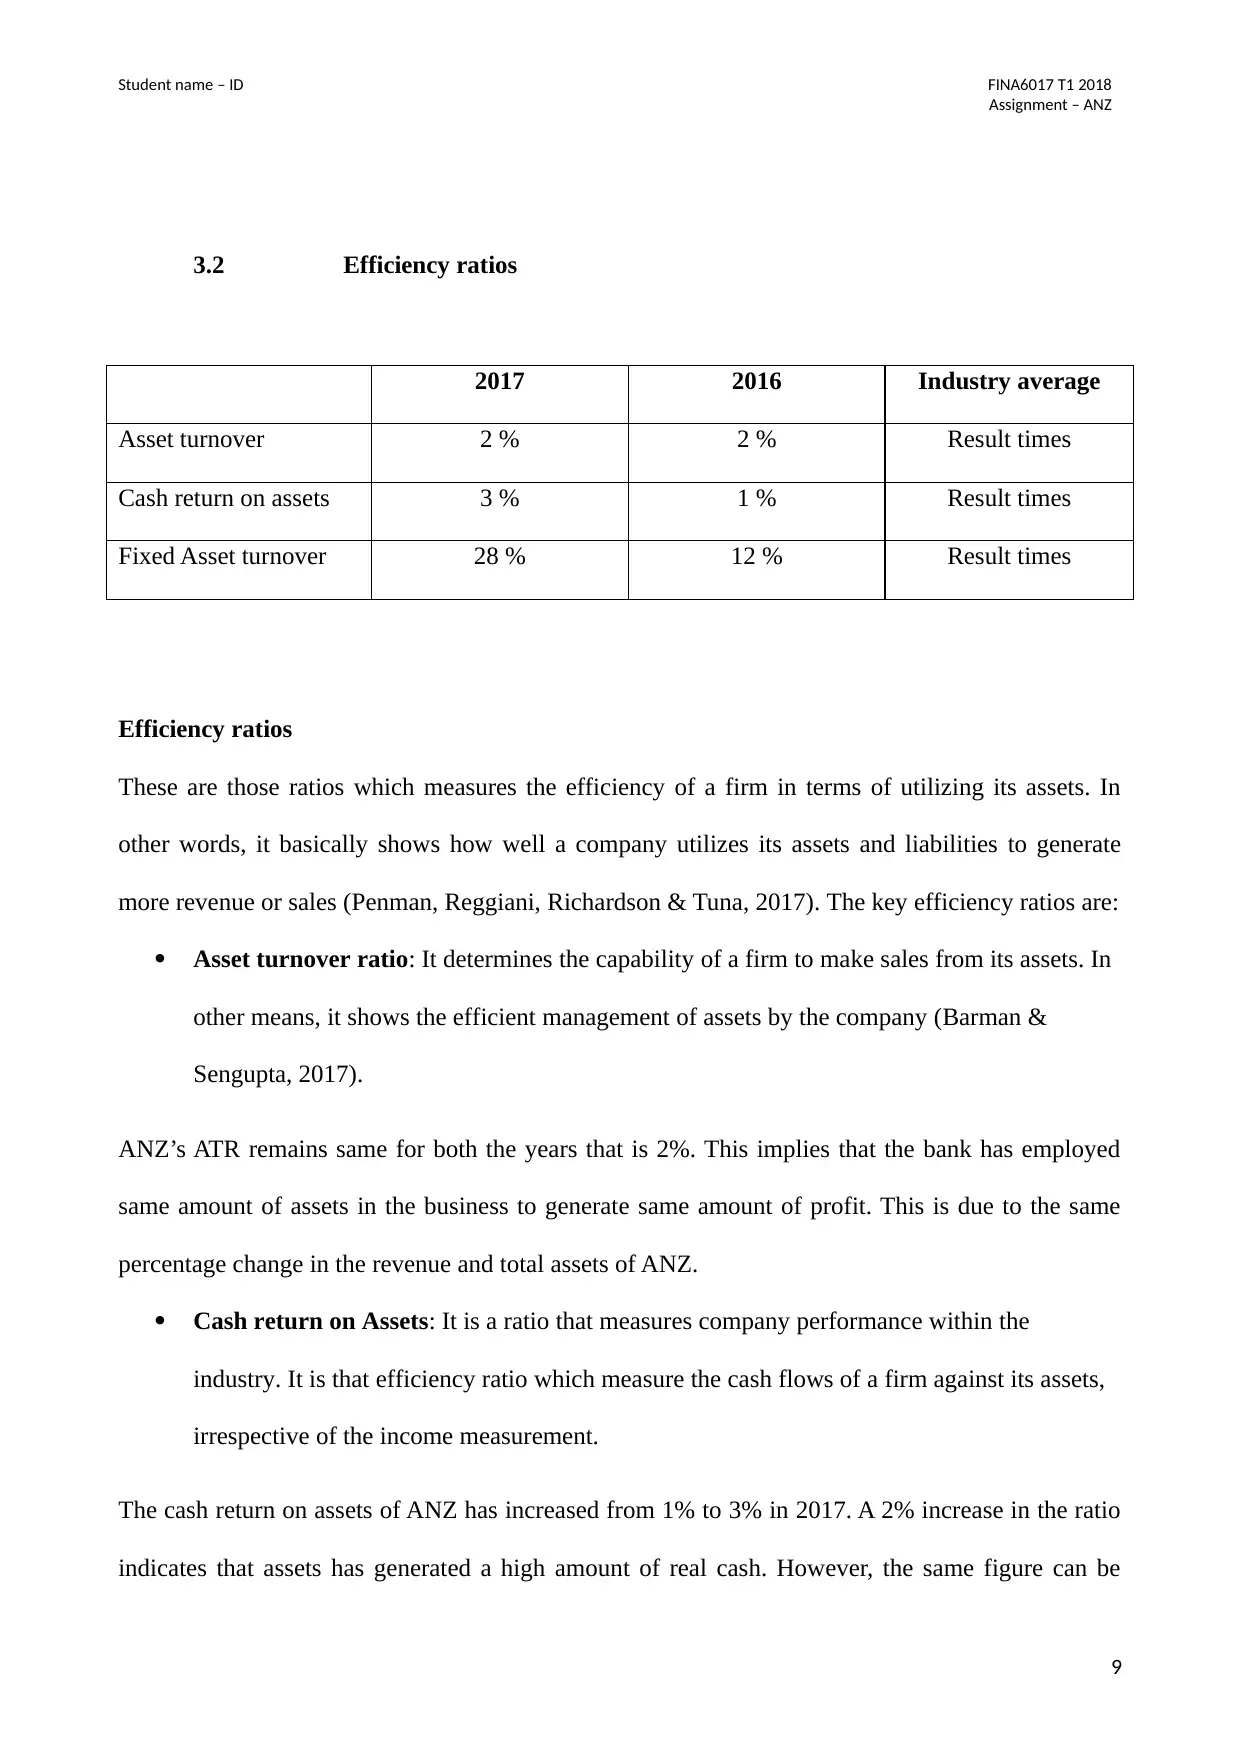
3.2 Efficiency ratios
2017 2016 Industry average
Asset turnover 2 % 2 % Result times
Cash return on assets 3 % 1 % Result times
Fixed Asset turnover 28 % 12 % Result times
Efficiency ratios
These are those ratios which measures the efficiency of a firm in terms of utilizing its assets. In
other words, it basically shows how well a company utilizes its assets and liabilities to generate
more revenue or sales (Penman, Reggiani, Richardson & Tuna, 2017). The key efficiency ratios are:
Asset turnover ratio: It determines the capability of a firm to make sales from its assets. In
other means, it shows the efficient management of assets by the company (Barman &
Sengupta, 2017).
ANZ’s ATR remains same for both the years that is 2%. This implies that the bank has employed
same amount of assets in the business to generate same amount of profit. This is due to the same
percentage change in the revenue and total assets of ANZ.
Cash return on Assets: It is a ratio that measures company performance within the
industry. It is that efficiency ratio which measure the cash flows of a firm against its assets,
irrespective of the income measurement.
The cash return on assets of ANZ has increased from 1% to 3% in 2017. A 2% increase in the ratio
indicates that assets has generated a high amount of real cash. However, the same figure can be
9
Assignment – ANZ
3.2 Efficiency ratios
2017 2016 Industry average
Asset turnover 2 % 2 % Result times
Cash return on assets 3 % 1 % Result times
Fixed Asset turnover 28 % 12 % Result times
Efficiency ratios
These are those ratios which measures the efficiency of a firm in terms of utilizing its assets. In
other words, it basically shows how well a company utilizes its assets and liabilities to generate
more revenue or sales (Penman, Reggiani, Richardson & Tuna, 2017). The key efficiency ratios are:
Asset turnover ratio: It determines the capability of a firm to make sales from its assets. In
other means, it shows the efficient management of assets by the company (Barman &
Sengupta, 2017).
ANZ’s ATR remains same for both the years that is 2%. This implies that the bank has employed
same amount of assets in the business to generate same amount of profit. This is due to the same
percentage change in the revenue and total assets of ANZ.
Cash return on Assets: It is a ratio that measures company performance within the
industry. It is that efficiency ratio which measure the cash flows of a firm against its assets,
irrespective of the income measurement.
The cash return on assets of ANZ has increased from 1% to 3% in 2017. A 2% increase in the ratio
indicates that assets has generated a high amount of real cash. However, the same figure can be
9
Paraphrase This Document
Need a fresh take? Get an instant paraphrase of this document with our AI Paraphraser
Student name – ID FINA6017 T1 2018
Assignment – ANZ
different when return on assets formula is applied.
Fixed assets turnover: It shows the amount of sales made by a firm by using its fixed assets
(Camilleri & Camilleri, 2017).
From the calculation done, it was observed that the FATR of ANZ has increased to a great extent in
2017. In 2016, the ratio was 12% and the same rises to 28% in 2017. This indicates that the bank
has less money tied up in fixed assets. The ratio was more than double, making ANZ more efficient.
3.3 Liquidity ratios
2017 2016 Industry average
Current ratio 106% 123% XX:1
Liquidity ratios
These ratios reflects the financial health of a company and tells about its liquidity position. The
main liquidity ratios include current ratio and quick ratio. Both the ratios are used to measure the
capability of the company to meet its short term obligations.
Current ratio
It measure the potential of an enterprise in paying off its current liabilities with use of its current
assets. As per the calculations, the ANZ’s CR was 123% in 2016 which falls to 106% in 2017. This
shows a reduction in the capability of a company and also reflects poor financial health. This is due
to the increase in the borrowings of the bank worth $595,611 million.
3.4 Gearing ratios
10
Student name – ID FINA6017 T1 2018
Assignment – ANZ
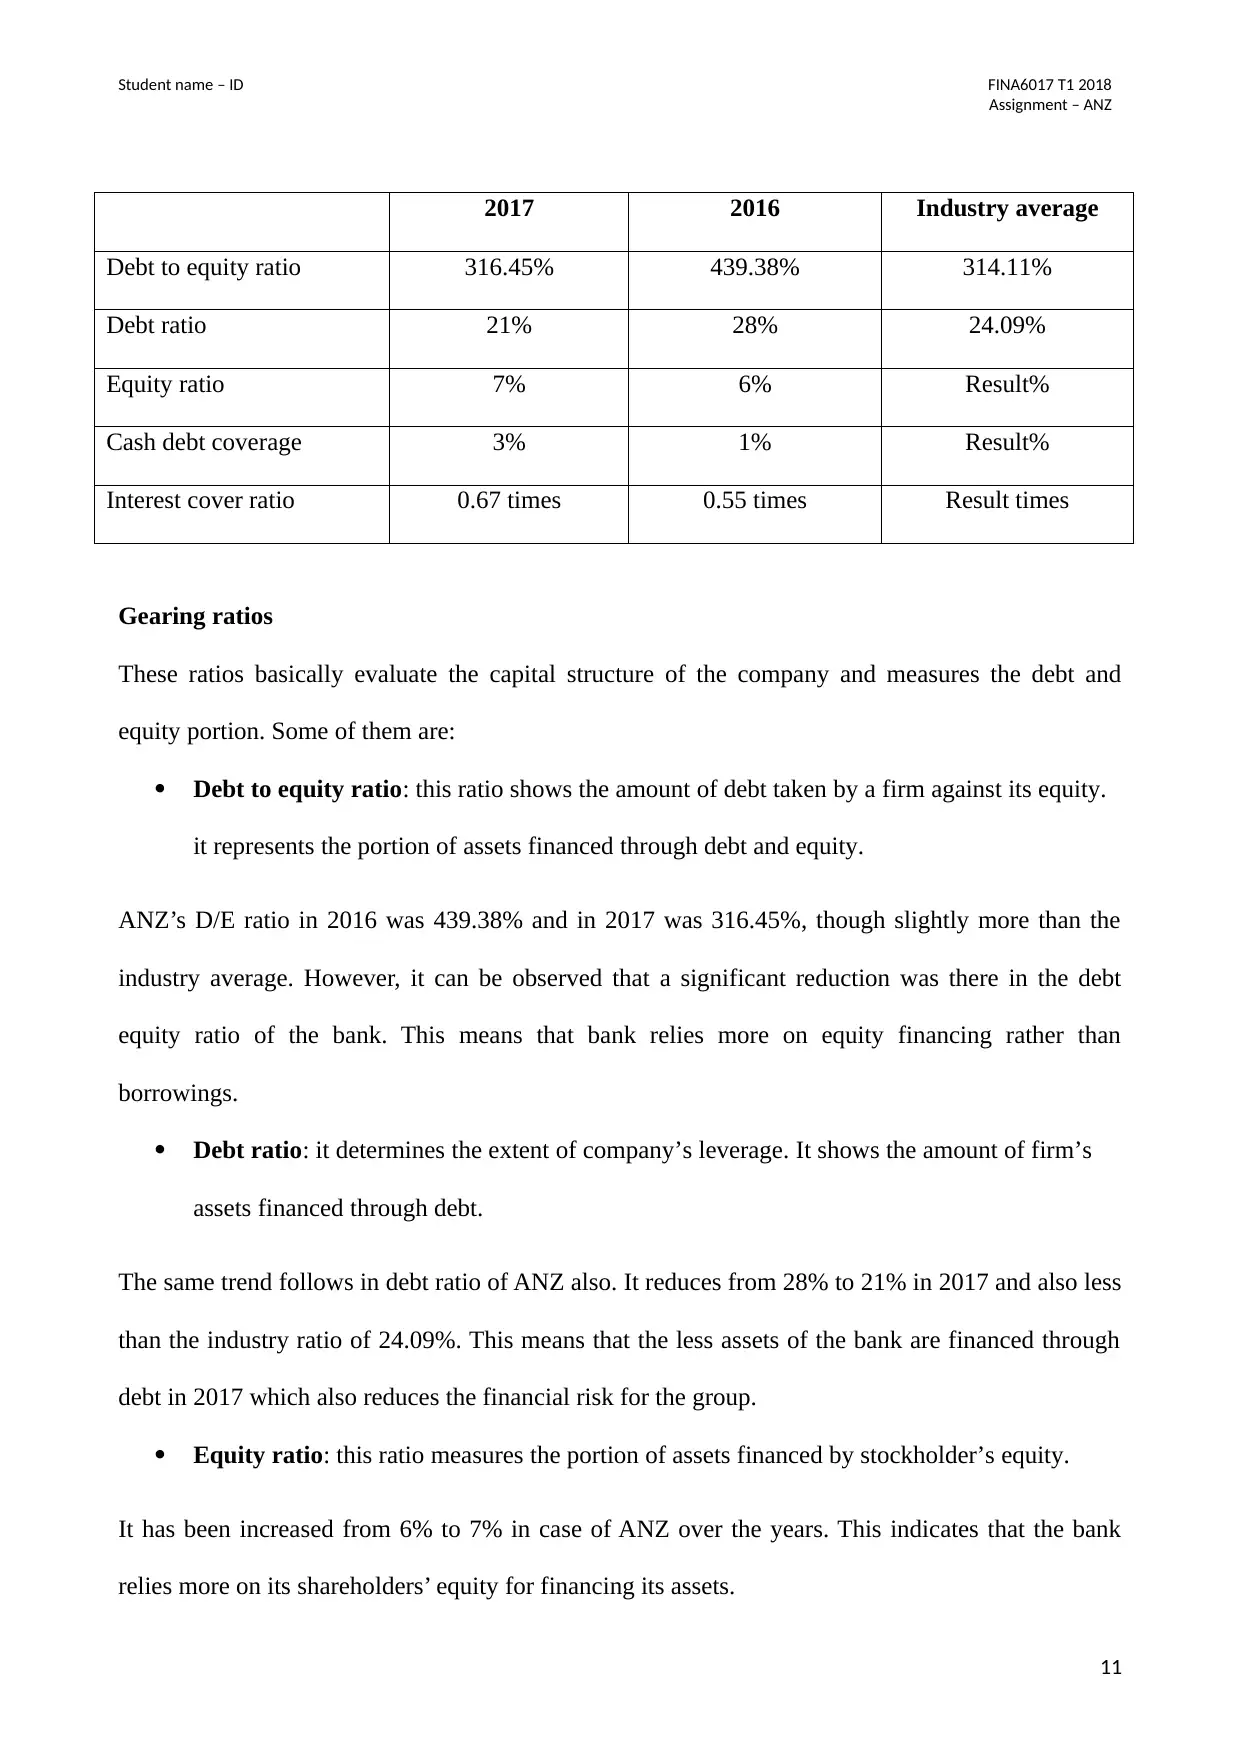
2017 2016 Industry average
Debt to equity ratio 316.45% 439.38% 314.11%
Debt ratio 21% 28% 24.09%
Equity ratio 7% 6% Result%
Cash debt coverage 3% 1% Result%
Interest cover ratio 0.67 times 0.55 times Result times
Gearing ratios
These ratios basically evaluate the capital structure of the company and measures the debt and
equity portion. Some of them are:
Debt to equity ratio: this ratio shows the amount of debt taken by a firm against its equity.
it represents the portion of assets financed through debt and equity.
ANZ’s D/E ratio in 2016 was 439.38% and in 2017 was 316.45%, though slightly more than the
industry average. However, it can be observed that a significant reduction was there in the debt
equity ratio of the bank. This means that bank relies more on equity financing rather than
borrowings.
Debt ratio: it determines the extent of company’s leverage. It shows the amount of firm’s
assets financed through debt.
The same trend follows in debt ratio of ANZ also. It reduces from 28% to 21% in 2017 and also less
than the industry ratio of 24.09%. This means that the less assets of the bank are financed through
debt in 2017 which also reduces the financial risk for the group.
Equity ratio: this ratio measures the portion of assets financed by stockholder’s equity.
It has been increased from 6% to 7% in case of ANZ over the years. This indicates that the bank
relies more on its shareholders’ equity for financing its assets.
11
Assignment – ANZ
2017 2016 Industry average
Debt to equity ratio 316.45% 439.38% 314.11%
Debt ratio 21% 28% 24.09%
Equity ratio 7% 6% Result%
Cash debt coverage 3% 1% Result%
Interest cover ratio 0.67 times 0.55 times Result times
Gearing ratios
These ratios basically evaluate the capital structure of the company and measures the debt and
equity portion. Some of them are:
Debt to equity ratio: this ratio shows the amount of debt taken by a firm against its equity.
it represents the portion of assets financed through debt and equity.
ANZ’s D/E ratio in 2016 was 439.38% and in 2017 was 316.45%, though slightly more than the
industry average. However, it can be observed that a significant reduction was there in the debt
equity ratio of the bank. This means that bank relies more on equity financing rather than
borrowings.
Debt ratio: it determines the extent of company’s leverage. It shows the amount of firm’s
assets financed through debt.
The same trend follows in debt ratio of ANZ also. It reduces from 28% to 21% in 2017 and also less
than the industry ratio of 24.09%. This means that the less assets of the bank are financed through
debt in 2017 which also reduces the financial risk for the group.
Equity ratio: this ratio measures the portion of assets financed by stockholder’s equity.
It has been increased from 6% to 7% in case of ANZ over the years. This indicates that the bank
relies more on its shareholders’ equity for financing its assets.
11
⊘ This is a preview!⊘
Do you want full access?
Subscribe today to unlock all pages.
Trusted by 1+ million students worldwide
1 out of 16
Related Documents


Your All-in-One AI-Powered Toolkit for Academic Success.
+13062052269
info@desklib.com
Available 24*7 on WhatsApp / Email
![[object Object]](/_next/static/media/star-bottom.7253800d.svg)
Unlock your academic potential
Copyright © 2020–2026 A2Z Services. All Rights Reserved. Developed and managed by ZUCOL.