ACC10707 Business Analysis: Comparing A.P. Eagers & AHG Ltd

Verified

Added on  2023/04/21

|8
|1852
|436
Report
AI Summary
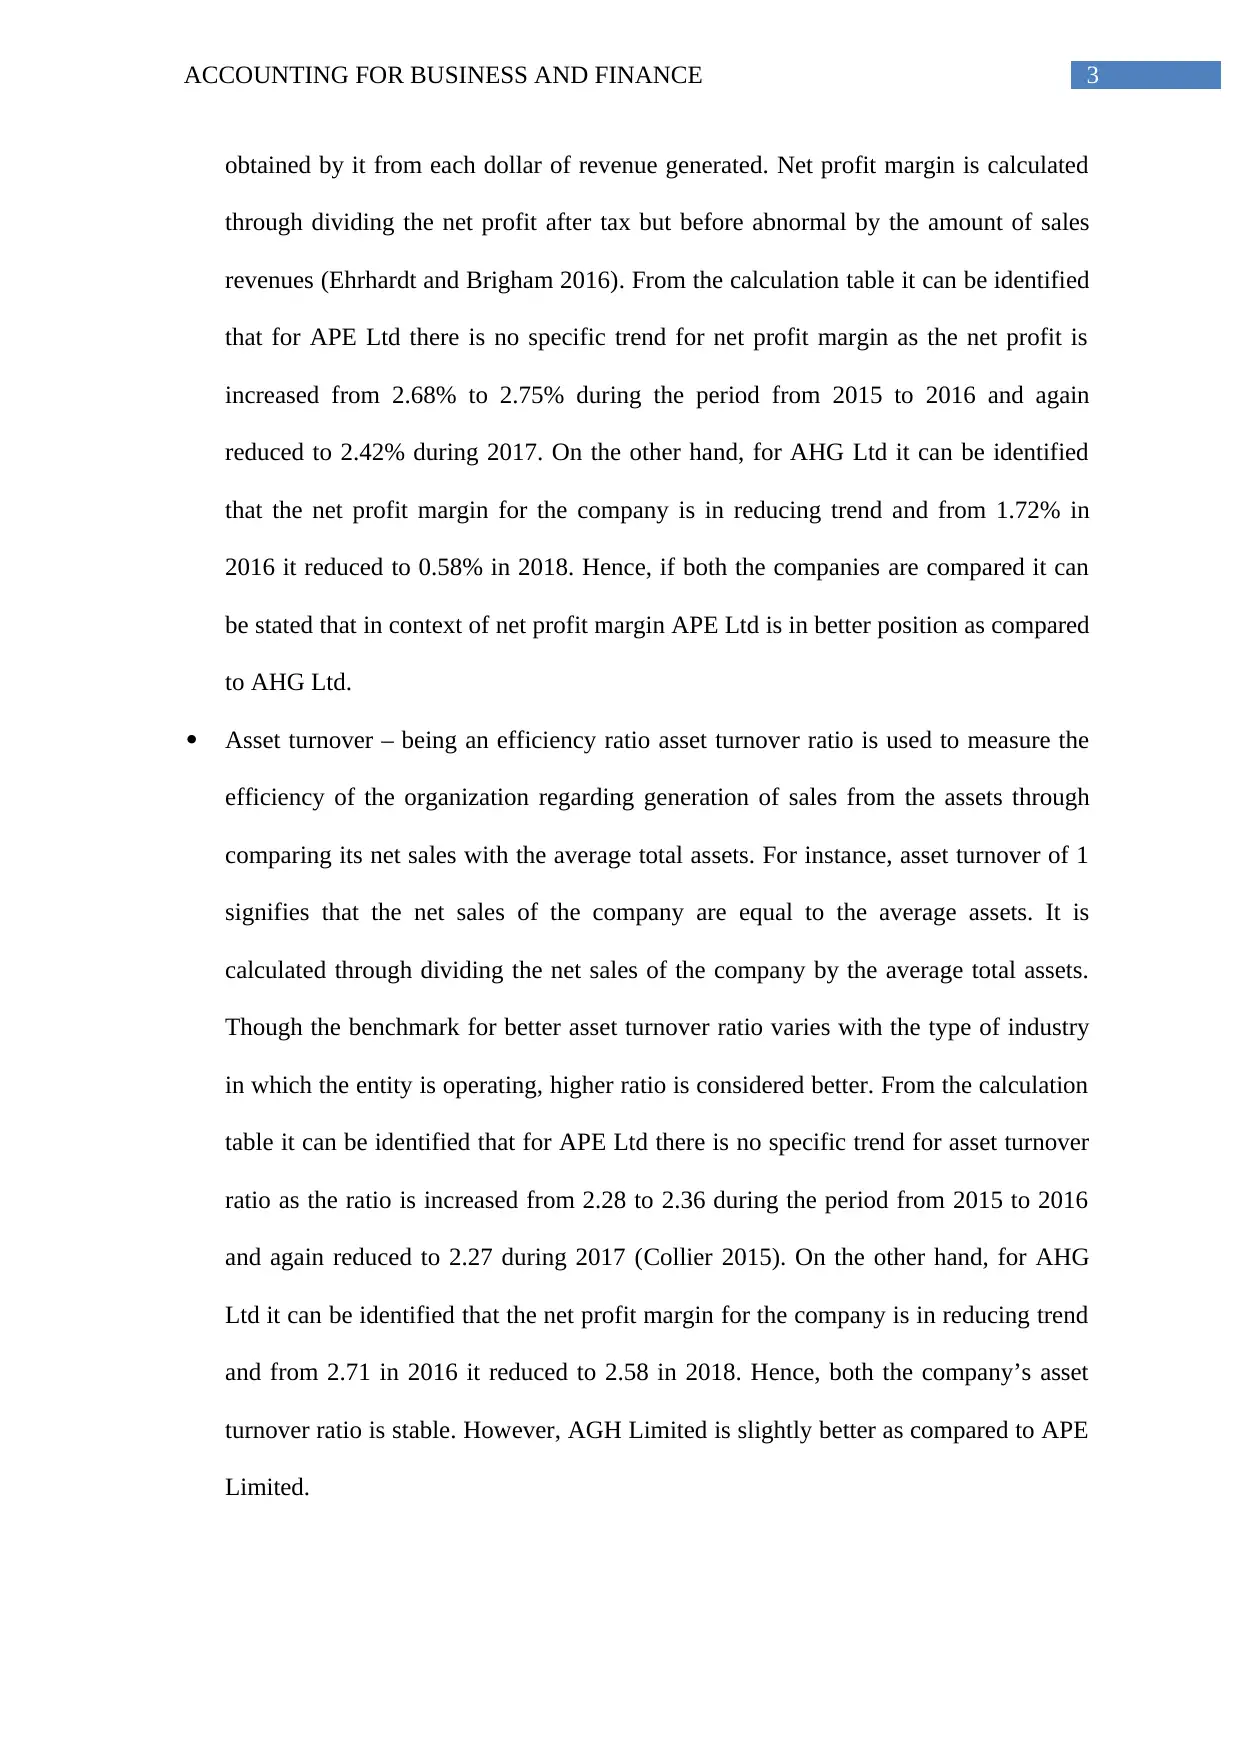
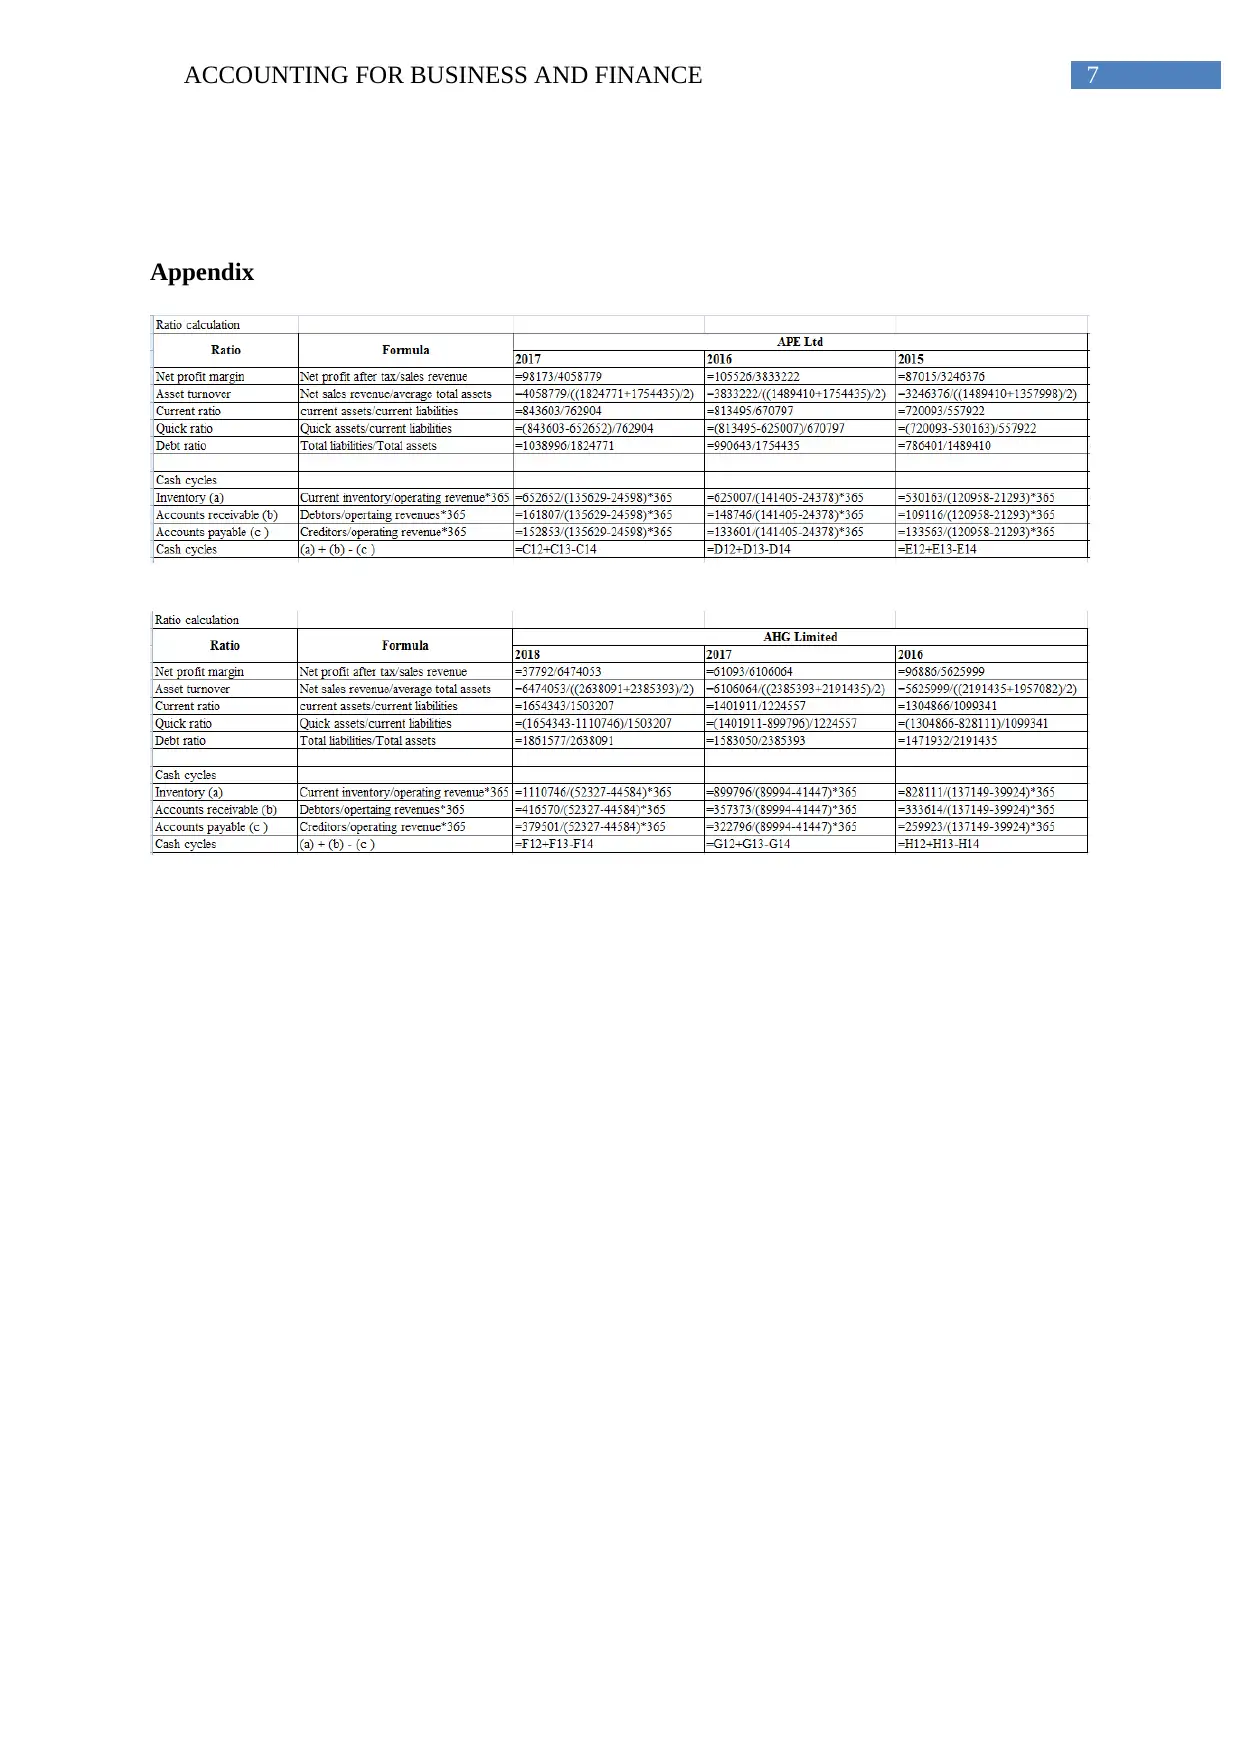
This report provides a comparative financial analysis of A.P. Eagers Limited (APE) and Automotive Holdings Group Limited (AHG) using key financial ratios such as net profit margin, asset turnover, current ratio, quick ratio, debt ratio, and cash cycle. The analysis covers the period of 2016-2018, examining trends and relative performance. APE Ltd demonstrates a more stable net profit margin and better debt ratio compared to AHG Ltd, while AHG Ltd shows a slightly better asset turnover ratio. Both companies exhibit declining trends in current and quick ratios, indicating potential liquidity concerns. The cash cycle analysis reveals significant deterioration for both companies, with APE Ltd showing comparatively better performance. The report concludes that while both companies' performance has deteriorated over the years, APE Ltd's overall performance is better than AHG Ltd's. Recommendations are made for APE Limited to improve its liquidity position and cash cycles.
Document Page
Running head: ACCOUNTING FOR BUSINESS AND FINANCE
Accounting for business and finance
Student Name
Student ID No
Unit name
Unit code
Tutor’s name
Assignment no
Assignment title
Due date
Date submitted
Declaration
I have read and understand the Rules Relating to Awards (Rule 3 Section 18 – Academic
Misconduct Including Plagiarism) as contained in the SCU Policy Library. I understand the
penalties that apply for plagiarism and agree to be bound by these rules. The work I am
submitting electronically is entirely my own work
Signed:
Date:
tabler-icon-diamond-filled.svg

Paraphrase This Document

Need a fresh take? Get an instant paraphrase of this document with our AI Paraphraser
Document Page
1ACCOUNTING FOR BUSINESS AND FINANCE
Table of Contents
Introduction................................................................................................................................2
Discussion..................................................................................................................................2
Ratio analysis.............................................................................................................................2
Conclusion..................................................................................................................................5
Reference....................................................................................................................................6
Appendix....................................................................................................................................7
Document Page
2ACCOUNTING FOR BUSINESS AND FINANCE
Introduction
The aim of the report is to compare the financial performance of A.P. Eagers Limited
(APE) Ltd and comparing it with its competitor Automotive Holdings Group Limited (AHG)
Ltd. Performance of the companies will be compared through computing various ratios like
net profit margin, debt ratio, current and quick ratio, assets turnover and cash cycles. A.P.
Eagers is the oldest automotive retail group listed in Australia. Major activities of the
company includes sale and distribution of the accessories, parts, servicing and repair of
vehicles, car care products, provision of the extended warranties, leasing of motor vehicles
and ownership of the investments and properties (AP Eagers 2019). On the other hand, its
competitor Automotive Holdings Group Limited is engaged in automotive logistics and retail
businesses. It offers passenger vehicles from various brands that include Bentley, Audi,
Chrysler, Fiat, Holden, Ford, Honda, Kia, Hyundai, Mazda, Mitsubishi, Porsche and others
(Ahgir.com.au 2019).
Discussion
Ratio analysis
Once the financial statement of any entity is prepared it needs to be analyzed through
using various tools like ratio analysis. It assists the shareholders in making better decisions
with better sense of the accounts and better understanding of the company’s fiscal position
(Damodaran 2016). Various ratios conducted for comparing the performance APE Ltd with
its competitor AHG Ltd of and their interpretations are as follows –
Net profit margin – it is the profitability ratio used for measuring the percentage of
profit generated by an entity from its sales revenues. It computes the net profit amount
Document Page
3ACCOUNTING FOR BUSINESS AND FINANCE
obtained by it from each dollar of revenue generated. Net profit margin is calculated
through dividing the net profit after tax but before abnormal by the amount of sales
revenues (Ehrhardt and Brigham 2016). From the calculation table it can be identified
that for APE Ltd there is no specific trend for net profit margin as the net profit is
increased from 2.68% to 2.75% during the period from 2015 to 2016 and again
reduced to 2.42% during 2017. On the other hand, for AHG Ltd it can be identified
that the net profit margin for the company is in reducing trend and from 1.72% in
2016 it reduced to 0.58% in 2018. Hence, if both the companies are compared it can
be stated that in context of net profit margin APE Ltd is in better position as compared
to AHG Ltd.
Asset turnover – being an efficiency ratio asset turnover ratio is used to measure the
efficiency of the organization regarding generation of sales from the assets through
comparing its net sales with the average total assets. For instance, asset turnover of 1
signifies that the net sales of the company are equal to the average assets. It is
calculated through dividing the net sales of the company by the average total assets.
Though the benchmark for better asset turnover ratio varies with the type of industry
in which the entity is operating, higher ratio is considered better. From the calculation
table it can be identified that for APE Ltd there is no specific trend for asset turnover
ratio as the ratio is increased from 2.28 to 2.36 during the period from 2015 to 2016
and again reduced to 2.27 during 2017 (Collier 2015). On the other hand, for AHG
Ltd it can be identified that the net profit margin for the company is in reducing trend
and from 2.71 in 2016 it reduced to 2.58 in 2018. Hence, both the company’s asset
turnover ratio is stable. However, AGH Limited is slightly better as compared to APE
Limited.
tabler-icon-diamond-filled.svg

Paraphrase This Document

Need a fresh take? Get an instant paraphrase of this document with our AI Paraphraser
Document Page
4ACCOUNTING FOR BUSINESS AND FINANCE
Current ratio – current ratio is one of the major liquidity ratio used for measuring the
liquidity position of the entity that is the ability to pay off the short term obligations
with the short term assets available with it. To be more specific the current ratio is
focussed on the solvency of business. If the business finds it difficult to meet its debt
obligation when they become due it will probably heads towards insolvency (Amran
and Aripin 2015). It is calculated through dividing the current assets by the current
liabilities. Generally the current ratio ranging between 1.0 and 3.0 is considered good
for the business that indicates that the business has sufficient liquid assets to pay off
the debts. Looking into the calculation table it can be identified that current ratio of
APE Ltd were in reducing and the ratio is reduced from 1.29 to 1.11 over the period
from 2015 to 2017 (Greco, Figueira and Ehrgott 2016). On the other hand, for AHG
Ltd it can be identified that the same for it also are in reducing trend and from 1.19 to
1.10 over the years from 2016 to 2018. Hence, both the companies are able to meet its
debt obligation with the available liquid assets. However, the liquidity position of
APE Limited is slightly better as compared to AGH Limited
Quick ratio – quick ratio that is also known as the acid-test ratio is used for measuring
the ability of the organization to pay off the short term obligations. It is considered as
more conservative as compared to current ratio as when the ability is measured it does
not consider the assets that takes some times in converting into cash like inventories.
Generally the quick ratio of more than 1.0 is considered good for the business that
indicates that the business can meet debt obligation efficiently. Both the companies
quick ratio is in reducing trend and indication that the quick assets are not sufficient to
pay off the debt obligations (Gitman, Juchau and Flanagan 2015). However, if both
the company’s position are compared it can be stated that AHG Ltd is slightly better
positioned as compared to APE Ltd as the quick ratio of APE Ltd is reduced from
Document Page
5ACCOUNTING FOR BUSINESS AND FINANCE
0.34 to 0.25 whereas the same for AHG Ltd is reduced from 0.43 to 0.36 over the
period under consideration.
Debt ratio – it is the solvency ratio that measures the entity’s total liabilities as
compared to the total asset. Generally, the ratio of 0.40 or lower is considered good
for any business. Both the company’s debt ratio is deteriorated over the years as for
APE Ltd it is increased from 0.53 to 0.57 and for AHG Ltd it is increased from 0.67
to 0.71 (Brigham et al. 2016). However, if both the company’s position are compared
it can be stated that APE Ltd is slightly better positioned as compared to AHG Ltd.
Cash cycle – cash cycle is the time taken by the entity to convert its raw materials into
cash. To be more specific, it is the time between purchases of raw material to time for
collecting the money through sales of the product. It can be identified that cash cycle
for both both the companies has been deteriorated (Edwards, Schwab and Shevlin
2015). For APE Ltd it is increased from 1852.07 days to 2174.94 days whereas for
AHG Ltd it is significantly increased from 3385.53 days to 54107.25 days. Hence,
APE Ltd is in better position
Conclusion and recommendation
It is concluded from the above analysis of both the company’s performance for the
period under consideration it can be stated that performance of both the companies over the
years have been deteriorated. However, if both are compared it can be stated that the over
performance of APE Ltd is better as compared to its competitor AHG Ltd. However, it is
recommended to APE Limited that to increase the liquidity position it must pay off the debt
obligations and to improve the cash cycles it shall allow short credit terms to its debtors and
ask for more credit terms from its creditors.
Document Page
6ACCOUNTING FOR BUSINESS AND FINANCE
Reference
Ahgir.com.au., 2019. Corporate & Investor Information | AHG Limited. [online] Available
at: http://www.ahgir.com.au/ [Accessed 5 Jan. 2019].
Amran, N.A. and Aripin, N., 2015. Financial ratios: A tool for conveying information and
decision making. Global Review of Accounting and Finance, 6(1), pp.151-164.
AP Eagers., 2019. A.P. Eagers Limited | Automotive Group | Australia. [online] Available at:
https://www.apeagers.com.au/ [Accessed 5 Jan. 2019].
Brigham, E.F., Ehrhardt, M.C., Nason, R.R. and Gessaroli, J., 2016. Financial Managment:
Theory And Practice, Canadian Edition. Nelson Education.
Collier, P.M., 2015. Accounting for managers: Interpreting accounting information for
decision making. John Wiley & Sons.
Damodaran, A., 2016. Damodaran on valuation: security analysis for investment and
corporate finance (Vol. 324). John Wiley & Sons.
Edwards, A., Schwab, C. and Shevlin, T., 2015. Financial constraints and cash tax
savings. The Accounting Review, 91(3), pp.859-881.
Ehrhardt, M.C. and Brigham, E.F., 2016. Corporate finance: A focused approach. Cengage
learning.
Gitman, L.J., Juchau, R. and Flanagan, J., 2015. Principles of managerial finance. Pearson
Higher Education AU.
Greco, S., Figueira, J. and Ehrgott, M., 2016. Multiple criteria decision analysis. New York:
Springer.
tabler-icon-diamond-filled.svg

Paraphrase This Document

Need a fresh take? Get an instant paraphrase of this document with our AI Paraphraser
Document Page
7ACCOUNTING FOR BUSINESS AND FINANCE
Appendix
chevron_up_icon
1 out of 8
circle_padding
hide_on_mobile
zoom_out_icon
[object Object]