Comprehensive Financial Analysis and HR Dashboard Report
VerifiedAdded on 2023/01/05
|18
|4841
|29
Report
AI Summary
This report offers a detailed financial analysis of Apple Inc., including vertical, horizontal, and ratio analyses covering the years 2017-2020. It assesses the company's revenue, cost of sales, profitability, assets, and liabilities. The analysis reveals trends in sales, gross profit, net profit, and asset utilization. Additionally, the report includes an HR dashboard analysis, examining absenteeism, gender distribution, and net pay trends within the company. The HR analysis identifies potential issues such as gender inequality in recruitment. Furthermore, the report discusses performance management at Vitality Health Enterprises, Inc., proposes solutions to HR problems, and analyzes HR investment opportunities. The overall financial position of Apple is assessed as moderate, with recommendations for future improvements, while the HR analysis highlights areas for enhancing employee satisfaction and equality.

Financial
Management
Management
Paraphrase This Document
Need a fresh take? Get an instant paraphrase of this document with our AI Paraphraser
TABLE OF CONTENTS
1. Introduction to the financial position of Apple Inc................................................................3
Vertical analysis.....................................................................................................................3
Horizontal analysis.................................................................................................................4
Ratio analysis.........................................................................................................................5
2. HR dashboard.........................................................................................................................8
3. Performance Management at Vitality Health Enterprises, Inc.............................................11
4. HR problem and Solution.....................................................................................................12
5. HR investment analysis........................................................................................................14
REFERENCES.........................................................................................................................16
APPENDIX..............................................................................................................................17
1. Introduction to the financial position of Apple Inc.
Vertical analysis
Vertical Analysis (All values USD Millions)
2020 2019 2018 2017
Revenue 2,74,515 100% 2,59,968 100% 2,65,809 100% 2,28,572 100%
Cost of Sales 1,69,559 62% 1,62,264 62% 1,63,826 62% 1,41,702 62%
Gross Profit 1,04,956 38% 97,704 38% 1,01,983 38% 86,870 38%
SG&A Expense 38,668 14% 34,462 13% 30,941 12% 26,842 12%
EBIT 66,288 24% 63,242 24% 71,042 27% 60,028 26%
Tax 8,877 3% 7,986 3% 11,511 4% 11,677 5%
Profit after tax 57411 21% 55256 21% 59531 22% 48351 21%
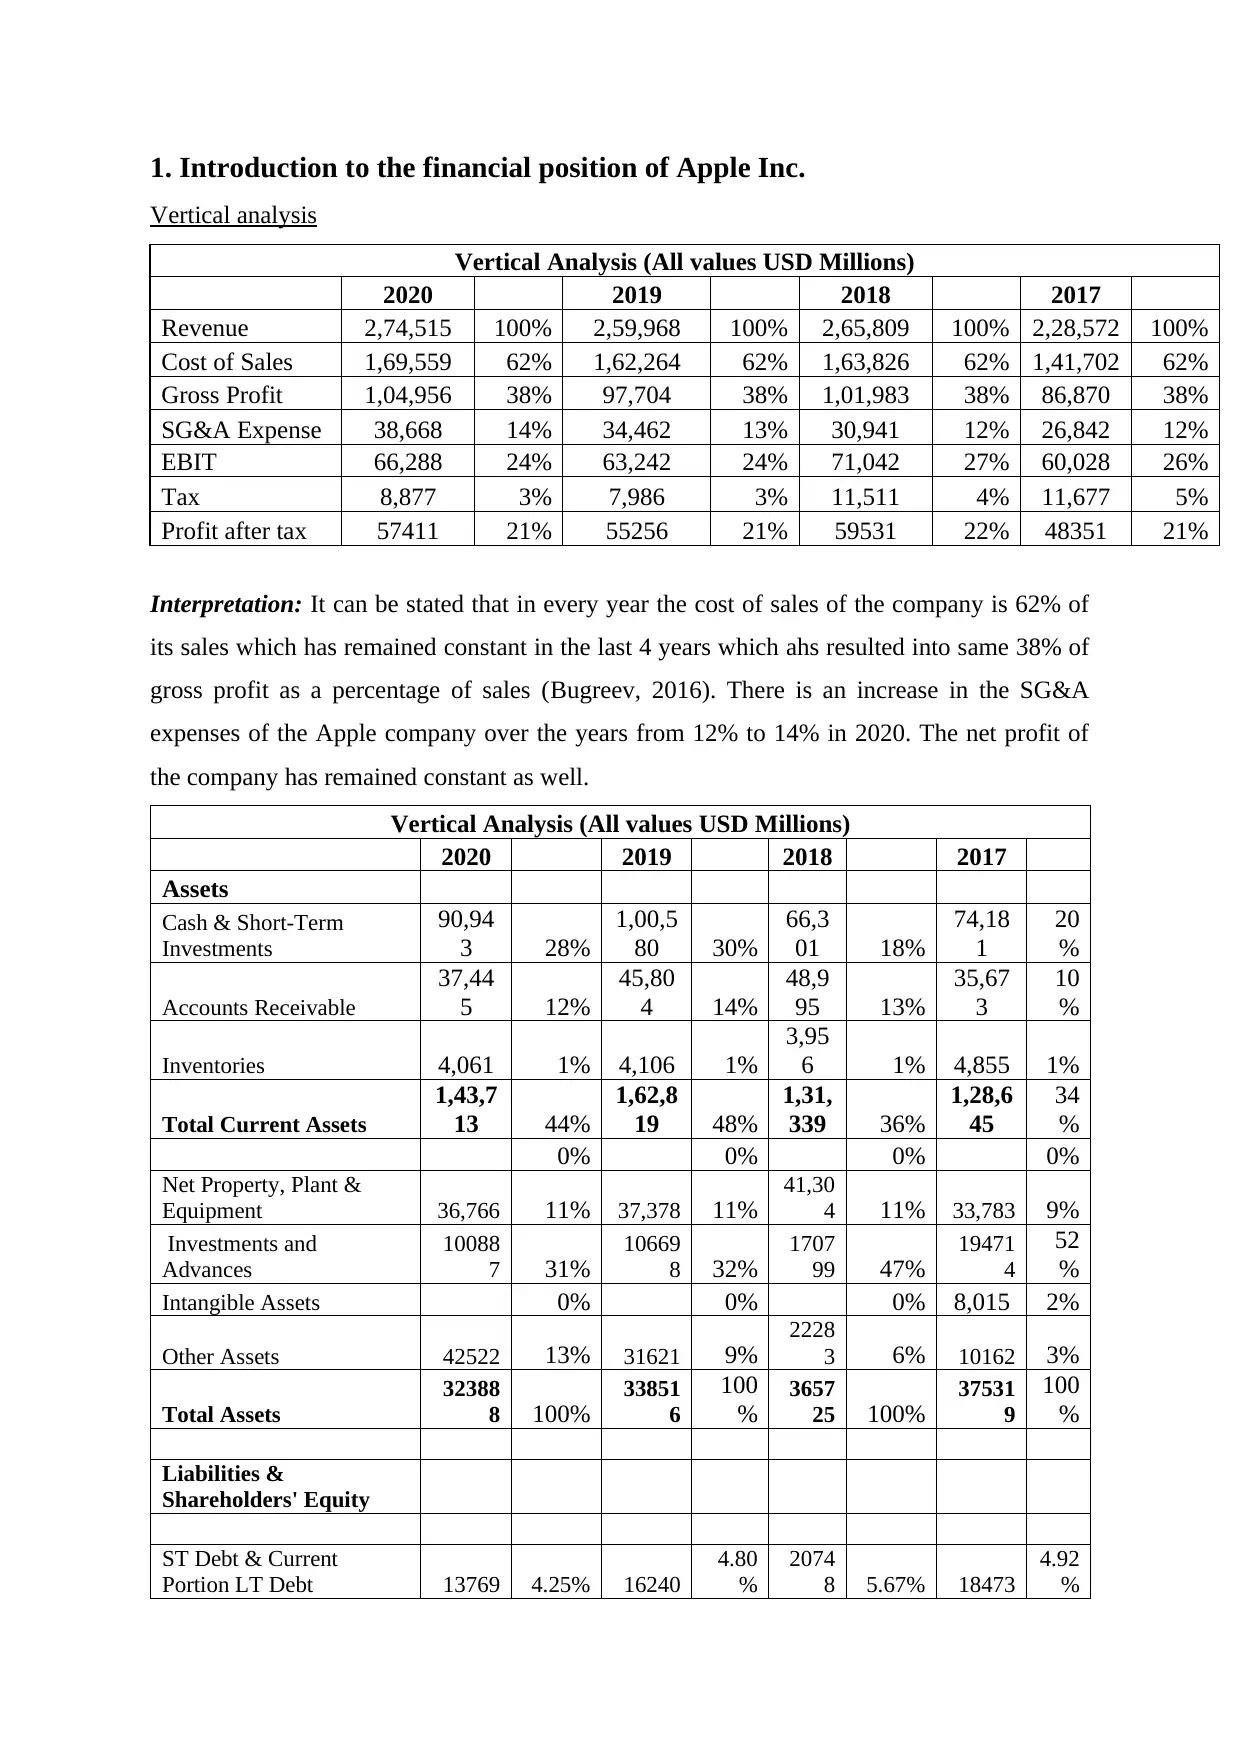
Interpretation: It can be stated that in every year the cost of sales of the company is 62% of
its sales which has remained constant in the last 4 years which ahs resulted into same 38% of
gross profit as a percentage of sales (Bugreev, 2016). There is an increase in the SG&A
expenses of the Apple company over the years from 12% to 14% in 2020. The net profit of
the company has remained constant as well.
Vertical Analysis (All values USD Millions)
2020 2019 2018 2017
Assets
Cash & Short-Term
Investments
90,94
3 28%
1,00,5
80 30%
66,3
01 18%
74,18
1
20
%
Accounts Receivable
37,44
5 12%
45,80
4 14%
48,9
95 13%
35,67
3
10
%
Inventories 4,061 1% 4,106 1%
3,95
6 1% 4,855 1%
Total Current Assets
1,43,7
13 44%
1,62,8
19 48%
1,31,
339 36%
1,28,6
45
34
%
0% 0% 0% 0%
Net Property, Plant &
Equipment 36,766 11% 37,378 11%
41,30
4 11% 33,783 9%
Investments and
Advances
10088
7 31%
10669
8 32%
1707
99 47%
19471
4
52
%
Intangible Assets 0% 0% 0% 8,015 2%
Other Assets 42522 13% 31621 9%
2228
3 6% 10162 3%
Total Assets
32388
8 100%
33851
6
100
%
3657
25 100%
37531
9
100
%
Liabilities &
Shareholders' Equity
ST Debt & Current
Portion LT Debt 13769 4.25% 16240
4.80
%
2074
8 5.67% 18473
4.92
%
Vertical analysis
Vertical Analysis (All values USD Millions)
2020 2019 2018 2017
Revenue 2,74,515 100% 2,59,968 100% 2,65,809 100% 2,28,572 100%
Cost of Sales 1,69,559 62% 1,62,264 62% 1,63,826 62% 1,41,702 62%
Gross Profit 1,04,956 38% 97,704 38% 1,01,983 38% 86,870 38%
SG&A Expense 38,668 14% 34,462 13% 30,941 12% 26,842 12%
EBIT 66,288 24% 63,242 24% 71,042 27% 60,028 26%
Tax 8,877 3% 7,986 3% 11,511 4% 11,677 5%
Profit after tax 57411 21% 55256 21% 59531 22% 48351 21%
Interpretation: It can be stated that in every year the cost of sales of the company is 62% of
its sales which has remained constant in the last 4 years which ahs resulted into same 38% of
gross profit as a percentage of sales (Bugreev, 2016). There is an increase in the SG&A
expenses of the Apple company over the years from 12% to 14% in 2020. The net profit of
the company has remained constant as well.
Vertical Analysis (All values USD Millions)
2020 2019 2018 2017
Assets
Cash & Short-Term
Investments
90,94
3 28%
1,00,5
80 30%
66,3
01 18%
74,18
1
20
%
Accounts Receivable
37,44
5 12%
45,80
4 14%
48,9
95 13%
35,67
3
10
%
Inventories 4,061 1% 4,106 1%
3,95
6 1% 4,855 1%
Total Current Assets
1,43,7
13 44%
1,62,8
19 48%
1,31,
339 36%
1,28,6
45
34
%
0% 0% 0% 0%
Net Property, Plant &
Equipment 36,766 11% 37,378 11%
41,30
4 11% 33,783 9%
Investments and
Advances
10088
7 31%
10669
8 32%
1707
99 47%
19471
4
52
%
Intangible Assets 0% 0% 0% 8,015 2%
Other Assets 42522 13% 31621 9%
2228
3 6% 10162 3%
Total Assets
32388
8 100%
33851
6
100
%
3657
25 100%
37531
9
100
%
Liabilities &
Shareholders' Equity
ST Debt & Current
Portion LT Debt 13769 4.25% 16240
4.80
%
2074
8 5.67% 18473
4.92
%
⊘ This is a preview!⊘
Do you want full access?
Subscribe today to unlock all pages.
Trusted by 1+ million students worldwide
Accounts Payable 42296
13.06
% 46236
13.66
%
5588
8
15.28
% 49049
13.0
7%
Other Current Liabilities 49327
15.23
% 43242
12.77
%
4023
0
11.00
% 33292
8.87
%
Total Current Liabilities
10539
2
32.54
%
10571
8
31.23
%
1168
66
31.95
%
10081
4
26.8
6%
0.00%
0.00
% 0.00%
0.00
%
Long-Term Debt 98667
30.46
% 91807
27.12
%
9373
5
25.63
% 97207
25.9
0%
Provision for Risks &
Charges 0.00% 29545
8.73
%
3358
9 9.18%
0.00
%
Deferred Taxes 0.00% 16919
5.00
%
1152
0 3.15% 39911
10.6
3%
Other Liabilities 54490
16.82
% 4039
1.19
% 71 0.02% 504
0.13
%
Total Liabilities
25854
9
79.83
%
24802
8
73.27
%
2585
78
70.70
%
24127
2
64.2
8%
0.00%
0.00
% 0.00%
0.00
%
Total Shareholders'
Equity 65339
20.17
% 90488
26.73
%
1071
47
29.30
%
13404
7
35.7
2%
0.00%
0.00
% 0.00%
0.00
%
Liabilities &
Shareholders' Equity
32388
8
100.00
%
33851
6
100.0
0%
3657
25 100%
37531
9
100
%
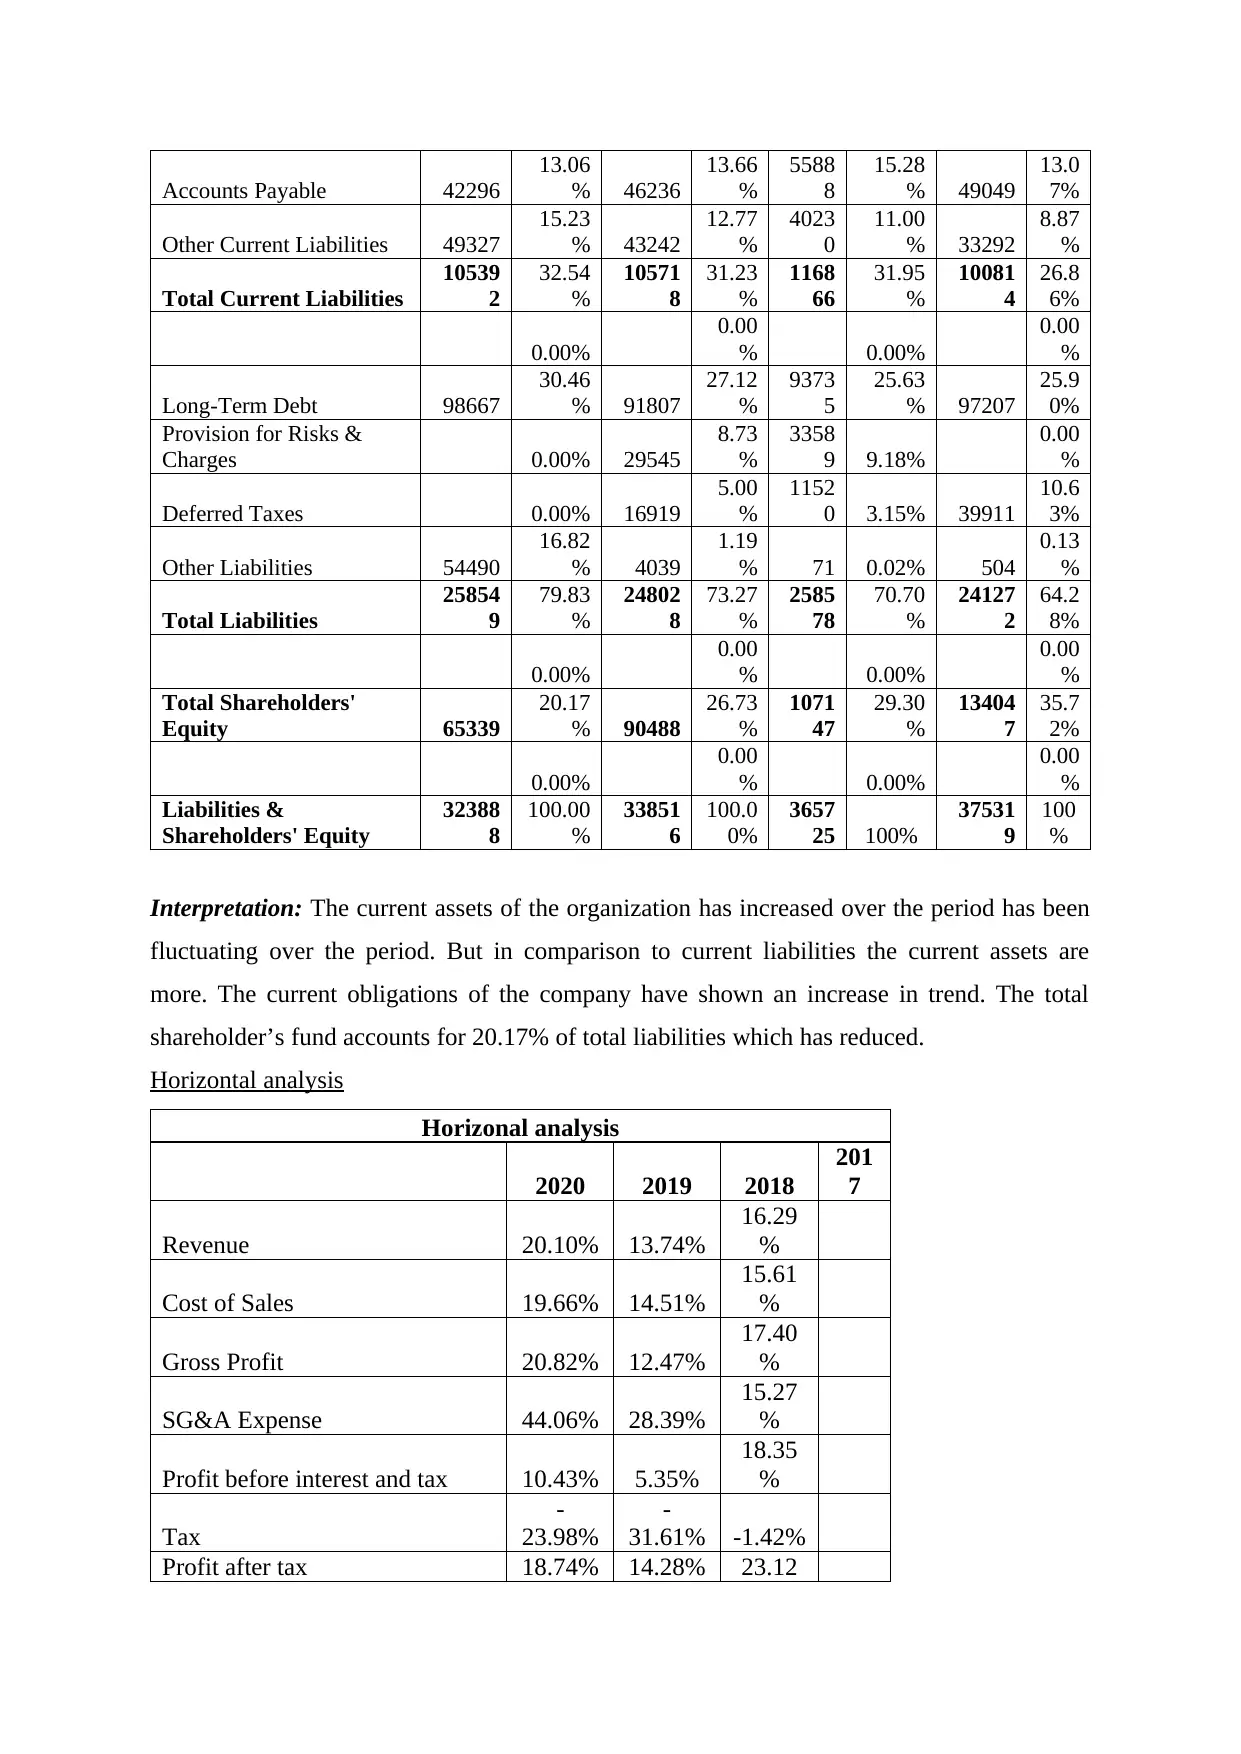
Interpretation: The current assets of the organization has increased over the period has been
fluctuating over the period. But in comparison to current liabilities the current assets are
more. The current obligations of the company have shown an increase in trend. The total
shareholder’s fund accounts for 20.17% of total liabilities which has reduced.
Horizontal analysis
Horizonal analysis
2020 2019 2018
201
7
Revenue 20.10% 13.74%
16.29
%
Cost of Sales 19.66% 14.51%
15.61
%
Gross Profit 20.82% 12.47%
17.40
%
SG&A Expense 44.06% 28.39%
15.27
%
Profit before interest and tax 10.43% 5.35%
18.35
%
Tax
-
23.98%
-
31.61% -1.42%
Profit after tax 18.74% 14.28% 23.12
13.06
% 46236
13.66
%
5588
8
15.28
% 49049
13.0
7%
Other Current Liabilities 49327
15.23
% 43242
12.77
%
4023
0
11.00
% 33292
8.87
%
Total Current Liabilities
10539
2
32.54
%
10571
8
31.23
%
1168
66
31.95
%
10081
4
26.8
6%
0.00%
0.00
% 0.00%
0.00
%
Long-Term Debt 98667
30.46
% 91807
27.12
%
9373
5
25.63
% 97207
25.9
0%
Provision for Risks &
Charges 0.00% 29545
8.73
%
3358
9 9.18%
0.00
%
Deferred Taxes 0.00% 16919
5.00
%
1152
0 3.15% 39911
10.6
3%
Other Liabilities 54490
16.82
% 4039
1.19
% 71 0.02% 504
0.13
%
Total Liabilities
25854
9
79.83
%
24802
8
73.27
%
2585
78
70.70
%
24127
2
64.2
8%
0.00%
0.00
% 0.00%
0.00
%
Total Shareholders'
Equity 65339
20.17
% 90488
26.73
%
1071
47
29.30
%
13404
7
35.7
2%
0.00%
0.00
% 0.00%
0.00
%
Liabilities &
Shareholders' Equity
32388
8
100.00
%
33851
6
100.0
0%
3657
25 100%
37531
9
100
%
Interpretation: The current assets of the organization has increased over the period has been
fluctuating over the period. But in comparison to current liabilities the current assets are
more. The current obligations of the company have shown an increase in trend. The total
shareholder’s fund accounts for 20.17% of total liabilities which has reduced.
Horizontal analysis
Horizonal analysis
2020 2019 2018
201
7
Revenue 20.10% 13.74%
16.29
%
Cost of Sales 19.66% 14.51%
15.61
%
Gross Profit 20.82% 12.47%
17.40
%
SG&A Expense 44.06% 28.39%
15.27
%
Profit before interest and tax 10.43% 5.35%
18.35
%
Tax
-
23.98%
-
31.61% -1.42%
Profit after tax 18.74% 14.28% 23.12
Paraphrase This Document
Need a fresh take? Get an instant paraphrase of this document with our AI Paraphraser
%
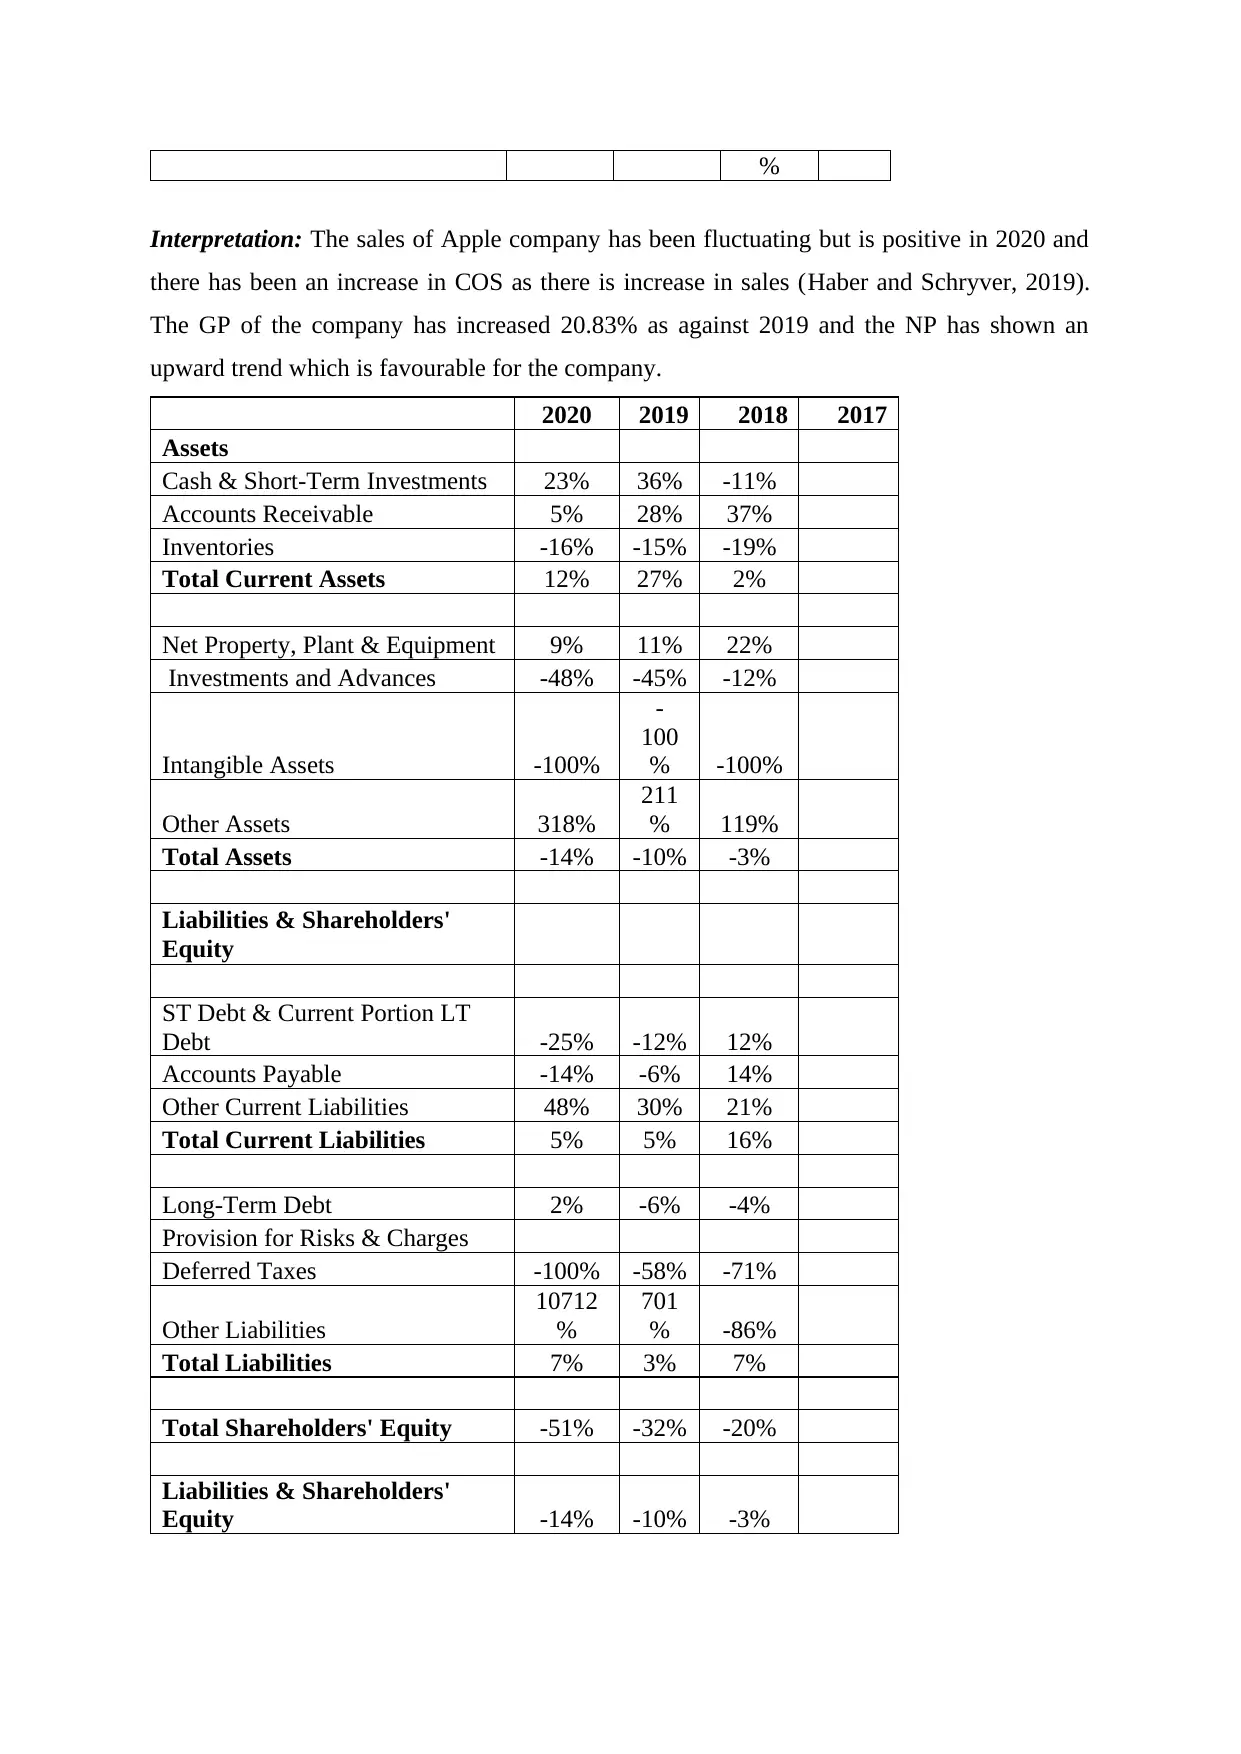
Interpretation: The sales of Apple company has been fluctuating but is positive in 2020 and
there has been an increase in COS as there is increase in sales (Haber and Schryver, 2019).
The GP of the company has increased 20.83% as against 2019 and the NP has shown an
upward trend which is favourable for the company.
2020 2019 2018 2017
Assets
Cash & Short-Term Investments 23% 36% -11%
Accounts Receivable 5% 28% 37%
Inventories -16% -15% -19%
Total Current Assets 12% 27% 2%
Net Property, Plant & Equipment 9% 11% 22%
Investments and Advances -48% -45% -12%
Intangible Assets -100%
-
100
% -100%
Other Assets 318%
211
% 119%
Total Assets -14% -10% -3%
Liabilities & Shareholders'
Equity
ST Debt & Current Portion LT
Debt -25% -12% 12%
Accounts Payable -14% -6% 14%
Other Current Liabilities 48% 30% 21%
Total Current Liabilities 5% 5% 16%
Long-Term Debt 2% -6% -4%
Provision for Risks & Charges
Deferred Taxes -100% -58% -71%
Other Liabilities
10712
%
701
% -86%
Total Liabilities 7% 3% 7%
Total Shareholders' Equity -51% -32% -20%
Liabilities & Shareholders'
Equity -14% -10% -3%
Interpretation: There is huge decline in % change in the current assets of the company in
comparison to the previous year and there is overall a decrease in total assets. The total
liabilities of the company have increased by 7% taking 2017 as the base year.
Ratio analysis
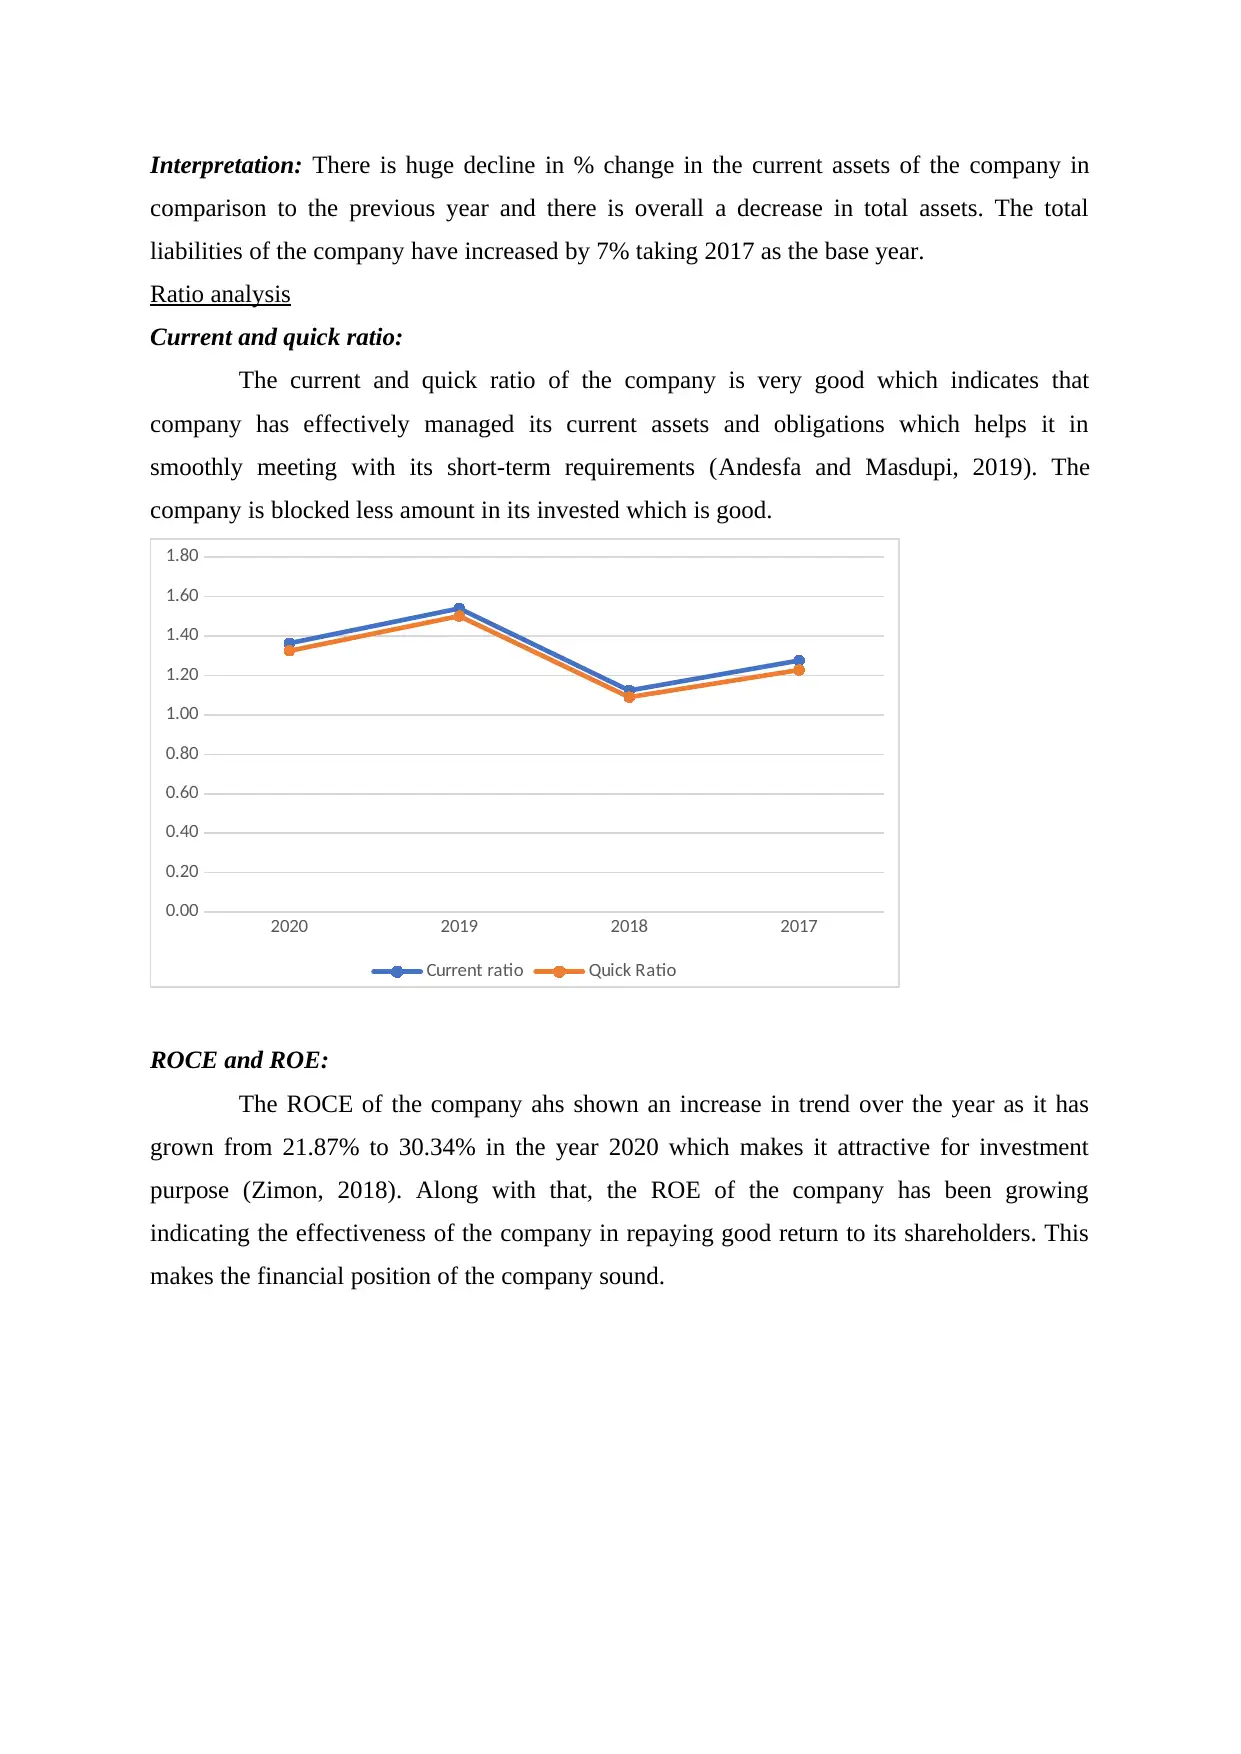
Current and quick ratio:
The current and quick ratio of the company is very good which indicates that
company has effectively managed its current assets and obligations which helps it in
smoothly meeting with its short-term requirements (Andesfa and Masdupi, 2019). The
company is blocked less amount in its invested which is good.
2020 2019 2018 2017
0.00
0.20
0.40
0.60
0.80
1.00
1.20
1.40
1.60
1.80
Current ratio Quick Ratio
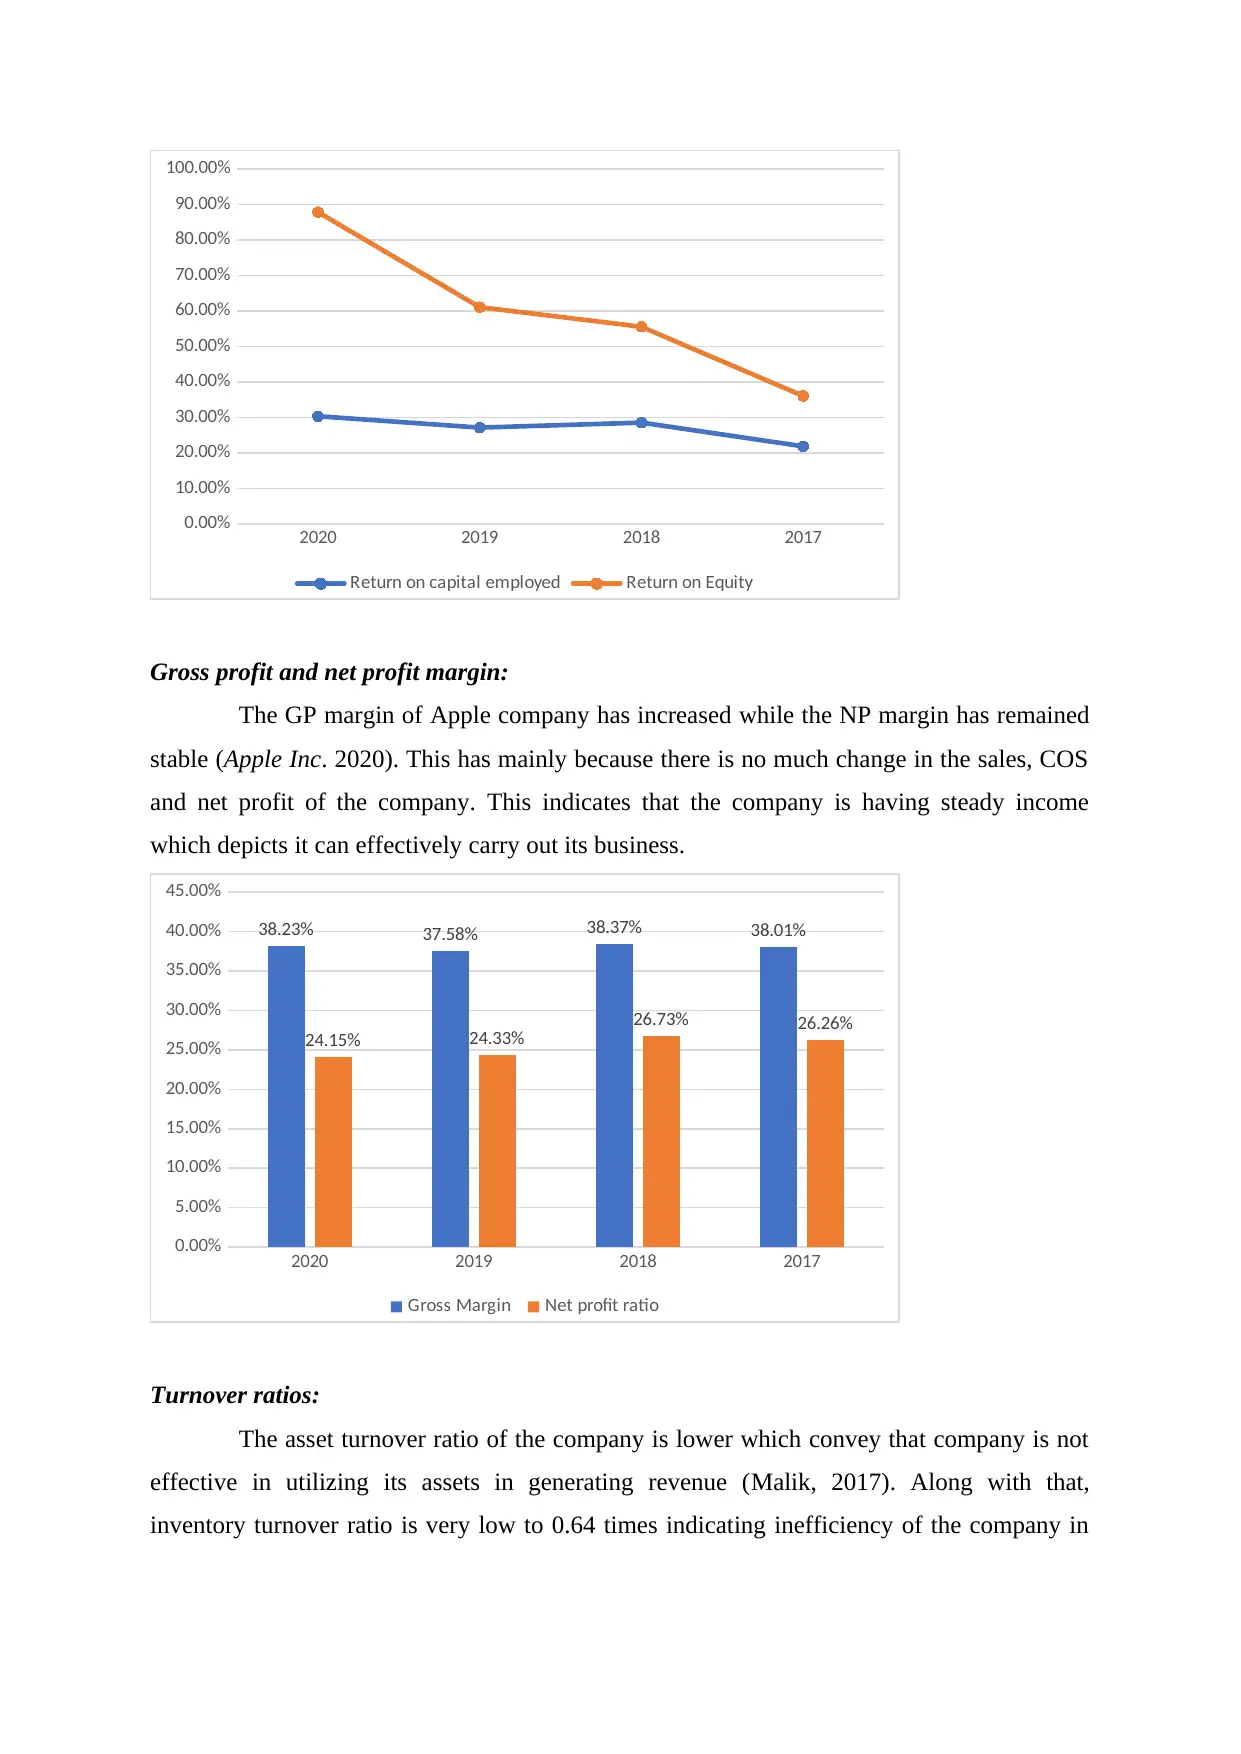
ROCE and ROE:
The ROCE of the company ahs shown an increase in trend over the year as it has
grown from 21.87% to 30.34% in the year 2020 which makes it attractive for investment
purpose (Zimon, 2018). Along with that, the ROE of the company has been growing
indicating the effectiveness of the company in repaying good return to its shareholders. This
makes the financial position of the company sound.
comparison to the previous year and there is overall a decrease in total assets. The total
liabilities of the company have increased by 7% taking 2017 as the base year.
Ratio analysis
Current and quick ratio:
The current and quick ratio of the company is very good which indicates that
company has effectively managed its current assets and obligations which helps it in
smoothly meeting with its short-term requirements (Andesfa and Masdupi, 2019). The
company is blocked less amount in its invested which is good.
2020 2019 2018 2017
0.00
0.20
0.40
0.60
0.80
1.00
1.20
1.40
1.60
1.80
Current ratio Quick Ratio
ROCE and ROE:
The ROCE of the company ahs shown an increase in trend over the year as it has
grown from 21.87% to 30.34% in the year 2020 which makes it attractive for investment
purpose (Zimon, 2018). Along with that, the ROE of the company has been growing
indicating the effectiveness of the company in repaying good return to its shareholders. This
makes the financial position of the company sound.
⊘ This is a preview!⊘
Do you want full access?
Subscribe today to unlock all pages.
Trusted by 1+ million students worldwide
2020 2019 2018 2017
0.00%
10.00%
20.00%
30.00%
40.00%
50.00%
60.00%
70.00%
80.00%
90.00%
100.00%
Return on capital employed Return on Equity
Gross profit and net profit margin:
The GP margin of Apple company has increased while the NP margin has remained
stable (Apple Inc. 2020). This has mainly because there is no much change in the sales, COS
and net profit of the company. This indicates that the company is having steady income
which depicts it can effectively carry out its business.
2020 2019 2018 2017
0.00%
5.00%
10.00%
15.00%
20.00%
25.00%
30.00%
35.00%
40.00%
45.00%
38.23% 37.58% 38.37% 38.01%
24.15% 24.33%
26.73% 26.26%
Gross Margin Net profit ratio
Turnover ratios:
The asset turnover ratio of the company is lower which convey that company is not
effective in utilizing its assets in generating revenue (Malik, 2017). Along with that,
inventory turnover ratio is very low to 0.64 times indicating inefficiency of the company in
0.00%
10.00%
20.00%
30.00%
40.00%
50.00%
60.00%
70.00%
80.00%
90.00%
100.00%
Return on capital employed Return on Equity
Gross profit and net profit margin:
The GP margin of Apple company has increased while the NP margin has remained
stable (Apple Inc. 2020). This has mainly because there is no much change in the sales, COS
and net profit of the company. This indicates that the company is having steady income
which depicts it can effectively carry out its business.
2020 2019 2018 2017
0.00%
5.00%
10.00%
15.00%
20.00%
25.00%
30.00%
35.00%
40.00%
45.00%
38.23% 37.58% 38.37% 38.01%
24.15% 24.33%
26.73% 26.26%
Gross Margin Net profit ratio
Turnover ratios:
The asset turnover ratio of the company is lower which convey that company is not
effective in utilizing its assets in generating revenue (Malik, 2017). Along with that,
inventory turnover ratio is very low to 0.64 times indicating inefficiency of the company in
Paraphrase This Document
Need a fresh take? Get an instant paraphrase of this document with our AI Paraphraser
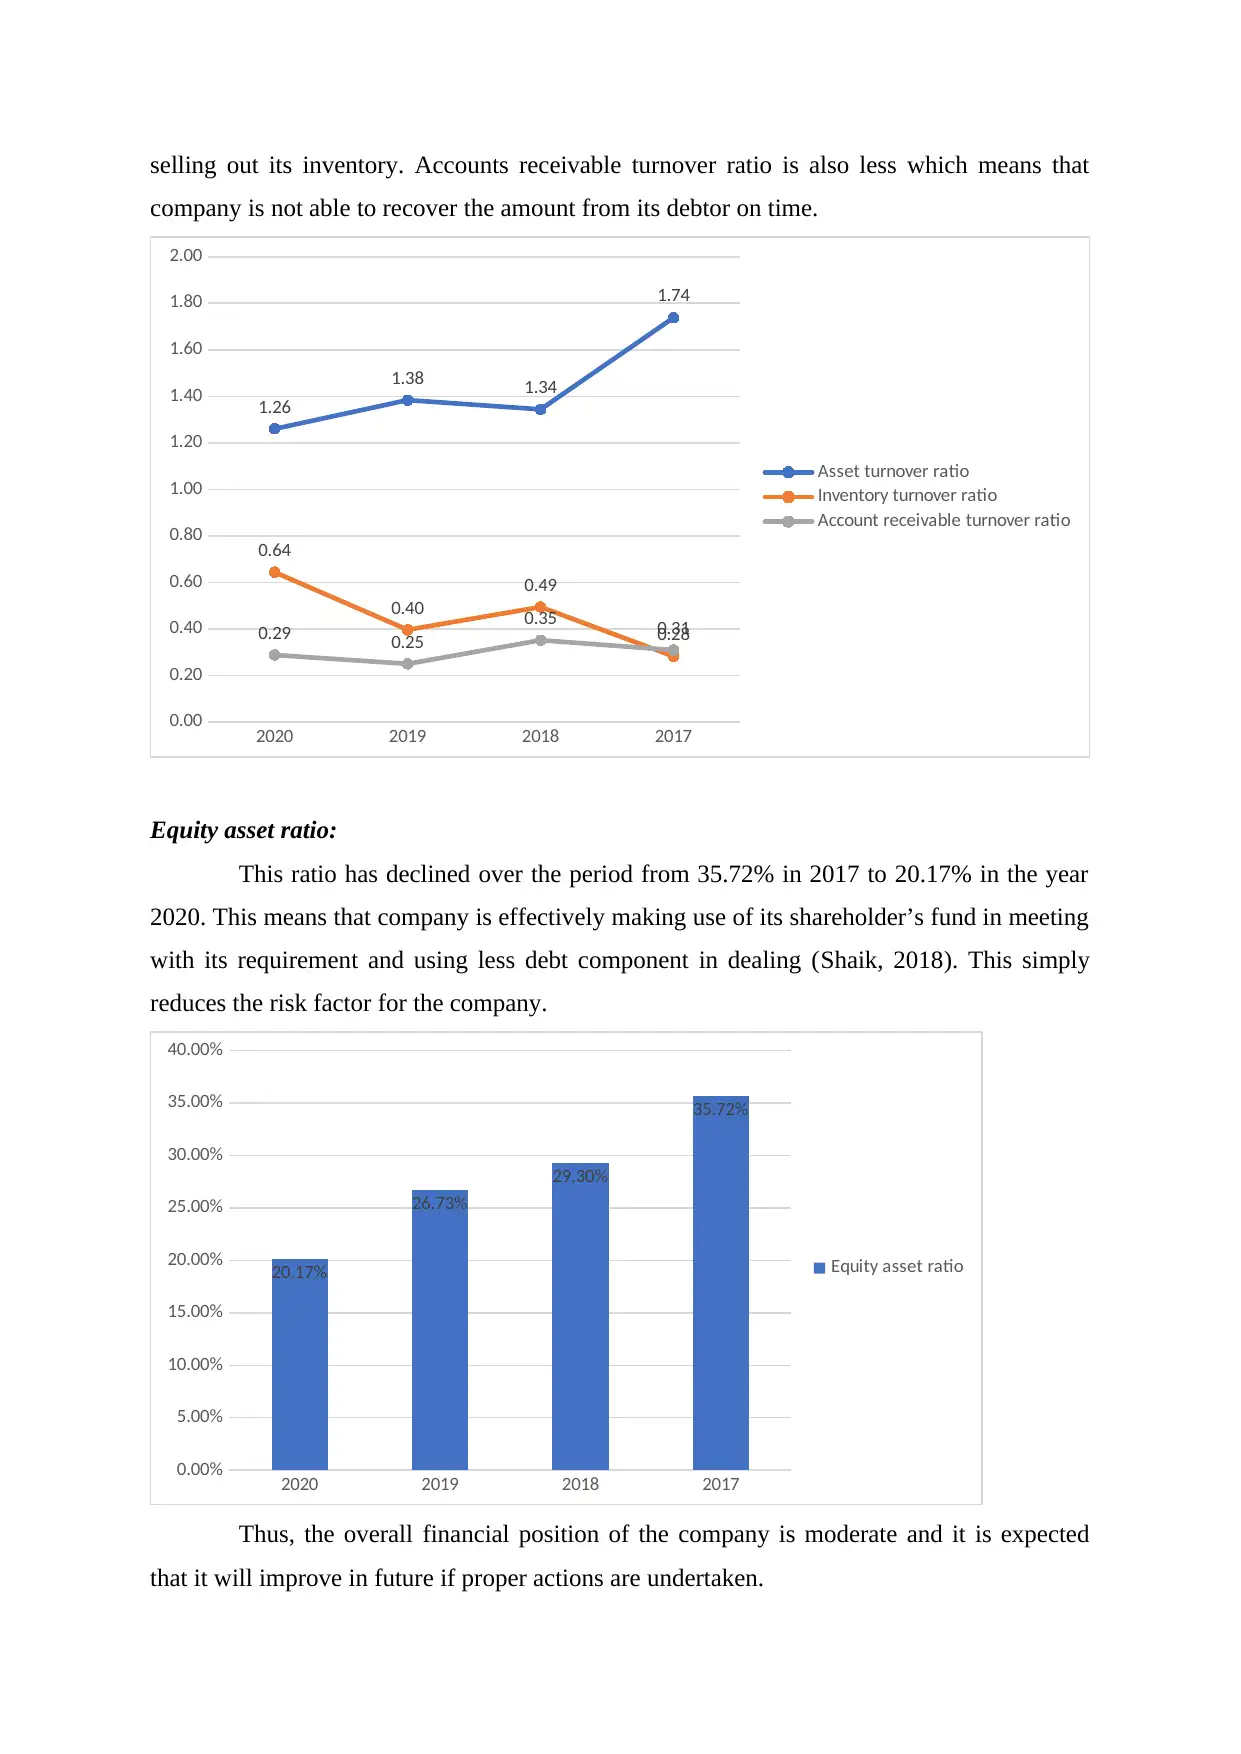
selling out its inventory. Accounts receivable turnover ratio is also less which means that
company is not able to recover the amount from its debtor on time.
2020 2019 2018 2017
0.00
0.20
0.40
0.60
0.80
1.00
1.20
1.40
1.60
1.80
2.00
1.26
1.38 1.34
1.74
0.64
0.40
0.49
0.280.29 0.25
0.35 0.31
Asset turnover ratio
Inventory turnover ratio
Account receivable turnover ratio
Equity asset ratio:
This ratio has declined over the period from 35.72% in 2017 to 20.17% in the year
2020. This means that company is effectively making use of its shareholder’s fund in meeting
with its requirement and using less debt component in dealing (Shaik, 2018). This simply
reduces the risk factor for the company.
2020 2019 2018 2017
0.00%
5.00%
10.00%
15.00%
20.00%
25.00%
30.00%
35.00%
40.00%
20.17%
26.73%
29.30%
35.72%
Equity asset ratio
Thus, the overall financial position of the company is moderate and it is expected
that it will improve in future if proper actions are undertaken.
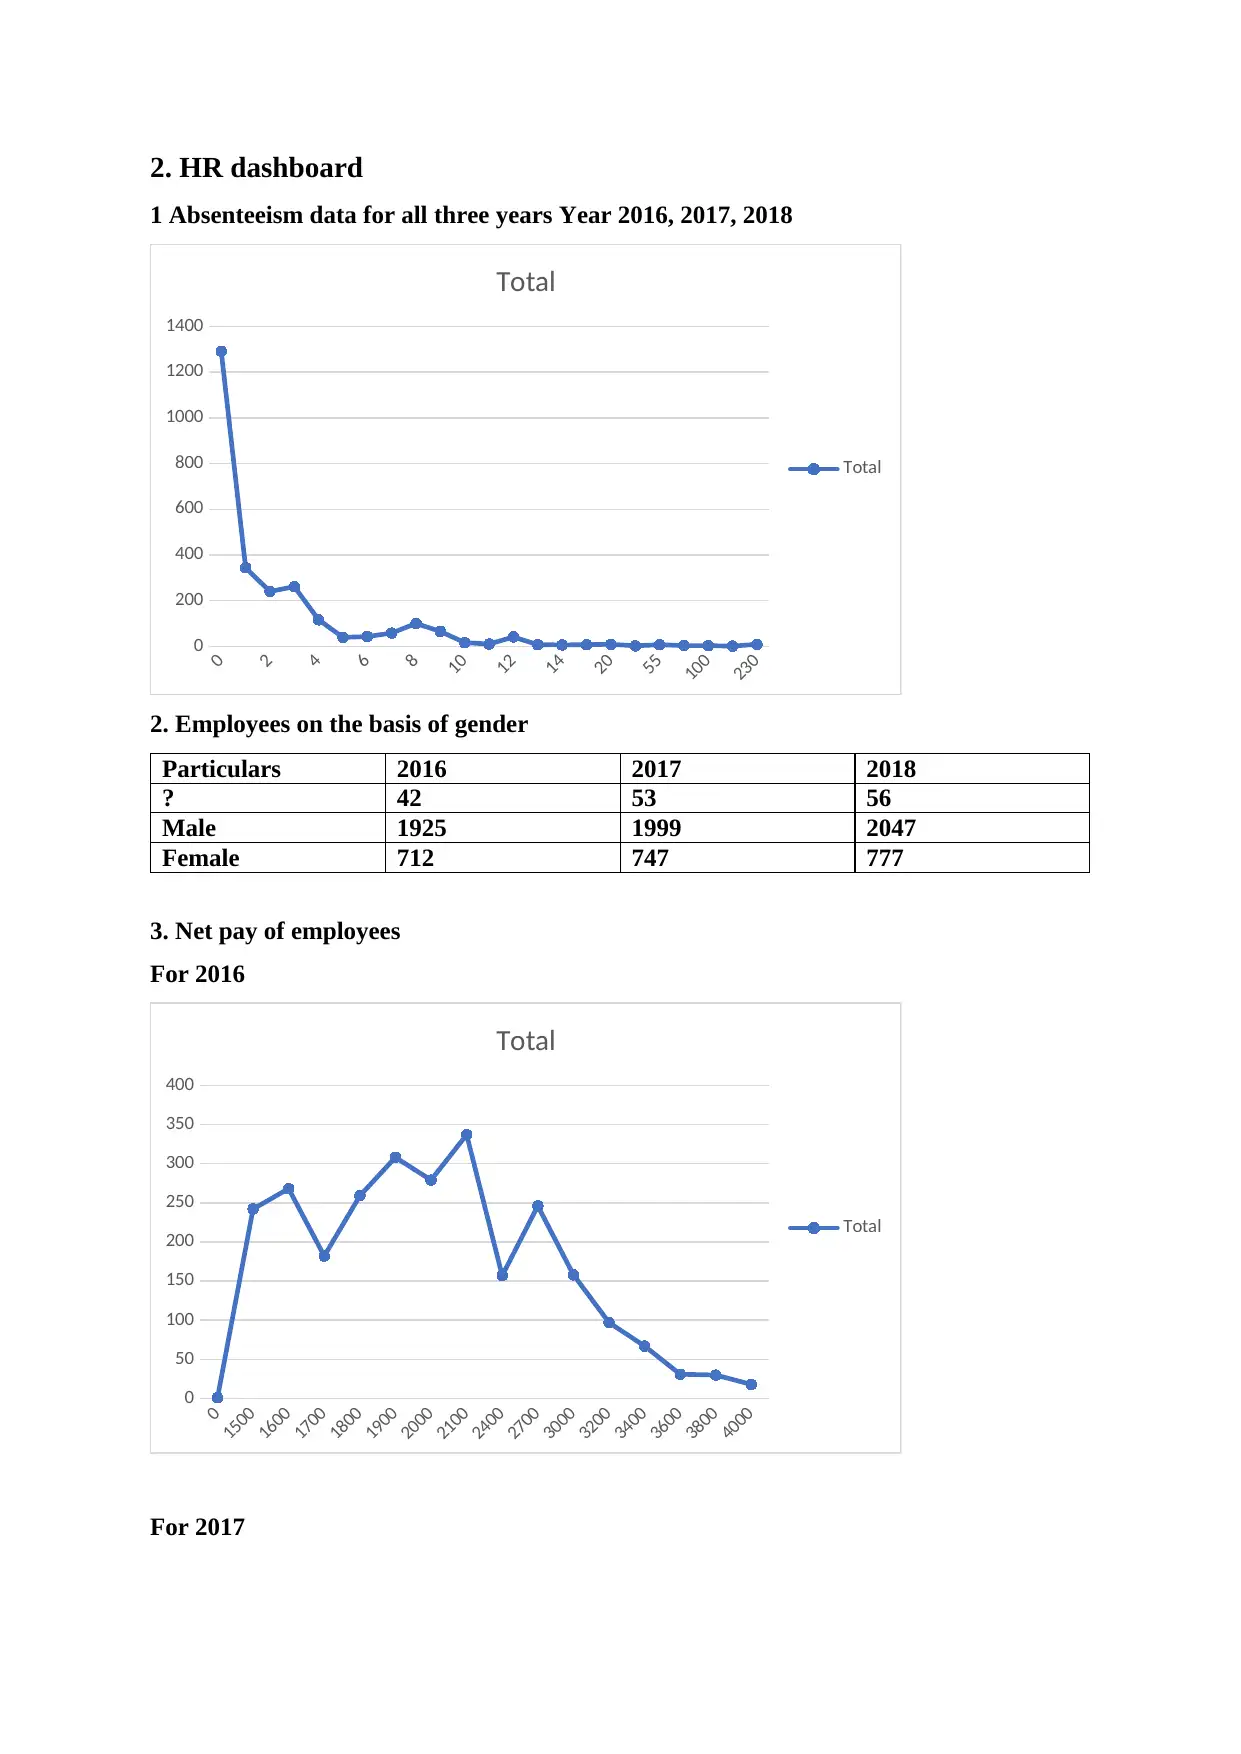
2. HR dashboard
1 Absenteeism data for all three years Year 2016, 2017, 2018
0
2
4
6
8
10
12
14
20
55
100
230
0
200
400
600
800
1000
1200
1400
Total
Total
2. Employees on the basis of gender
Particulars 2016 2017 2018
? 42 53 56
Male 1925 1999 2047
Female 712 747 777
3. Net pay of employees
For 2016
0
1500
1600
1700
1800
1900
2000
2100
2400
2700
3000
3200
3400
3600
3800
4000
0
50
100
150
200
250
300
350
400
Total
Total
For 2017
⊘ This is a preview!⊘
Do you want full access?
Subscribe today to unlock all pages.
Trusted by 1+ million students worldwide
€ 1,500
€ 1,650
€ 1,760
€ 1,870
€ 1,980
€ 2,090
€ 2,200
€ 2,400
€ 2,700
€ 3,000
€ 3,300
€ 3,520
€ 3,740
€ 4,000
€ 4,400
0
50
100
150
200
250
300
350
400
Total
Total
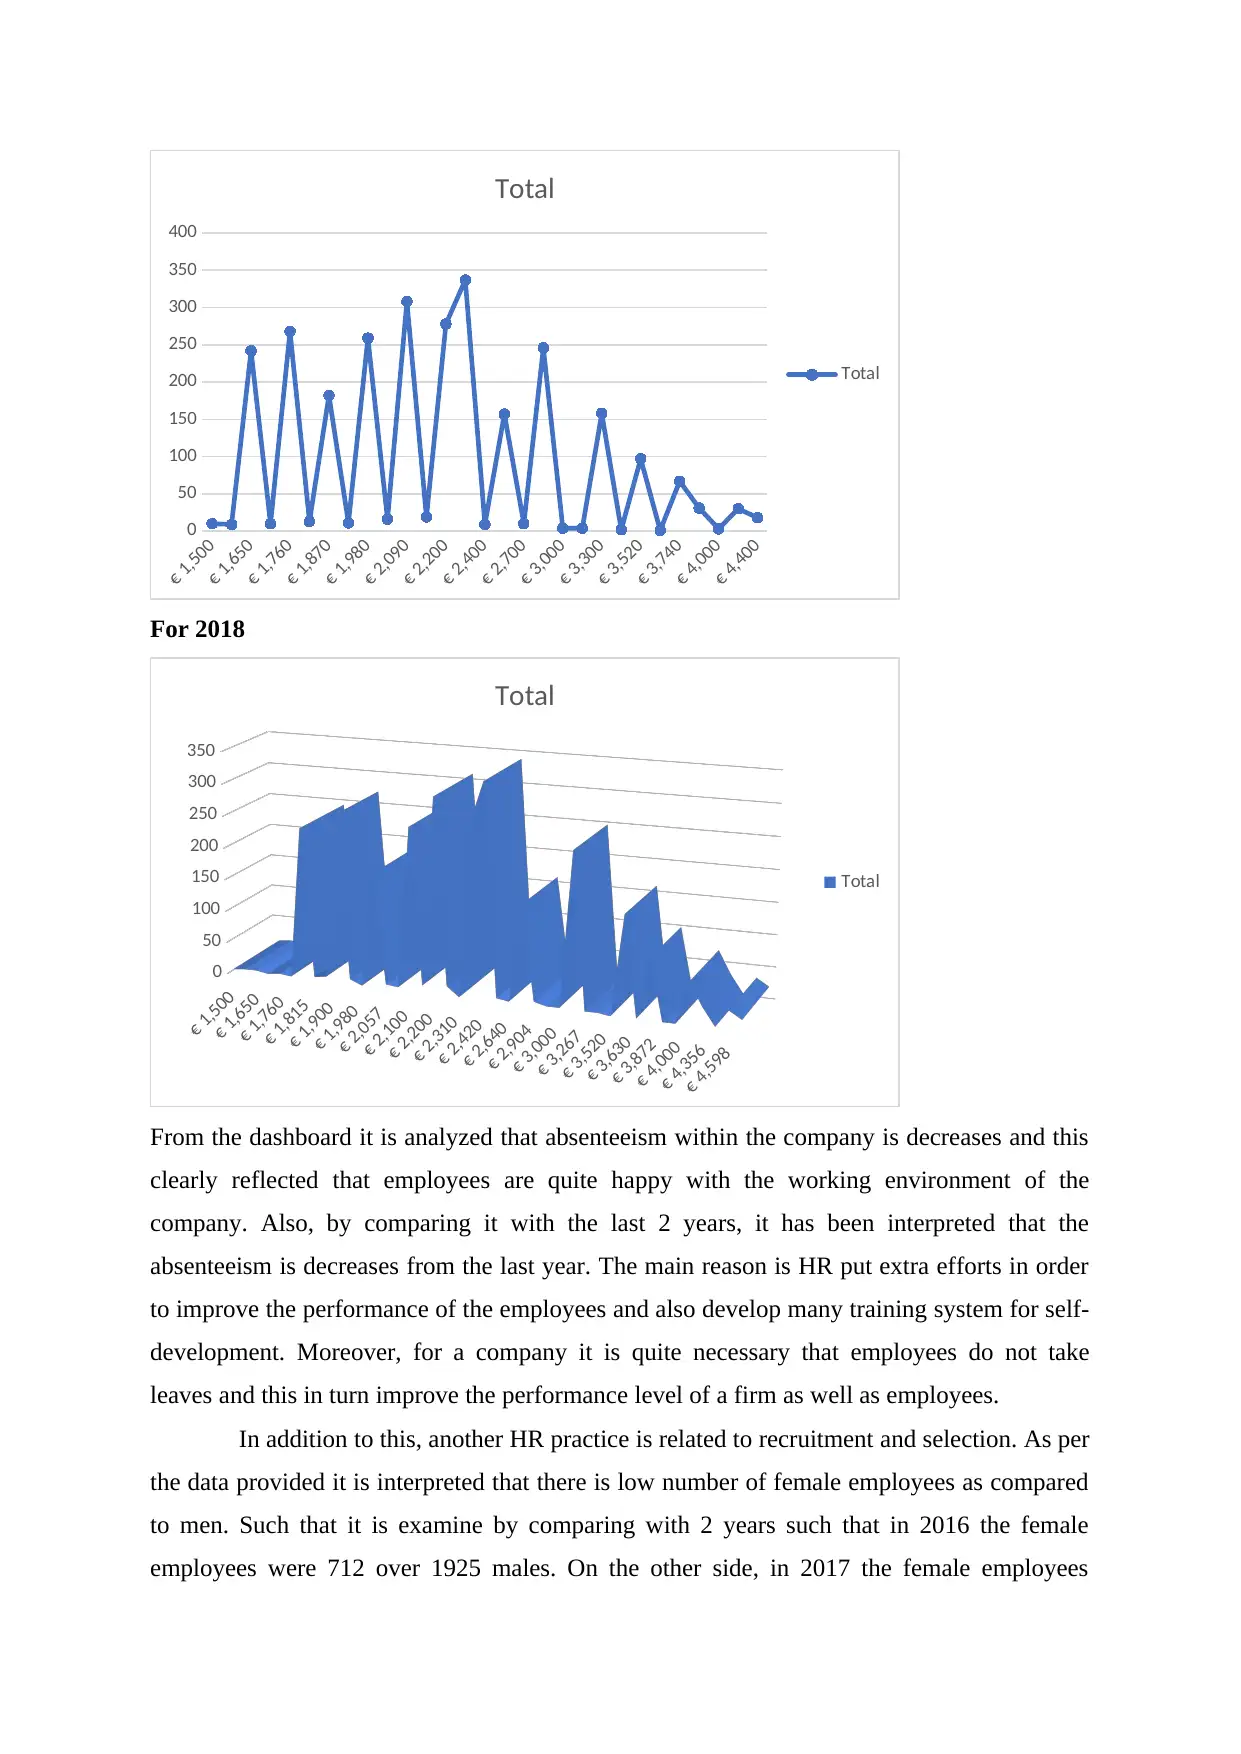
For 2018
€ 1,500
€ 1,650
€ 1,760
€ 1,815
€ 1,900
€ 1,980
€ 2,057
€ 2,100
€ 2,200
€ 2,310
€ 2,420
€ 2,640
€ 2,904
€ 3,000
€ 3,267
€ 3,520
€ 3,630
€ 3,872
€ 4,000
€ 4,356
€ 4,598
0
50
100
150
200
250
300
350
Total
Total
From the dashboard it is analyzed that absenteeism within the company is decreases and this
clearly reflected that employees are quite happy with the working environment of the
company. Also, by comparing it with the last 2 years, it has been interpreted that the
absenteeism is decreases from the last year. The main reason is HR put extra efforts in order
to improve the performance of the employees and also develop many training system for self-
development. Moreover, for a company it is quite necessary that employees do not take
leaves and this in turn improve the performance level of a firm as well as employees.
In addition to this, another HR practice is related to recruitment and selection. As per
the data provided it is interpreted that there is low number of female employees as compared
to men. Such that it is examine by comparing with 2 years such that in 2016 the female
employees were 712 over 1925 males. On the other side, in 2017 the female employees
€ 1,650
€ 1,760
€ 1,870
€ 1,980
€ 2,090
€ 2,200
€ 2,400
€ 2,700
€ 3,000
€ 3,300
€ 3,520
€ 3,740
€ 4,000
€ 4,400
0
50
100
150
200
250
300
350
400
Total
Total
For 2018
€ 1,500
€ 1,650
€ 1,760
€ 1,815
€ 1,900
€ 1,980
€ 2,057
€ 2,100
€ 2,200
€ 2,310
€ 2,420
€ 2,640
€ 2,904
€ 3,000
€ 3,267
€ 3,520
€ 3,630
€ 3,872
€ 4,000
€ 4,356
€ 4,598
0
50
100
150
200
250
300
350
Total
Total
From the dashboard it is analyzed that absenteeism within the company is decreases and this
clearly reflected that employees are quite happy with the working environment of the
company. Also, by comparing it with the last 2 years, it has been interpreted that the
absenteeism is decreases from the last year. The main reason is HR put extra efforts in order
to improve the performance of the employees and also develop many training system for self-
development. Moreover, for a company it is quite necessary that employees do not take
leaves and this in turn improve the performance level of a firm as well as employees.
In addition to this, another HR practice is related to recruitment and selection. As per
the data provided it is interpreted that there is low number of female employees as compared
to men. Such that it is examine by comparing with 2 years such that in 2016 the female
employees were 712 over 1925 males. On the other side, in 2017 the female employees
Paraphrase This Document
Need a fresh take? Get an instant paraphrase of this document with our AI Paraphraser
increase but there is no proper ratio define. Thus, it is stated that there is a gender inequality
while recruiting the employees such that HR prefer to have a male employees over female
which is not true as per the eyes of laws. That is why, there is a need to minimize the issues
because in every company, equality act must be complied where both male and female are
treated in proper manner. Also, HR are also never discriminated female candidate during
recruitment process.
Further, the data clearly exhibit that the number of female employee increases over
the time but in the same time male employees are also increases which is clearly shows that
there is no proper ratio described while recruiting the male and female employees. Hence,
there is a need to solve the problem which in turn affect the overall performance of the
employees along with company.
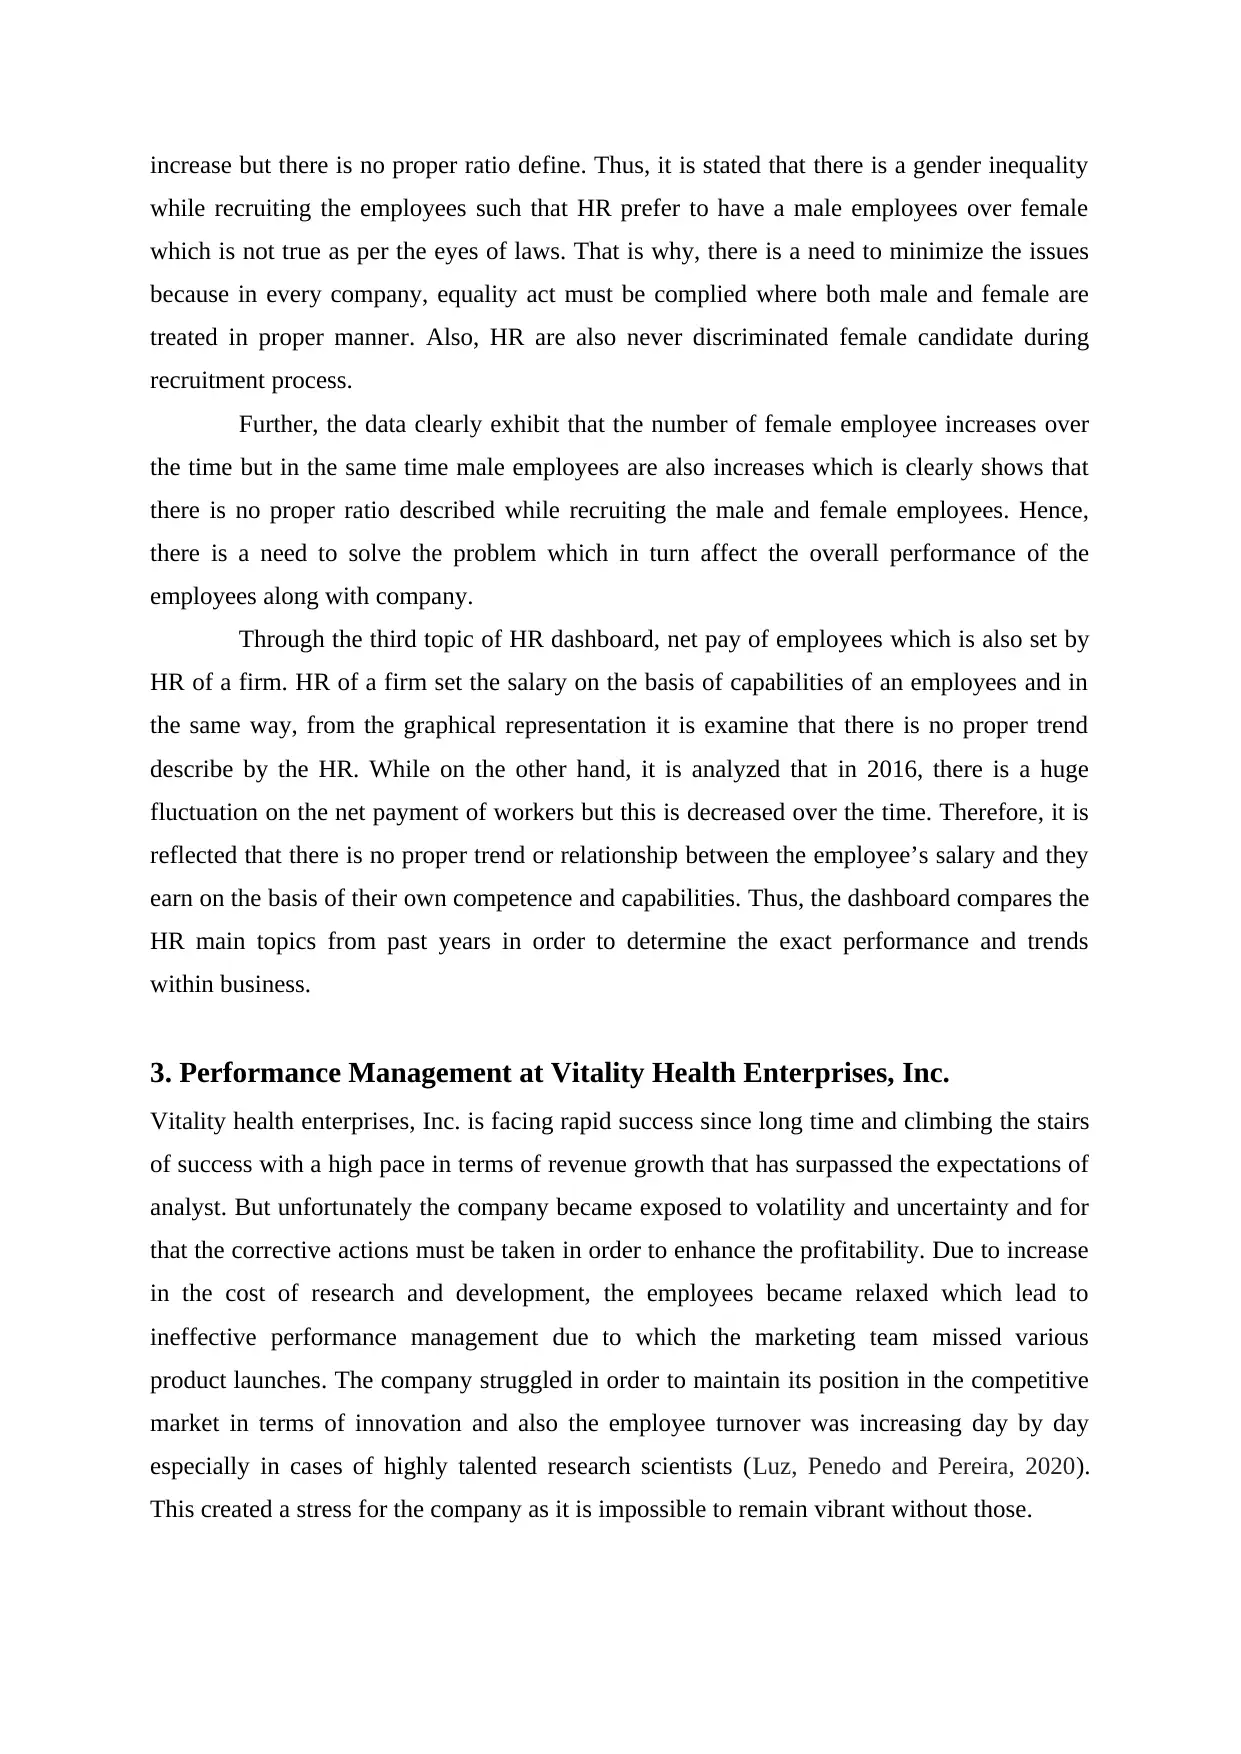
Through the third topic of HR dashboard, net pay of employees which is also set by
HR of a firm. HR of a firm set the salary on the basis of capabilities of an employees and in
the same way, from the graphical representation it is examine that there is no proper trend
describe by the HR. While on the other hand, it is analyzed that in 2016, there is a huge
fluctuation on the net payment of workers but this is decreased over the time. Therefore, it is
reflected that there is no proper trend or relationship between the employee’s salary and they
earn on the basis of their own competence and capabilities. Thus, the dashboard compares the
HR main topics from past years in order to determine the exact performance and trends
within business.
3. Performance Management at Vitality Health Enterprises, Inc.
Vitality health enterprises, Inc. is facing rapid success since long time and climbing the stairs
of success with a high pace in terms of revenue growth that has surpassed the expectations of
analyst. But unfortunately the company became exposed to volatility and uncertainty and for
that the corrective actions must be taken in order to enhance the profitability. Due to increase
in the cost of research and development, the employees became relaxed which lead to
ineffective performance management due to which the marketing team missed various
product launches. The company struggled in order to maintain its position in the competitive
market in terms of innovation and also the employee turnover was increasing day by day
especially in cases of highly talented research scientists (Luz, Penedo and Pereira, 2020).
This created a stress for the company as it is impossible to remain vibrant without those.
while recruiting the employees such that HR prefer to have a male employees over female
which is not true as per the eyes of laws. That is why, there is a need to minimize the issues
because in every company, equality act must be complied where both male and female are
treated in proper manner. Also, HR are also never discriminated female candidate during
recruitment process.
Further, the data clearly exhibit that the number of female employee increases over
the time but in the same time male employees are also increases which is clearly shows that
there is no proper ratio described while recruiting the male and female employees. Hence,
there is a need to solve the problem which in turn affect the overall performance of the
employees along with company.
Through the third topic of HR dashboard, net pay of employees which is also set by
HR of a firm. HR of a firm set the salary on the basis of capabilities of an employees and in
the same way, from the graphical representation it is examine that there is no proper trend
describe by the HR. While on the other hand, it is analyzed that in 2016, there is a huge
fluctuation on the net payment of workers but this is decreased over the time. Therefore, it is
reflected that there is no proper trend or relationship between the employee’s salary and they
earn on the basis of their own competence and capabilities. Thus, the dashboard compares the
HR main topics from past years in order to determine the exact performance and trends
within business.
3. Performance Management at Vitality Health Enterprises, Inc.
Vitality health enterprises, Inc. is facing rapid success since long time and climbing the stairs
of success with a high pace in terms of revenue growth that has surpassed the expectations of
analyst. But unfortunately the company became exposed to volatility and uncertainty and for
that the corrective actions must be taken in order to enhance the profitability. Due to increase
in the cost of research and development, the employees became relaxed which lead to
ineffective performance management due to which the marketing team missed various
product launches. The company struggled in order to maintain its position in the competitive
market in terms of innovation and also the employee turnover was increasing day by day
especially in cases of highly talented research scientists (Luz, Penedo and Pereira, 2020).
This created a stress for the company as it is impossible to remain vibrant without those.
There was a need for an effective performance management evaluation team. Because in
order to compete in the emerging markets, the product engineers must be motivated. The
company also ensures that the performance management team must be able to generate
outcomes according to the expectations. The CEO of the company also introduced a
committee to review the policies and strategies in order to track the performance goals of all
the non-sales and the non-executive employees from the company. Though the performance
management has helped in increasing the productivity and the overall sales but also raised
many challenges for more than 2,500 professional staff including the scientists and the
engineers along with the product managers who worked in research and development labs
(Glowka, Kallmünzer and Zehrer, 2020). This also led to managerial abuses which affected
the overall culture of the organisation.
The company Vitality benchmarked compensation for keeping the pay policy line regarding
the compensation. This helped in gaining actual compensation figures which resulted in
results higher than competition. This heightened pay resulted in the less turnover but there
were no provisions made like bonuses or any other form of compensation. While no
employees complained about the individual pay check, but the system of the company itself
faced many issues in rewarding the top performers and terminating the low performers. This
forced the most of the employees to leave the job and finding greater job prospects.
Due to all these issues, the CEO of the company decided to revise the overall performance
management system and start rewarding the top performers which can help the company to
accelerate its growth by attracting the talented candidates and helps in retaining those who
contribute towards the organisational goals (Obondo, 2018). The main objective beside this
was to identify the low performers so that proper trainings can be provided to them. Overall
the main objective behind this was to improve the performance of the employees by assessing
the attributes and integrate them with the strategic goals of Vitality. The company also revise
the evaluation criteria and the manager’s tool in the performance appraisal and also new
compensation tools were developed beyond the salaries. After that, the company provided
incentives to the employees and which resulted in the rapid growth of the company which in
turn helped the company to compete with its competitors.
4. HR problem and Solution
The HR problem in the company was identified that the HR does not recruits the equal
proportion of males and females in the company which led to disturbed outcomes. This also
⊘ This is a preview!⊘
Do you want full access?
Subscribe today to unlock all pages.
Trusted by 1+ million students worldwide
1 out of 18
Related Documents


Your All-in-One AI-Powered Toolkit for Academic Success.
+13062052269
info@desklib.com
Available 24*7 on WhatsApp / Email
![[object Object]](/_next/static/media/star-bottom.7253800d.svg)
Unlock your academic potential
Copyright © 2020–2026 A2Z Services. All Rights Reserved. Developed and managed by ZUCOL.