In-depth Financial Analysis, Budgeting, and Investment Report
VerifiedAdded on 2023/06/04
|17
|3868
|246
Report
AI Summary
This report provides a comprehensive financial analysis of Liverton Company, including the calculation and interpretation of financial ratios such as gross profit ratio, assets usage ratio, current ratio, acid test ratio, stock holding period, and debt to equity ratio. It critically evaluates financial statements and assesses the liquidity and profitability of the company. Additionally, the report prepares an opening statement of financial position and a cash budget for Sassy Clothing, analyzing additional expenditures and proposing strategies to improve cash flow. Furthermore, it analyzes the break-even point, calculates the margin of safety, and evaluates a new business strategy. Finally, the report covers investment appraisal techniques, including payback period, net present value, and average rate of return, discussing the best method of appraisal and providing a conclusion with key findings and recommendations.

To Finance
(Distinction Criteria)
(Distinction Criteria)
Paraphrase This Document
Need a fresh take? Get an instant paraphrase of this document with our AI Paraphraser
Table of Contents
INTRODUCTION ..........................................................................................................................3
Question 1 .......................................................................................................................................3
a) Calculation and interpretation of financial ratios....................................................................3
b) Critically evaluation of financial statement............................................................................5
Question 2........................................................................................................................................6
a) opening statement of financial position..................................................................................6
b) cash budget of Sassy clothing for 6 month ............................................................................7
c) Critical analyse of additional expenditures.............................................................................7
Question 3........................................................................................................................................8
a) Analysis of Break even point..................................................................................................8
b) 2019 and 2020 Margin of safety ( MOS ) ..............................................................................9
c) New strategy that has been developed by Jessica.................................................................10
Question 4......................................................................................................................................11
(a) calculation of pay back period, Net present value and average rate of return.....................11
b) Discuss the best method of appraisal technique...................................................................14
c) Investment appraisal techniques...........................................................................................14
CONCLUSION .............................................................................................................................15
REFERENCES..............................................................................................................................16
INTRODUCTION
Finance means the manages of fund and considers different types of activities like
lending, saving and borrowing. It includes personal, public and corporate finance. It also
includes the raising on money for any kind of expenditure. Customers, enterprises and company
are not have enough money to pay the expenses, make payment of debtors. They also issue
equity share and debts to arrange the fund to conduct the daily operations. Financial ratios are
also very important component because it describes the financial position of the company and
determines the company have sufficient money to pay its debtors (Berrou and et.al, 2019). This
report includes, income statement and financial position of Liverton Company through which
analyse the liquidity position of the company. It also includes the preparation of opening
statement of financial position of Sassy clothing that sells their product by online and mail order.
Further this report includes the various investment appraisal techniques to select the project.
Question 1
a) Calculation and interpretation of financial ratios
There are various types of ratios that evaluates the liquidity position of the company such
as profitability, efficiency, turnover based and solvency ratios.
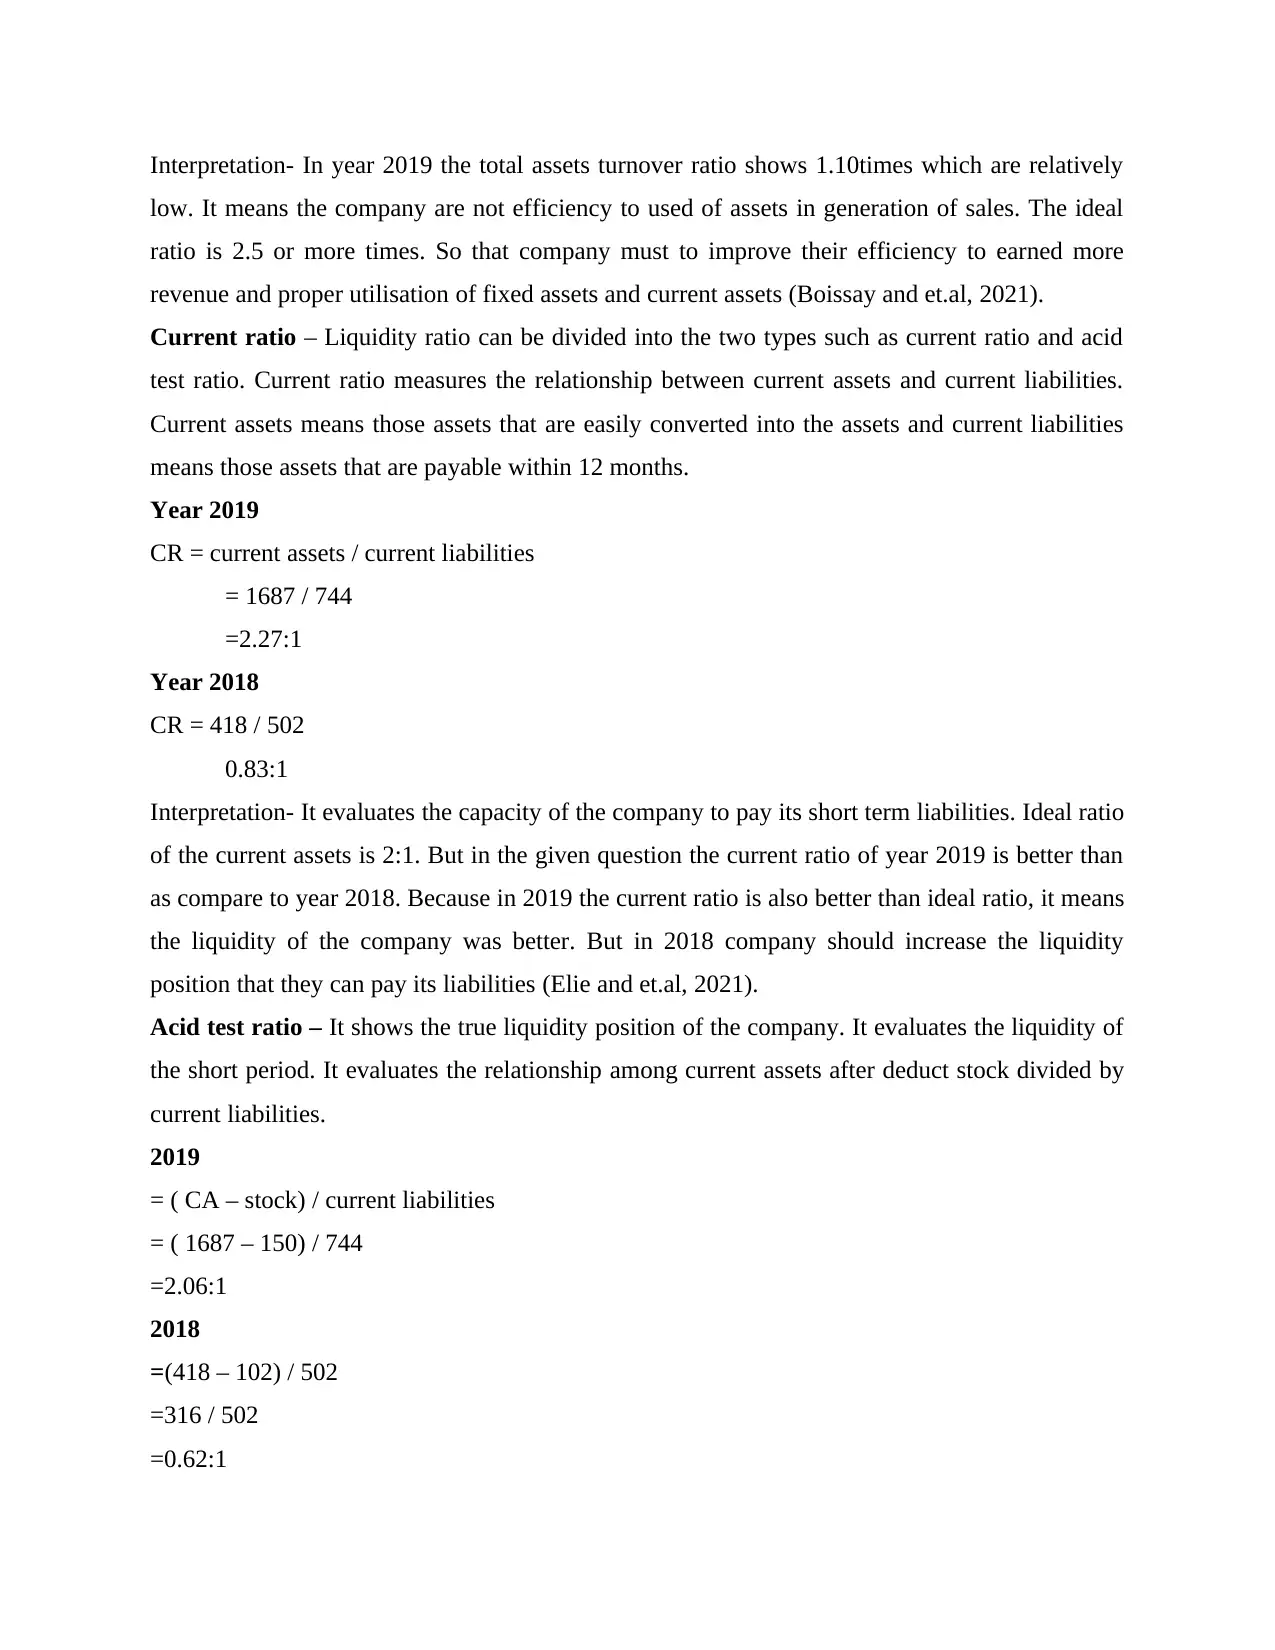
Gross profit ratio- It is the type of profitability ratio. The gross profit ratios tells the profit of
the company that is earned by selling of goods and services. It describes the relationship between
GP and sales revenue.
Formula= GP = ( revenue – cost of sales) * 100 / sales revenue\
=(3495 – 2182) *100 / 3495
=37.57 %
Interpretation- The GP ratio describes the true profit of the company. In year 2019 shows the
high GP margin it means the cost of products are low. But company should adopt special
technique that reduces the cost of the products and company can earn more GP in future.
Assets usage ratio- It is type of efficiency ratio. It describes the efficiency of the company with
that company utilises its total assets (Bharti, 2018).
Assets usage ratio = Total revenue / average fixed assets + average current assets
= 3495 / 3157.5
=1.10 times
Finance means the manages of fund and considers different types of activities like
lending, saving and borrowing. It includes personal, public and corporate finance. It also
includes the raising on money for any kind of expenditure. Customers, enterprises and company
are not have enough money to pay the expenses, make payment of debtors. They also issue
equity share and debts to arrange the fund to conduct the daily operations. Financial ratios are
also very important component because it describes the financial position of the company and
determines the company have sufficient money to pay its debtors (Berrou and et.al, 2019). This
report includes, income statement and financial position of Liverton Company through which
analyse the liquidity position of the company. It also includes the preparation of opening
statement of financial position of Sassy clothing that sells their product by online and mail order.
Further this report includes the various investment appraisal techniques to select the project.
Question 1
a) Calculation and interpretation of financial ratios
There are various types of ratios that evaluates the liquidity position of the company such
as profitability, efficiency, turnover based and solvency ratios.
Gross profit ratio- It is the type of profitability ratio. The gross profit ratios tells the profit of
the company that is earned by selling of goods and services. It describes the relationship between
GP and sales revenue.
Formula= GP = ( revenue – cost of sales) * 100 / sales revenue\
=(3495 – 2182) *100 / 3495
=37.57 %
Interpretation- The GP ratio describes the true profit of the company. In year 2019 shows the
high GP margin it means the cost of products are low. But company should adopt special
technique that reduces the cost of the products and company can earn more GP in future.
Assets usage ratio- It is type of efficiency ratio. It describes the efficiency of the company with
that company utilises its total assets (Bharti, 2018).
Assets usage ratio = Total revenue / average fixed assets + average current assets
= 3495 / 3157.5
=1.10 times
⊘ This is a preview!⊘
Do you want full access?
Subscribe today to unlock all pages.
Trusted by 1+ million students worldwide
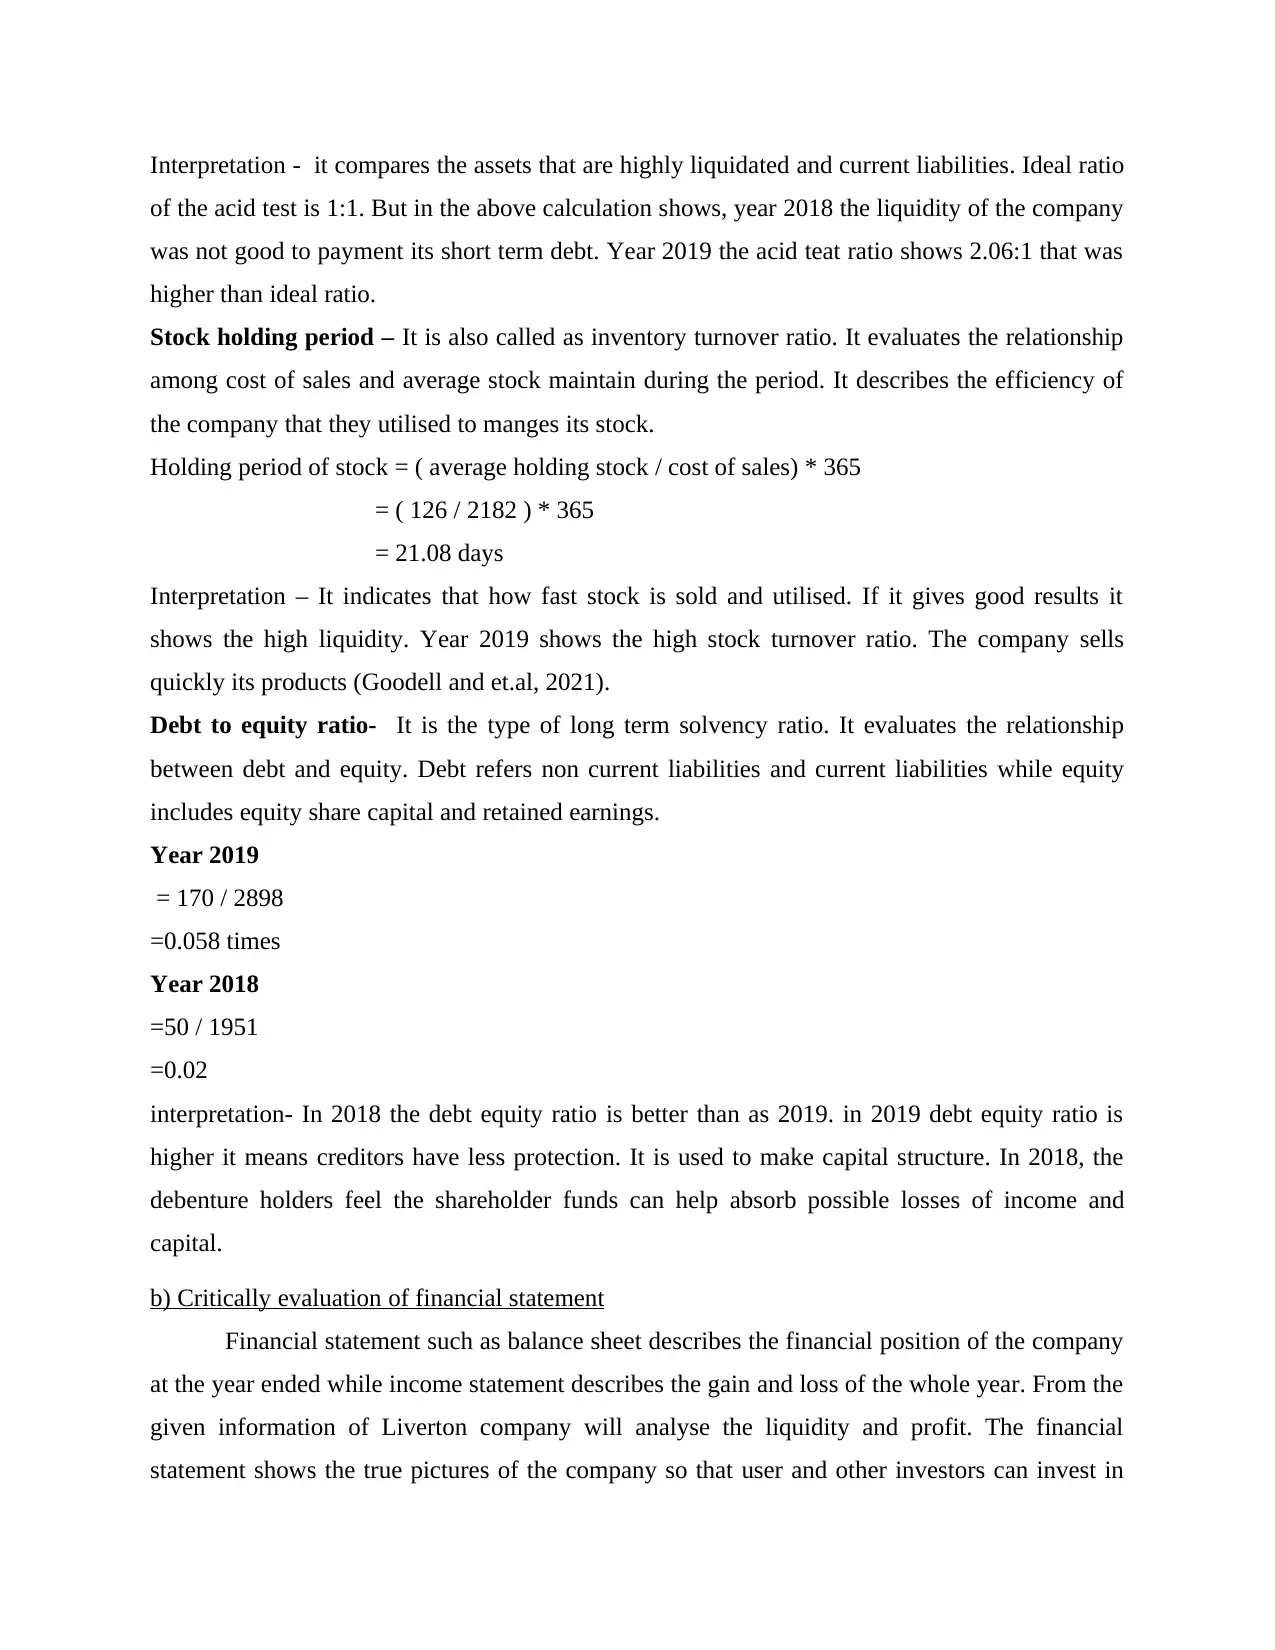
Interpretation- In year 2019 the total assets turnover ratio shows 1.10times which are relatively
low. It means the company are not efficiency to used of assets in generation of sales. The ideal
ratio is 2.5 or more times. So that company must to improve their efficiency to earned more
revenue and proper utilisation of fixed assets and current assets (Boissay and et.al, 2021).
Current ratio – Liquidity ratio can be divided into the two types such as current ratio and acid
test ratio. Current ratio measures the relationship between current assets and current liabilities.
Current assets means those assets that are easily converted into the assets and current liabilities
means those assets that are payable within 12 months.
Year 2019
CR = current assets / current liabilities
= 1687 / 744
=2.27:1
Year 2018
CR = 418 / 502
0.83:1
Interpretation- It evaluates the capacity of the company to pay its short term liabilities. Ideal ratio
of the current assets is 2:1. But in the given question the current ratio of year 2019 is better than
as compare to year 2018. Because in 2019 the current ratio is also better than ideal ratio, it means
the liquidity of the company was better. But in 2018 company should increase the liquidity
position that they can pay its liabilities (Elie and et.al, 2021).
Acid test ratio – It shows the true liquidity position of the company. It evaluates the liquidity of
the short period. It evaluates the relationship among current assets after deduct stock divided by
current liabilities.
2019
= ( CA – stock) / current liabilities
= ( 1687 – 150) / 744
=2.06:1
2018
=(418 – 102) / 502
=316 / 502
=0.62:1
Paraphrase This Document
Need a fresh take? Get an instant paraphrase of this document with our AI Paraphraser
Interpretation - it compares the assets that are highly liquidated and current liabilities. Ideal ratio
of the acid test is 1:1. But in the above calculation shows, year 2018 the liquidity of the company
was not good to payment its short term debt. Year 2019 the acid teat ratio shows 2.06:1 that was
higher than ideal ratio.
Stock holding period – It is also called as inventory turnover ratio. It evaluates the relationship
among cost of sales and average stock maintain during the period. It describes the efficiency of
the company that they utilised to manges its stock.
Holding period of stock = ( average holding stock / cost of sales) * 365
= ( 126 / 2182 ) * 365
= 21.08 days
Interpretation – It indicates that how fast stock is sold and utilised. If it gives good results it
shows the high liquidity. Year 2019 shows the high stock turnover ratio. The company sells
quickly its products (Goodell and et.al, 2021).
Debt to equity ratio- It is the type of long term solvency ratio. It evaluates the relationship
between debt and equity. Debt refers non current liabilities and current liabilities while equity
includes equity share capital and retained earnings.
Year 2019
= 170 / 2898
=0.058 times
Year 2018
=50 / 1951
=0.02
interpretation- In 2018 the debt equity ratio is better than as 2019. in 2019 debt equity ratio is
higher it means creditors have less protection. It is used to make capital structure. In 2018, the
debenture holders feel the shareholder funds can help absorb possible losses of income and
capital.
b) Critically evaluation of financial statement
Financial statement such as balance sheet describes the financial position of the company
at the year ended while income statement describes the gain and loss of the whole year. From the
given information of Liverton company will analyse the liquidity and profit. The financial
statement shows the true pictures of the company so that user and other investors can invest in
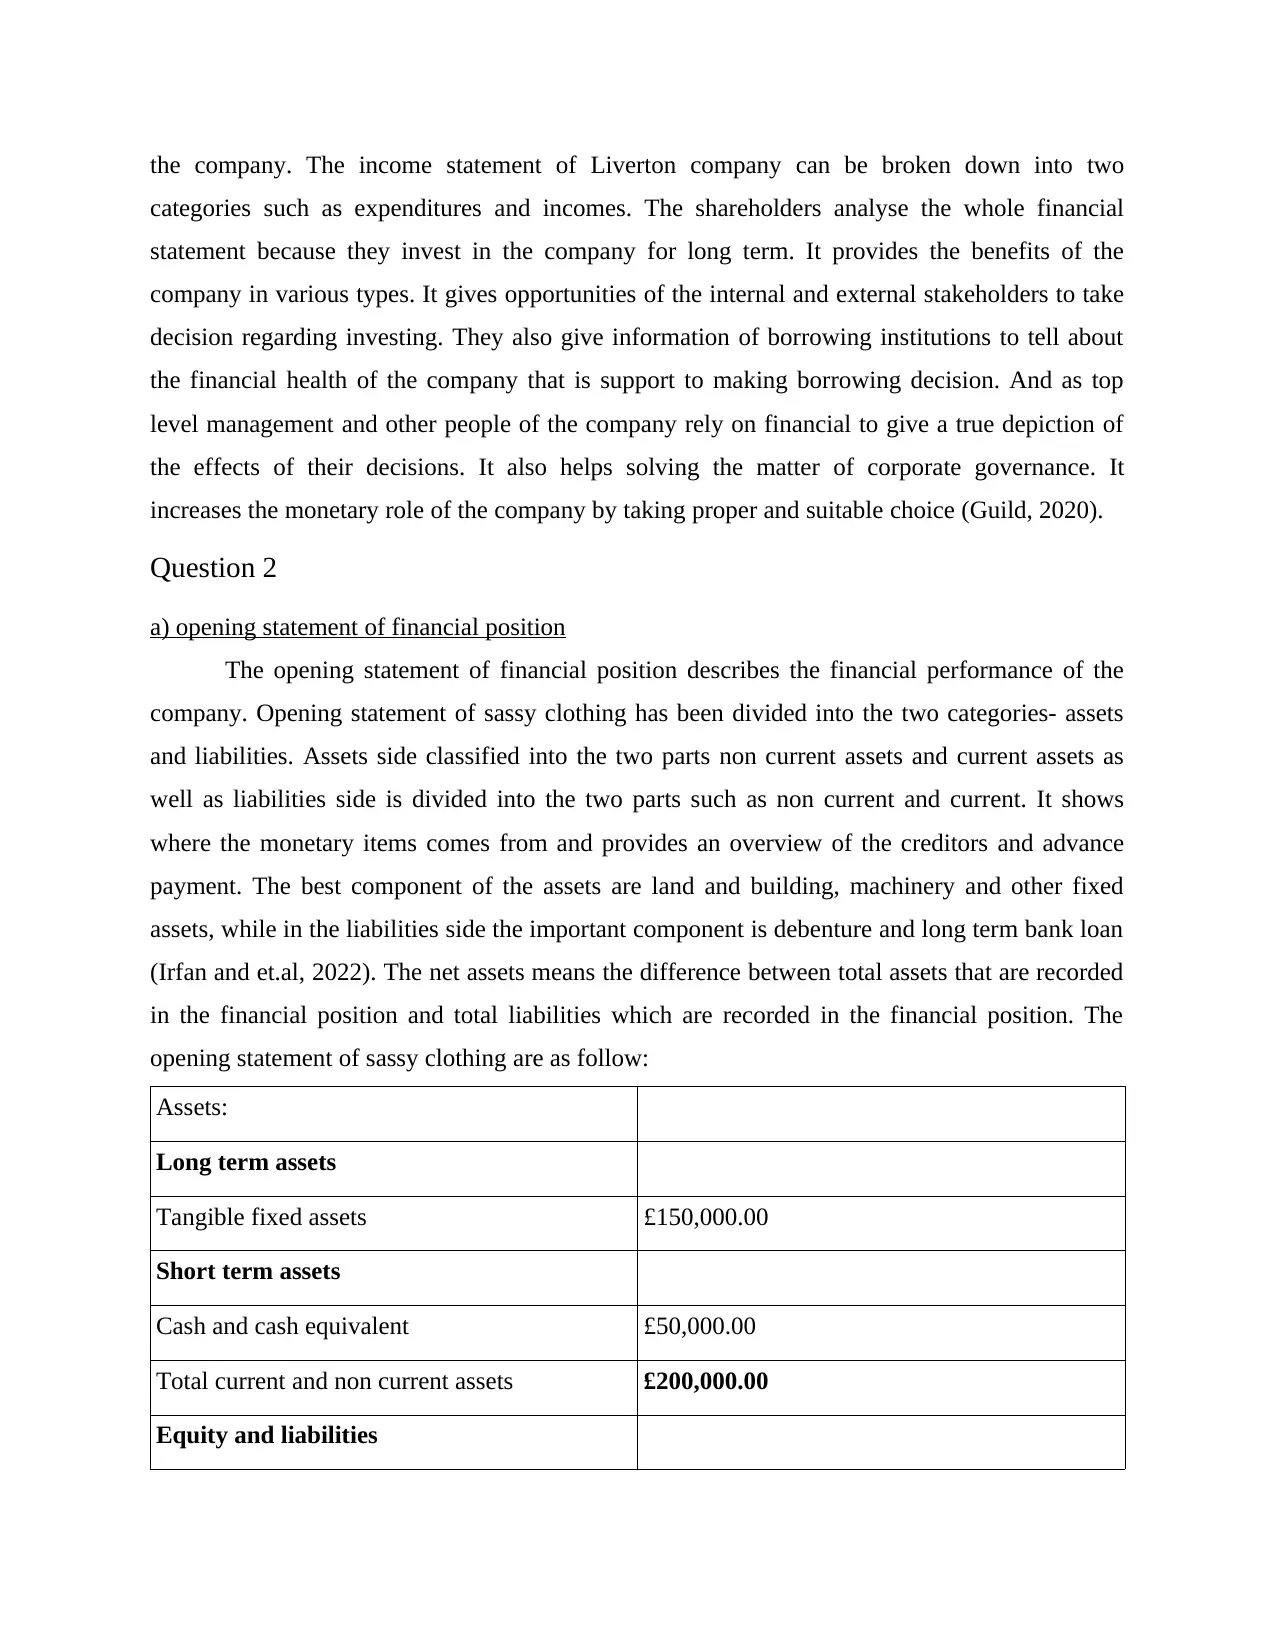
the company. The income statement of Liverton company can be broken down into two
categories such as expenditures and incomes. The shareholders analyse the whole financial
statement because they invest in the company for long term. It provides the benefits of the
company in various types. It gives opportunities of the internal and external stakeholders to take
decision regarding investing. They also give information of borrowing institutions to tell about
the financial health of the company that is support to making borrowing decision. And as top
level management and other people of the company rely on financial to give a true depiction of
the effects of their decisions. It also helps solving the matter of corporate governance. It
increases the monetary role of the company by taking proper and suitable choice (Guild, 2020).
Question 2
a) opening statement of financial position
The opening statement of financial position describes the financial performance of the
company. Opening statement of sassy clothing has been divided into the two categories- assets
and liabilities. Assets side classified into the two parts non current assets and current assets as
well as liabilities side is divided into the two parts such as non current and current. It shows
where the monetary items comes from and provides an overview of the creditors and advance
payment. The best component of the assets are land and building, machinery and other fixed
assets, while in the liabilities side the important component is debenture and long term bank loan
(Irfan and et.al, 2022). The net assets means the difference between total assets that are recorded
in the financial position and total liabilities which are recorded in the financial position. The
opening statement of sassy clothing are as follow:
Assets:
Long term assets
Tangible fixed assets £150,000.00
Short term assets
Cash and cash equivalent £50,000.00
Total current and non current assets £200,000.00
Equity and liabilities
⊘ This is a preview!⊘
Do you want full access?
Subscribe today to unlock all pages.
Trusted by 1+ million students worldwide
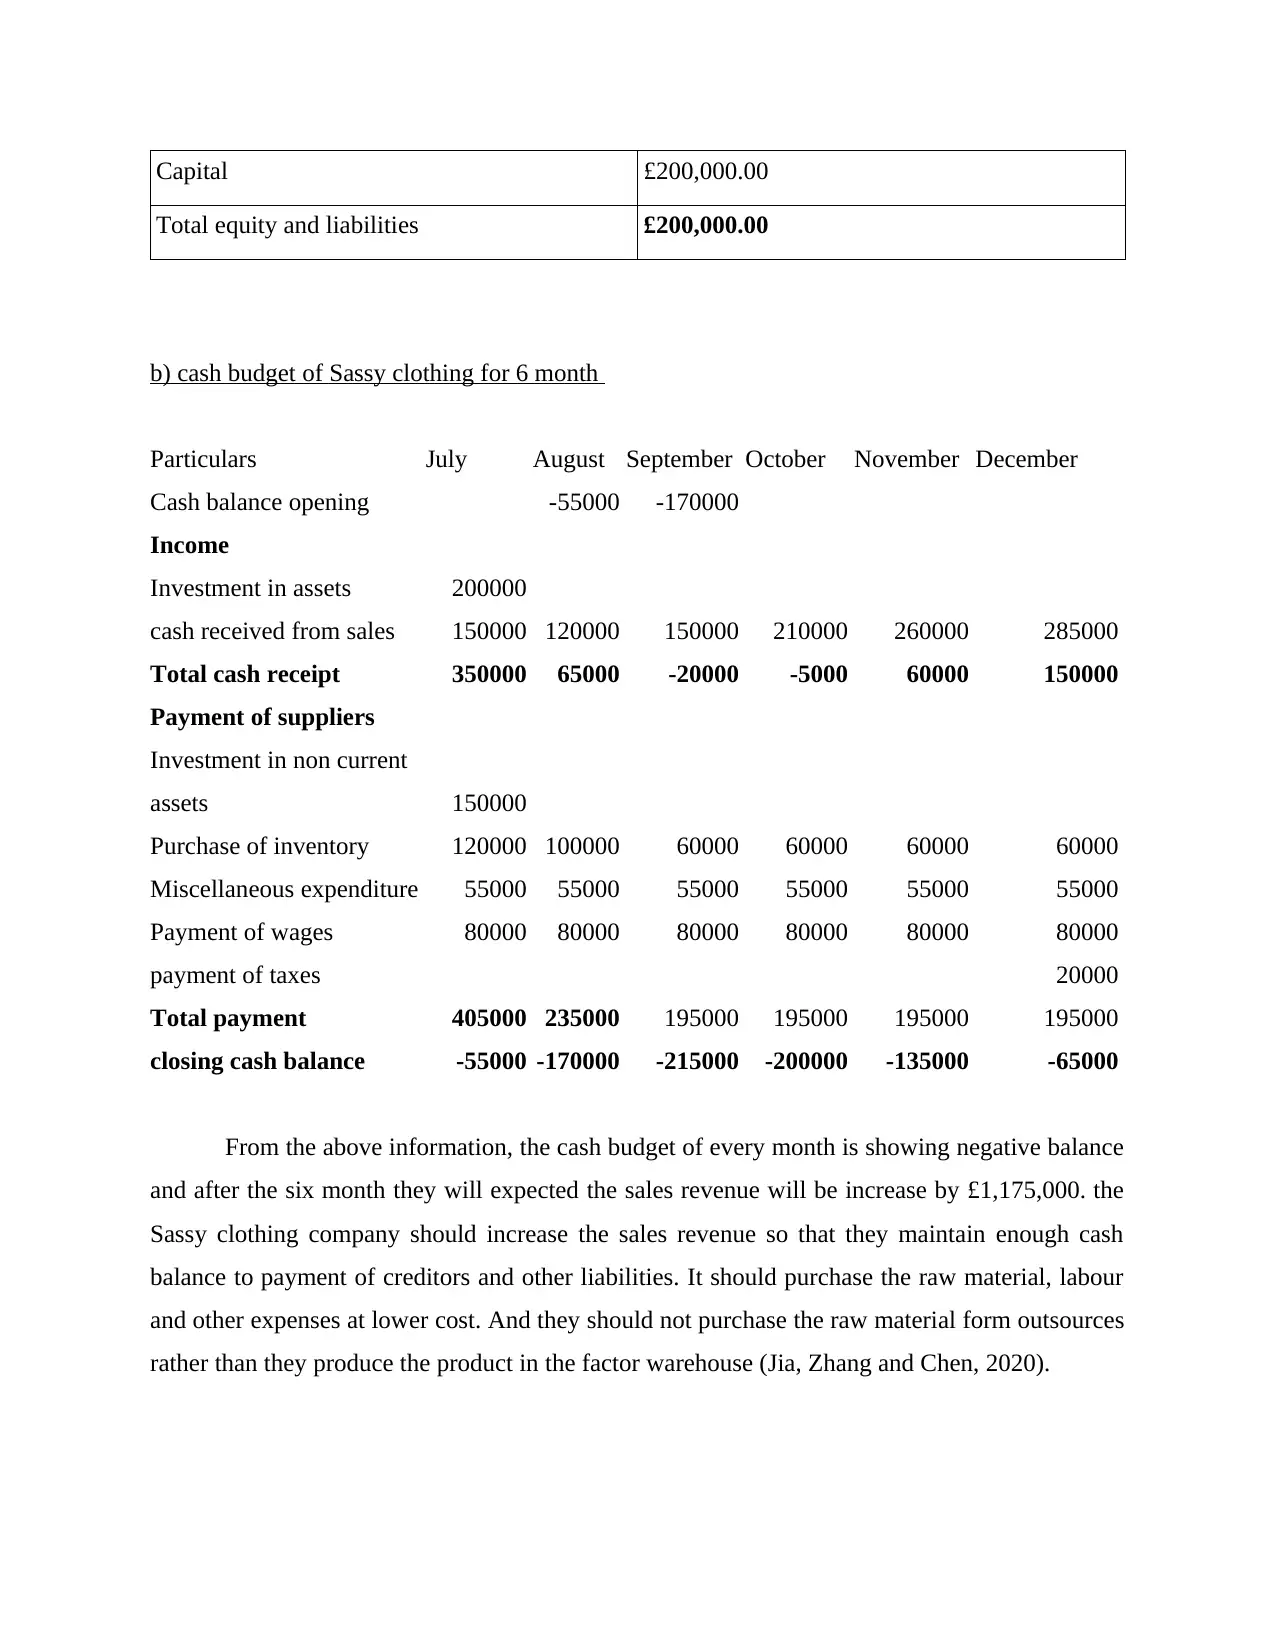
Capital £200,000.00
Total equity and liabilities £200,000.00
b) cash budget of Sassy clothing for 6 month
Particulars July August September October November December
Cash balance opening -55000 -170000
Income
Investment in assets 200000
cash received from sales 150000 120000 150000 210000 260000 285000
Total cash receipt 350000 65000 -20000 -5000 60000 150000
Payment of suppliers
Investment in non current
assets 150000
Purchase of inventory 120000 100000 60000 60000 60000 60000
Miscellaneous expenditure 55000 55000 55000 55000 55000 55000
Payment of wages 80000 80000 80000 80000 80000 80000
payment of taxes 20000
Total payment 405000 235000 195000 195000 195000 195000
closing cash balance -55000 -170000 -215000 -200000 -135000 -65000
From the above information, the cash budget of every month is showing negative balance
and after the six month they will expected the sales revenue will be increase by £1,175,000. the
Sassy clothing company should increase the sales revenue so that they maintain enough cash
balance to payment of creditors and other liabilities. It should purchase the raw material, labour
and other expenses at lower cost. And they should not purchase the raw material form outsources
rather than they produce the product in the factor warehouse (Jia, Zhang and Chen, 2020).
Paraphrase This Document
Need a fresh take? Get an instant paraphrase of this document with our AI Paraphraser
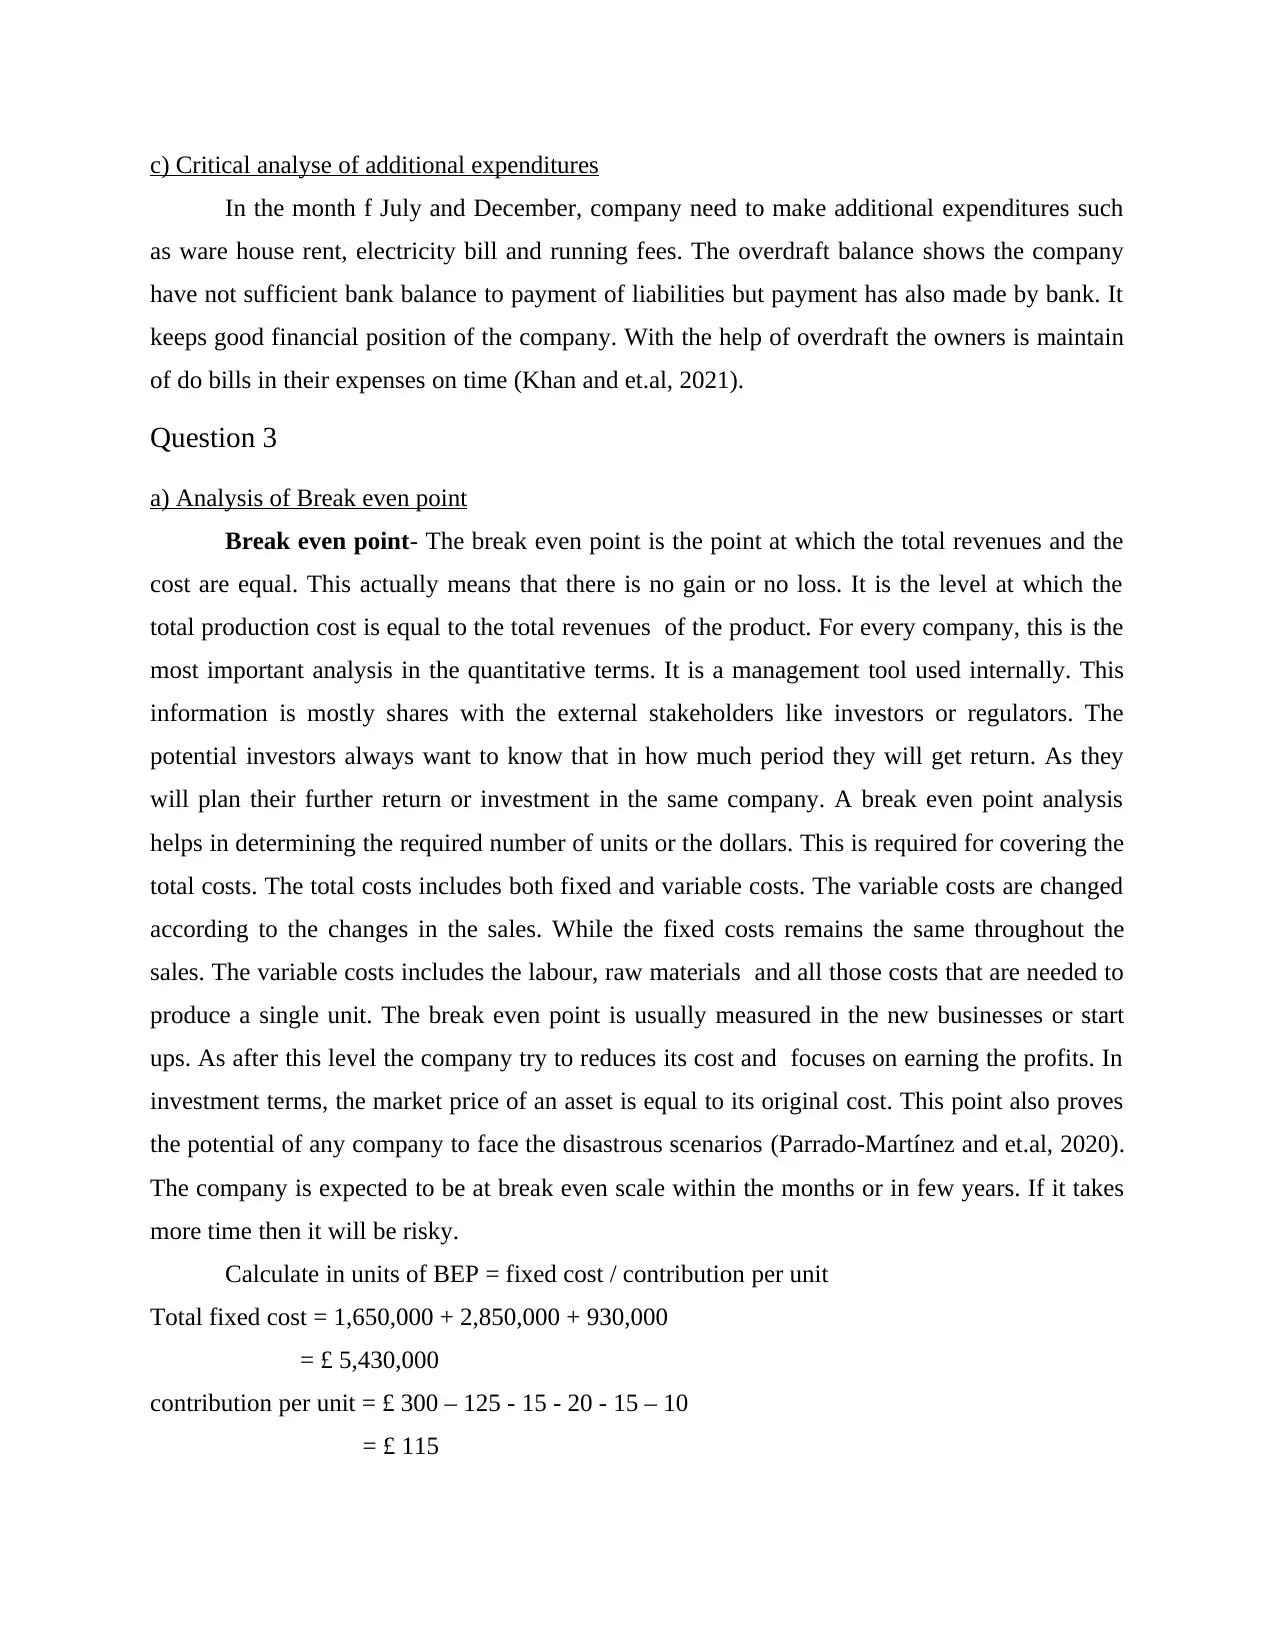
c) Critical analyse of additional expenditures
In the month f July and December, company need to make additional expenditures such
as ware house rent, electricity bill and running fees. The overdraft balance shows the company
have not sufficient bank balance to payment of liabilities but payment has also made by bank. It
keeps good financial position of the company. With the help of overdraft the owners is maintain
of do bills in their expenses on time (Khan and et.al, 2021).
Question 3
a) Analysis of Break even point
Break even point- The break even point is the point at which the total revenues and the
cost are equal. This actually means that there is no gain or no loss. It is the level at which the
total production cost is equal to the total revenues of the product. For every company, this is the
most important analysis in the quantitative terms. It is a management tool used internally. This
information is mostly shares with the external stakeholders like investors or regulators. The
potential investors always want to know that in how much period they will get return. As they
will plan their further return or investment in the same company. A break even point analysis
helps in determining the required number of units or the dollars. This is required for covering the
total costs. The total costs includes both fixed and variable costs. The variable costs are changed
according to the changes in the sales. While the fixed costs remains the same throughout the
sales. The variable costs includes the labour, raw materials and all those costs that are needed to
produce a single unit. The break even point is usually measured in the new businesses or start
ups. As after this level the company try to reduces its cost and focuses on earning the profits. In
investment terms, the market price of an asset is equal to its original cost. This point also proves
the potential of any company to face the disastrous scenarios (Parrado-Martínez and et.al, 2020).
The company is expected to be at break even scale within the months or in few years. If it takes
more time then it will be risky.
Calculate in units of BEP = fixed cost / contribution per unit
Total fixed cost = 1,650,000 + 2,850,000 + 930,000
= £ 5,430,000
contribution per unit = £ 300 – 125 - 15 - 20 - 15 – 10
= £ 115
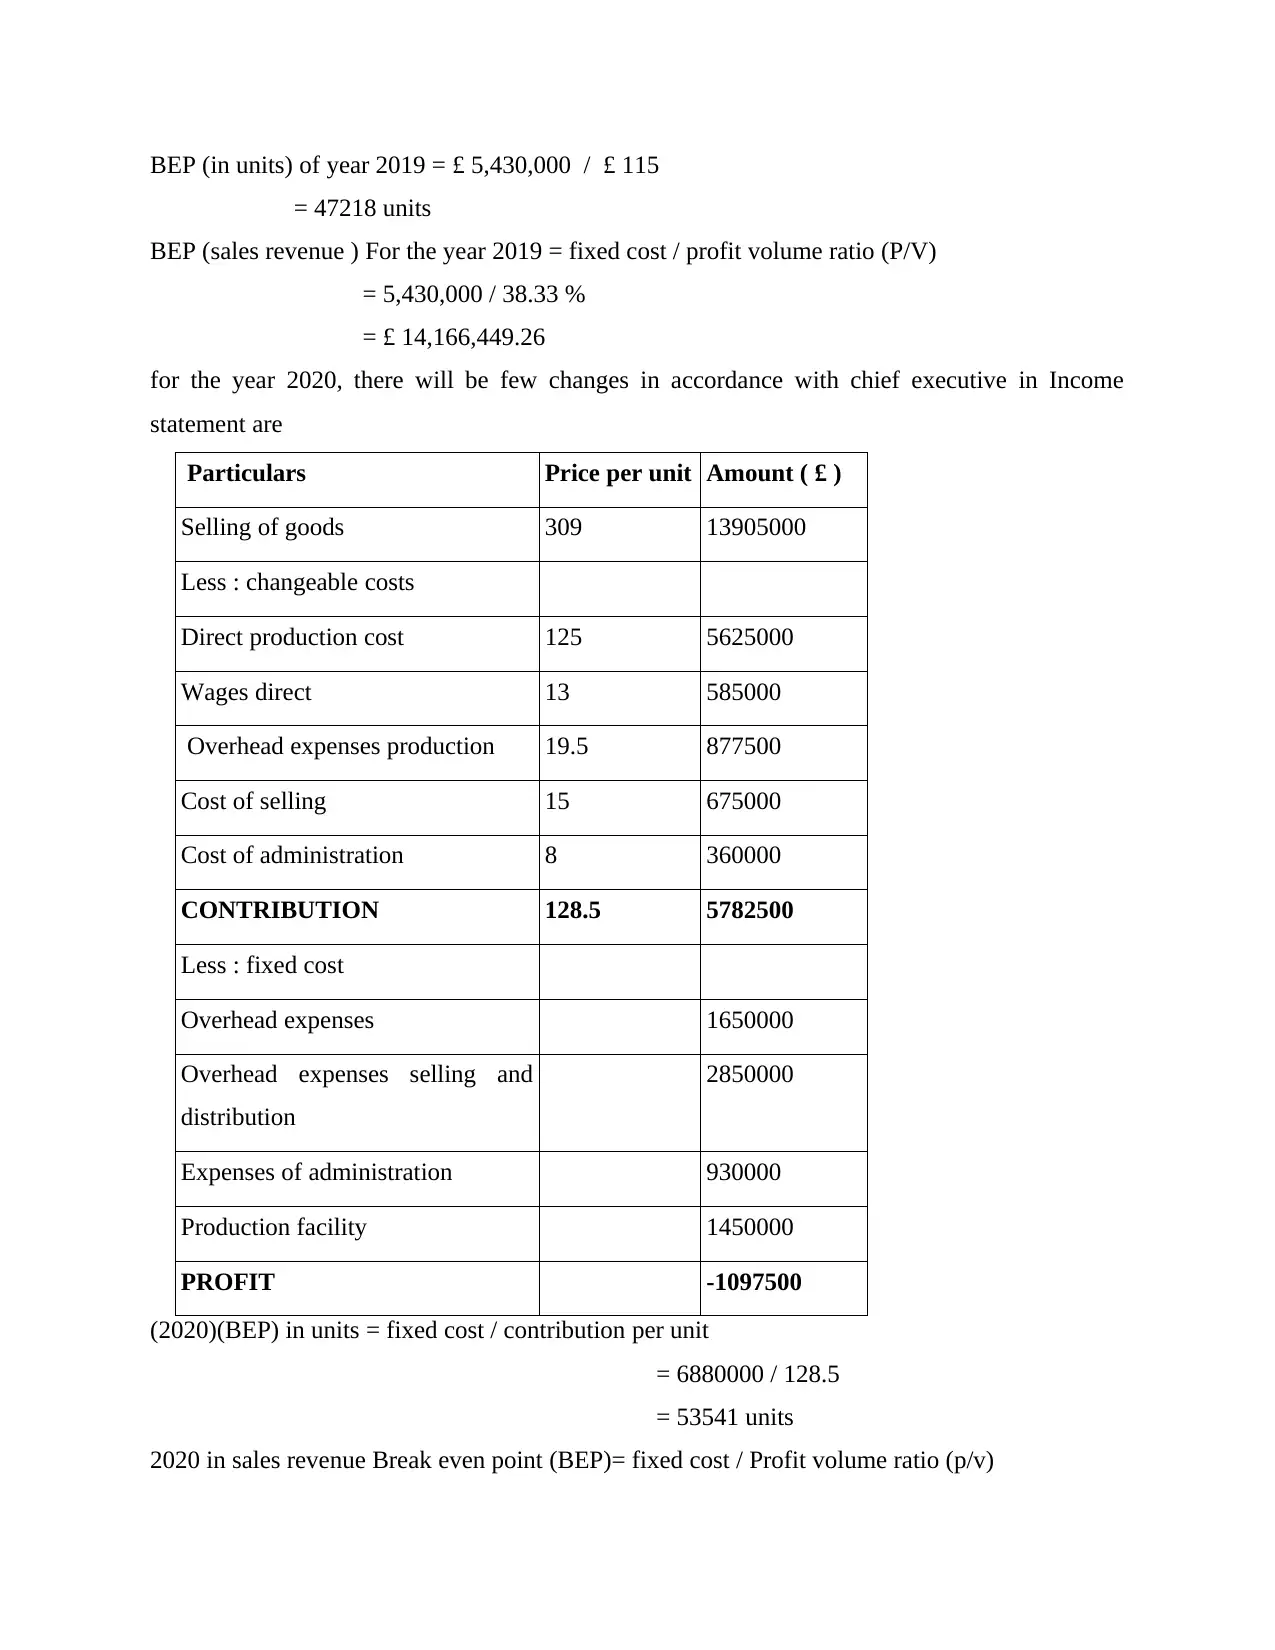
BEP (in units) of year 2019 = £ 5,430,000 / £ 115
= 47218 units
BEP (sales revenue ) For the year 2019 = fixed cost / profit volume ratio (P/V)
= 5,430,000 / 38.33 %
= £ 14,166,449.26
for the year 2020, there will be few changes in accordance with chief executive in Income
statement are
Particulars Price per unit Amount ( £ )
Selling of goods 309 13905000
Less : changeable costs
Direct production cost 125 5625000
Wages direct 13 585000
Overhead expenses production 19.5 877500
Cost of selling 15 675000
Cost of administration 8 360000
CONTRIBUTION 128.5 5782500
Less : fixed cost
Overhead expenses 1650000
Overhead expenses selling and
distribution
2850000
Expenses of administration 930000
Production facility 1450000
PROFIT -1097500
(2020)(BEP) in units = fixed cost / contribution per unit
= 6880000 / 128.5
= 53541 units
2020 in sales revenue Break even point (BEP)= fixed cost / Profit volume ratio (p/v)
⊘ This is a preview!⊘
Do you want full access?
Subscribe today to unlock all pages.
Trusted by 1+ million students worldwide
= 6880000 / 41.59 %
= £ 16542438.09
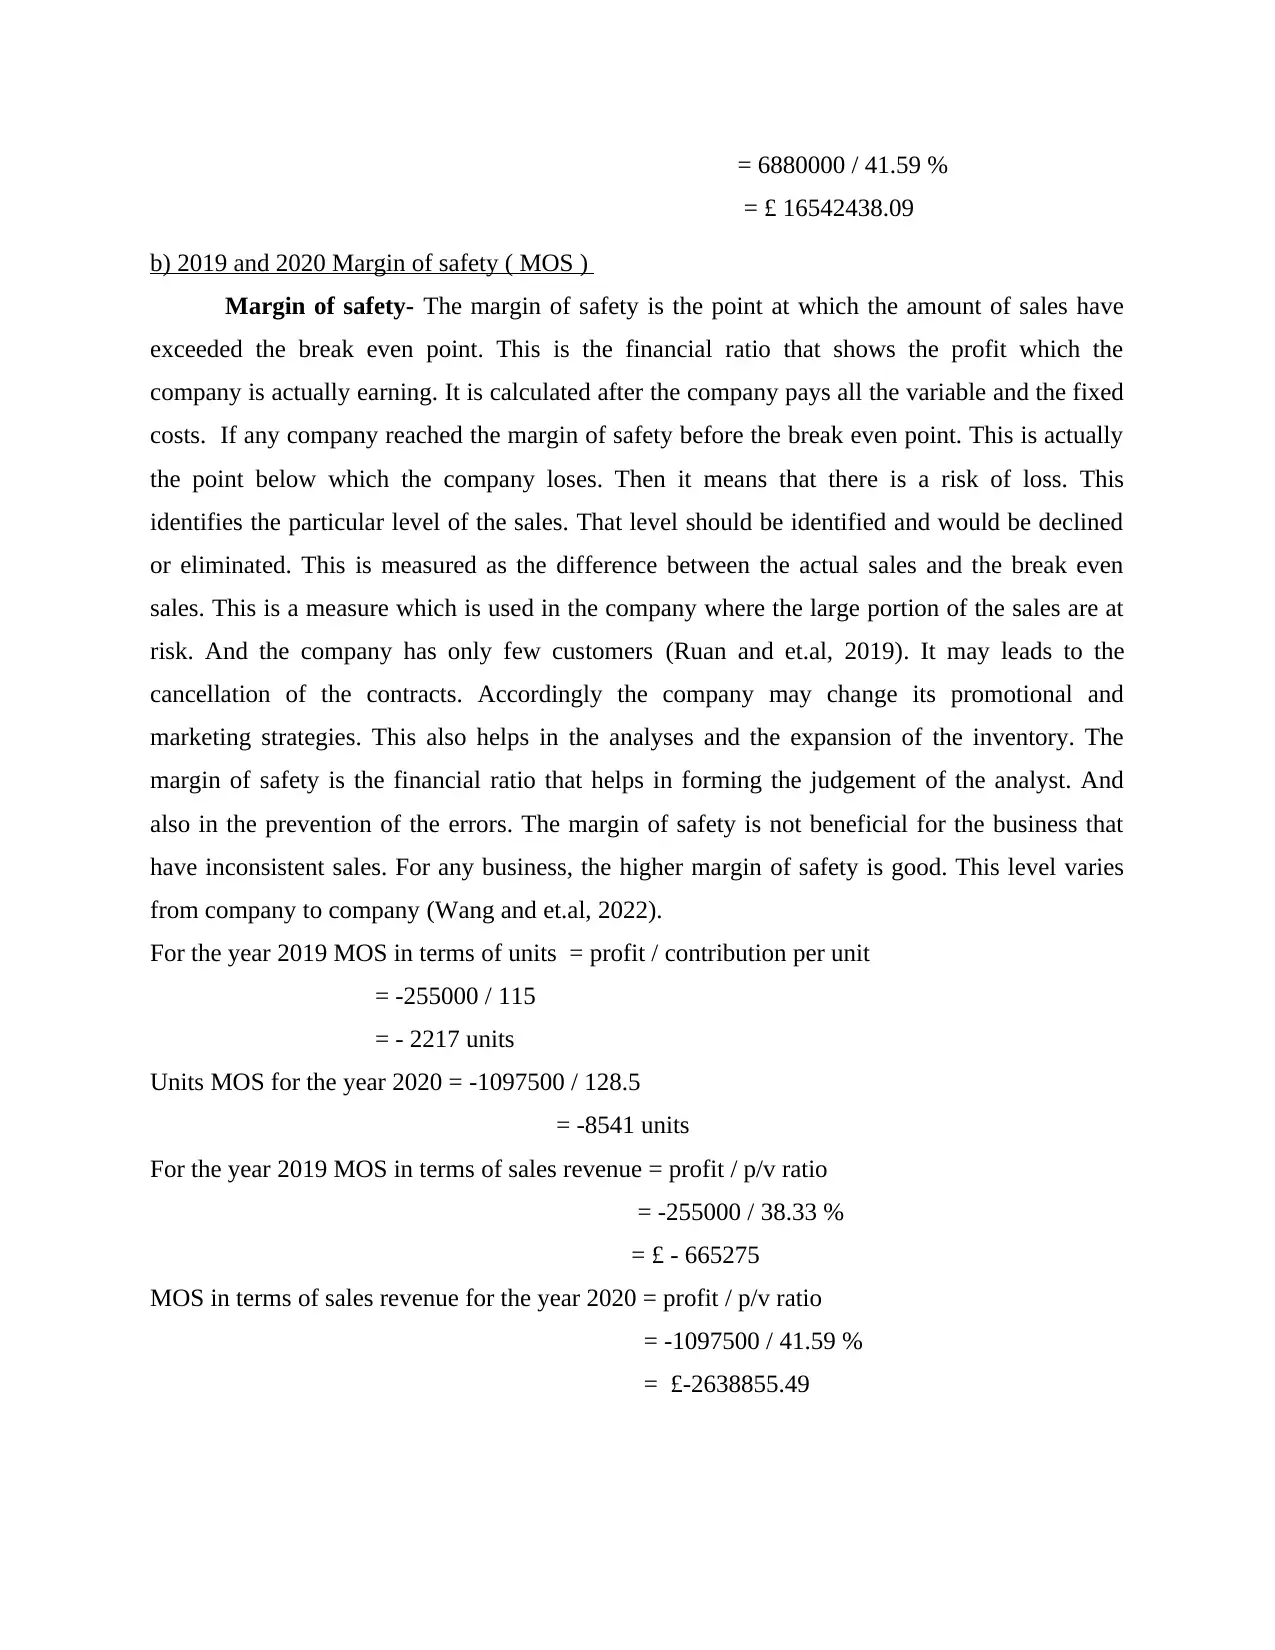
b) 2019 and 2020 Margin of safety ( MOS )
Margin of safety- The margin of safety is the point at which the amount of sales have
exceeded the break even point. This is the financial ratio that shows the profit which the
company is actually earning. It is calculated after the company pays all the variable and the fixed
costs. If any company reached the margin of safety before the break even point. This is actually
the point below which the company loses. Then it means that there is a risk of loss. This
identifies the particular level of the sales. That level should be identified and would be declined
or eliminated. This is measured as the difference between the actual sales and the break even
sales. This is a measure which is used in the company where the large portion of the sales are at
risk. And the company has only few customers (Ruan and et.al, 2019). It may leads to the
cancellation of the contracts. Accordingly the company may change its promotional and
marketing strategies. This also helps in the analyses and the expansion of the inventory. The
margin of safety is the financial ratio that helps in forming the judgement of the analyst. And
also in the prevention of the errors. The margin of safety is not beneficial for the business that
have inconsistent sales. For any business, the higher margin of safety is good. This level varies
from company to company (Wang and et.al, 2022).
For the year 2019 MOS in terms of units = profit / contribution per unit
= -255000 / 115
= - 2217 units
Units MOS for the year 2020 = -1097500 / 128.5
= -8541 units
For the year 2019 MOS in terms of sales revenue = profit / p/v ratio
= -255000 / 38.33 %
= £ - 665275
MOS in terms of sales revenue for the year 2020 = profit / p/v ratio
= -1097500 / 41.59 %
= £-2638855.49
= £ 16542438.09
b) 2019 and 2020 Margin of safety ( MOS )
Margin of safety- The margin of safety is the point at which the amount of sales have
exceeded the break even point. This is the financial ratio that shows the profit which the
company is actually earning. It is calculated after the company pays all the variable and the fixed
costs. If any company reached the margin of safety before the break even point. This is actually
the point below which the company loses. Then it means that there is a risk of loss. This
identifies the particular level of the sales. That level should be identified and would be declined
or eliminated. This is measured as the difference between the actual sales and the break even
sales. This is a measure which is used in the company where the large portion of the sales are at
risk. And the company has only few customers (Ruan and et.al, 2019). It may leads to the
cancellation of the contracts. Accordingly the company may change its promotional and
marketing strategies. This also helps in the analyses and the expansion of the inventory. The
margin of safety is the financial ratio that helps in forming the judgement of the analyst. And
also in the prevention of the errors. The margin of safety is not beneficial for the business that
have inconsistent sales. For any business, the higher margin of safety is good. This level varies
from company to company (Wang and et.al, 2022).
For the year 2019 MOS in terms of units = profit / contribution per unit
= -255000 / 115
= - 2217 units
Units MOS for the year 2020 = -1097500 / 128.5
= -8541 units
For the year 2019 MOS in terms of sales revenue = profit / p/v ratio
= -255000 / 38.33 %
= £ - 665275
MOS in terms of sales revenue for the year 2020 = profit / p/v ratio
= -1097500 / 41.59 %
= £-2638855.49
Paraphrase This Document
Need a fresh take? Get an instant paraphrase of this document with our AI Paraphraser
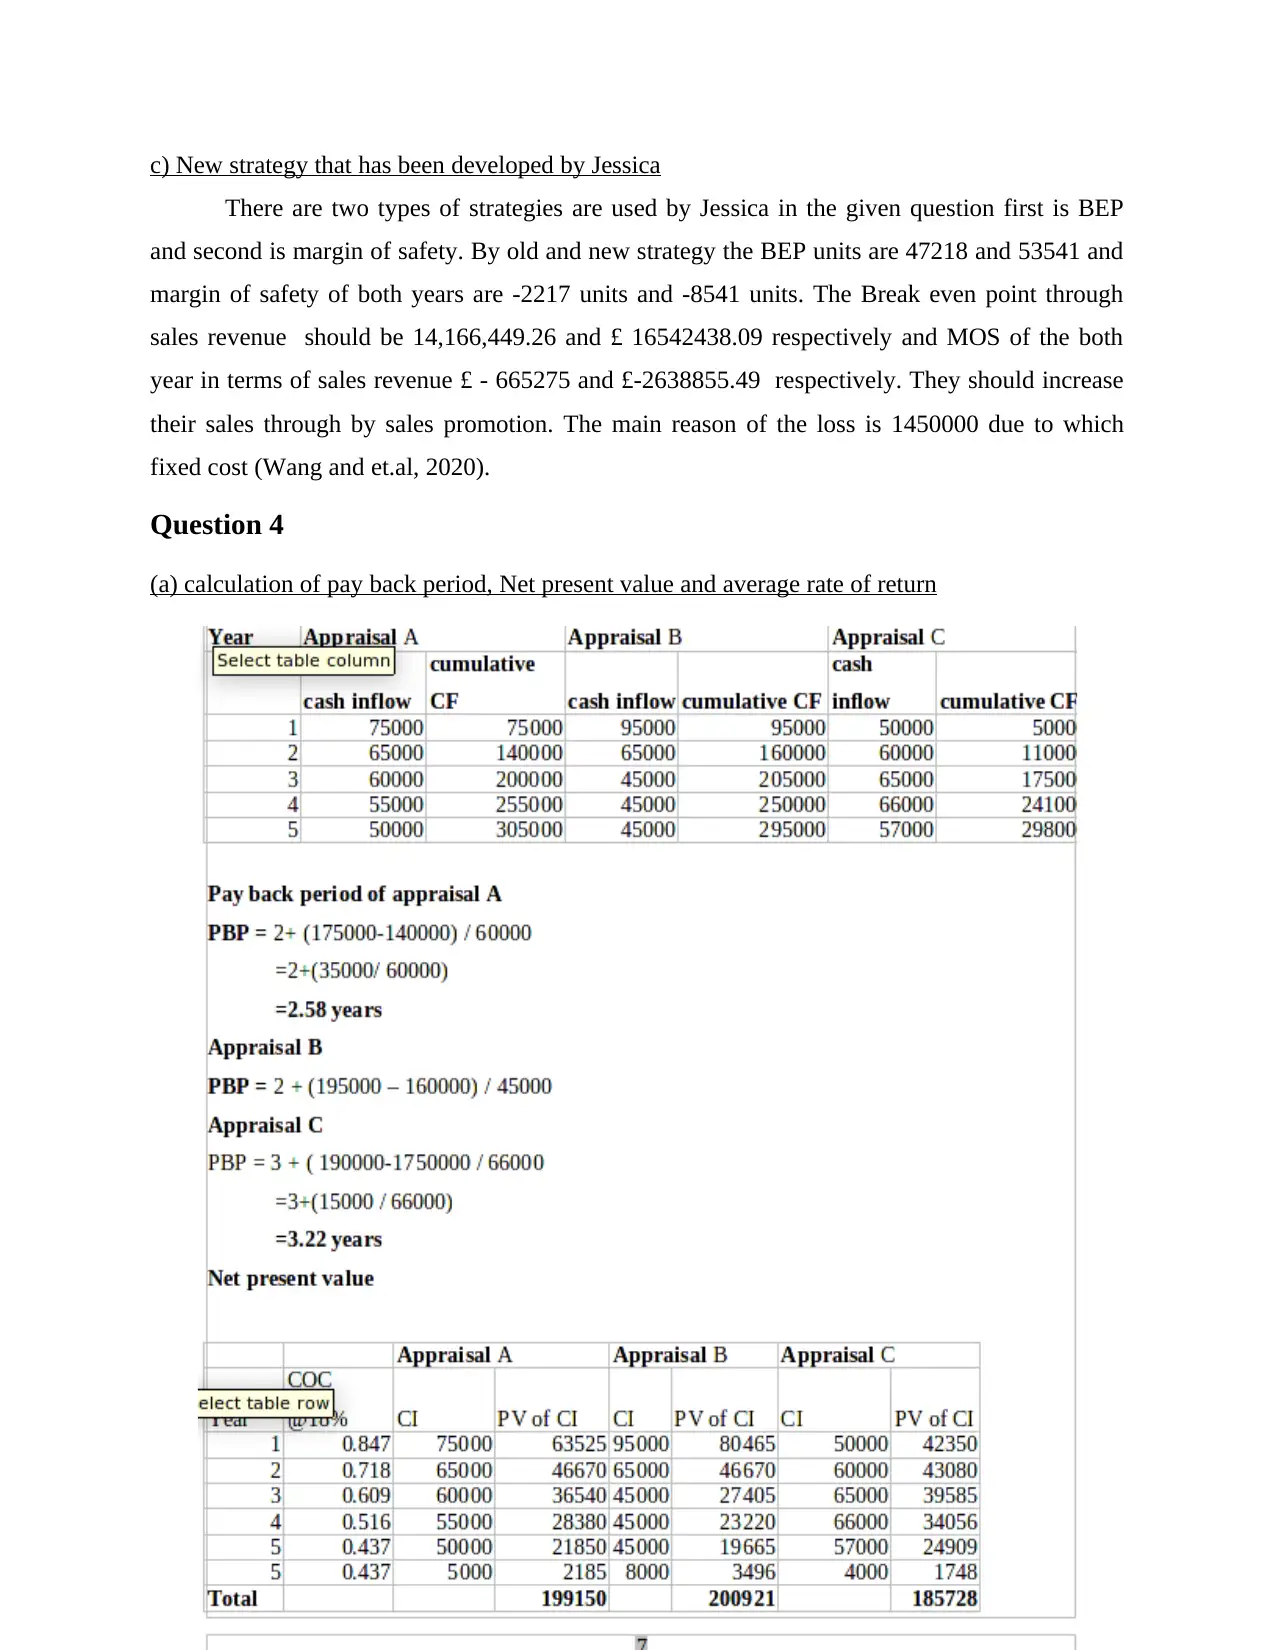
c) New strategy that has been developed by Jessica
There are two types of strategies are used by Jessica in the given question first is BEP
and second is margin of safety. By old and new strategy the BEP units are 47218 and 53541 and
margin of safety of both years are -2217 units and -8541 units. The Break even point through
sales revenue should be 14,166,449.26 and £ 16542438.09 respectively and MOS of the both
year in terms of sales revenue £ - 665275 and £-2638855.49 respectively. They should increase
their sales through by sales promotion. The main reason of the loss is 1450000 due to which
fixed cost (Wang and et.al, 2020).
Question 4
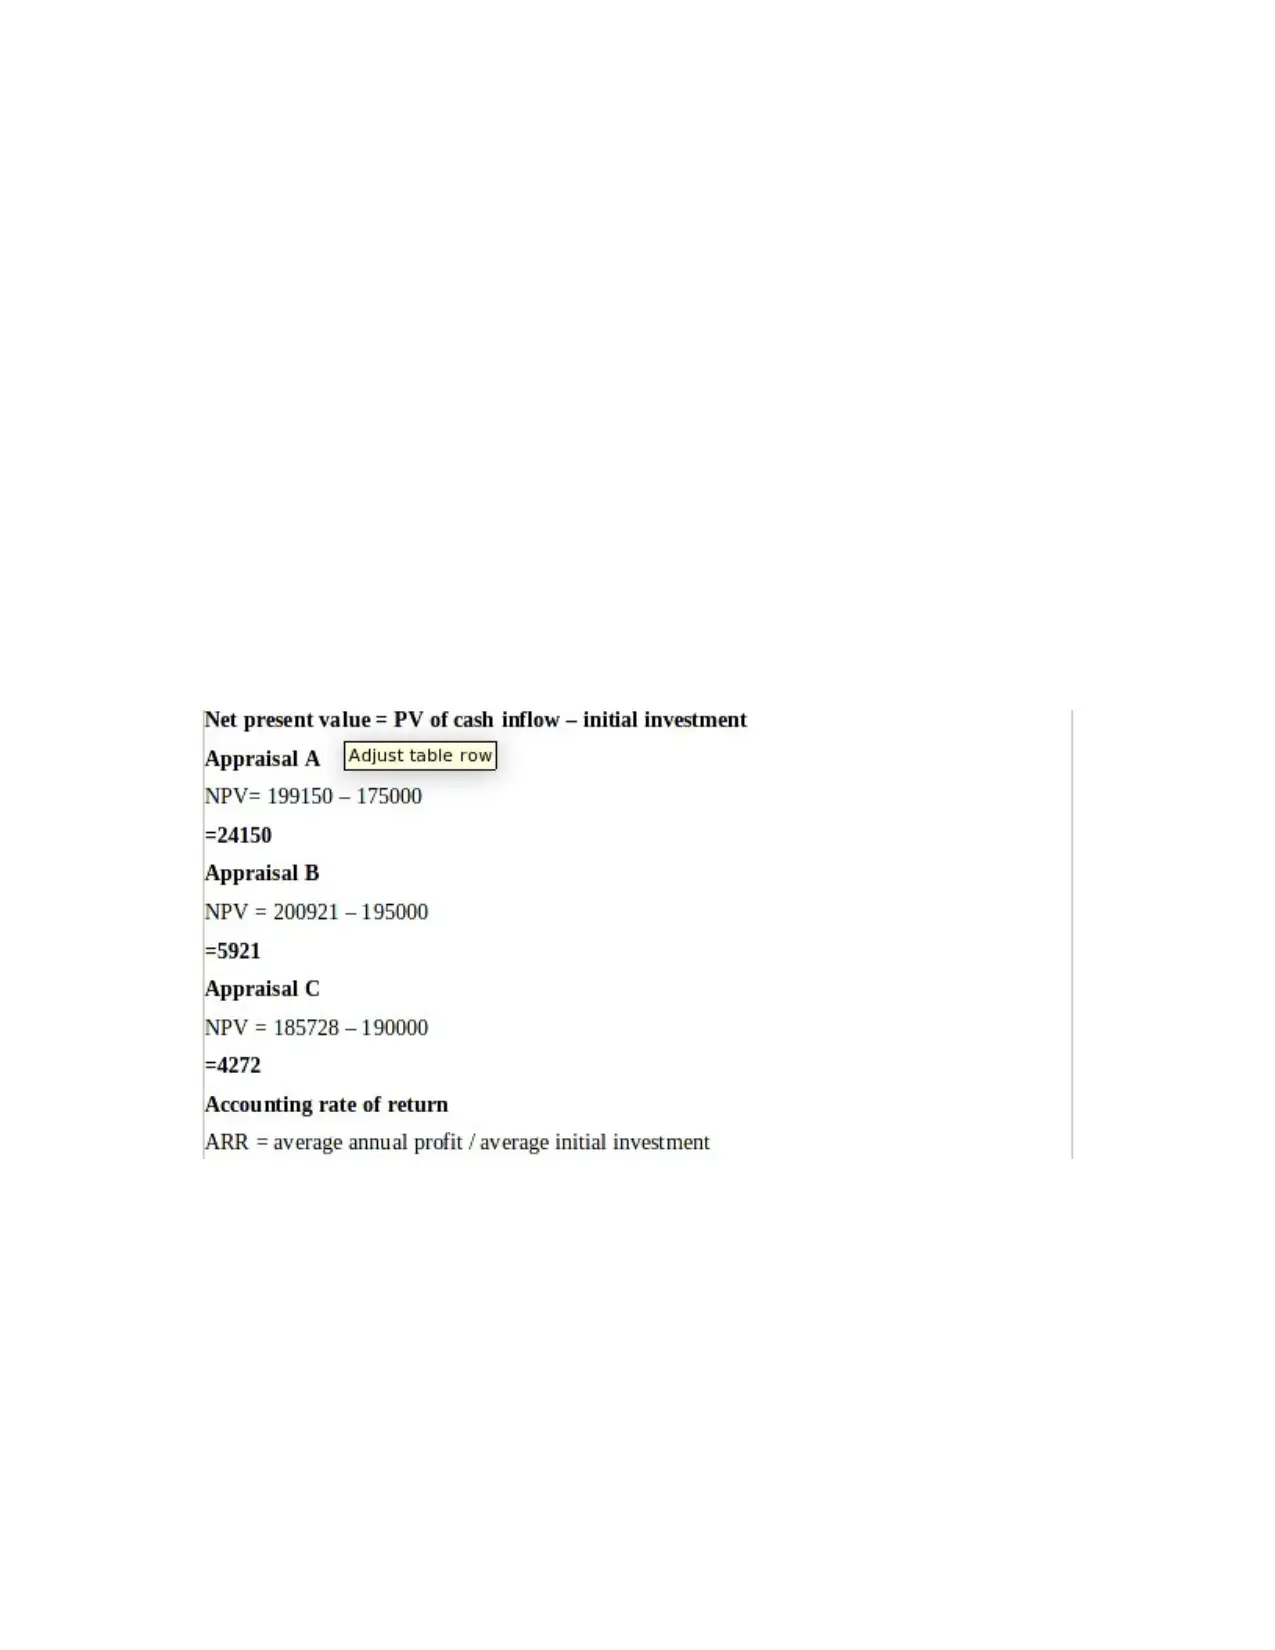
(a) calculation of pay back period, Net present value and average rate of return
There are two types of strategies are used by Jessica in the given question first is BEP
and second is margin of safety. By old and new strategy the BEP units are 47218 and 53541 and
margin of safety of both years are -2217 units and -8541 units. The Break even point through
sales revenue should be 14,166,449.26 and £ 16542438.09 respectively and MOS of the both
year in terms of sales revenue £ - 665275 and £-2638855.49 respectively. They should increase
their sales through by sales promotion. The main reason of the loss is 1450000 due to which
fixed cost (Wang and et.al, 2020).
Question 4
(a) calculation of pay back period, Net present value and average rate of return
⊘ This is a preview!⊘
Do you want full access?
Subscribe today to unlock all pages.
Trusted by 1+ million students worldwide
1 out of 17
Related Documents


Your All-in-One AI-Powered Toolkit for Academic Success.
+13062052269
info@desklib.com
Available 24*7 on WhatsApp / Email
![[object Object]](/_next/static/media/star-bottom.7253800d.svg)
Unlock your academic potential
Copyright © 2020–2026 A2Z Services. All Rights Reserved. Developed and managed by ZUCOL.