Business Decision Making: Applying Investment Appraisal Methods
VerifiedAdded on 2023/06/10
|13
|2982
|313
Essay
AI Summary
This essay delves into the realm of business decision-making, focusing on the application of investment appraisal techniques. Using Akwaaba Plc, a textile firm, as a case study, the analysis compares bag and shoe manufacturing projects through methods like payback period and net present value (NPV). The essay calculates the payback periods and NPVs for both projects, concluding that the shoe project (Project B) is more profitable due to its lower investment and higher NPV. It also identifies financial and non-financial factors influencing these decisions, such as budgeting, cost control, brand reputation, supplier collaboration, and risk management. Additionally, the essay covers statistical concepts like mean (grouped and ungrouped data), standard deviation, variance, Laspeyres Price Index (LPI), Paasche Price Index (PPI), and Internal Rate of Return (IRR), providing a comprehensive overview of financial analysis tools used in business investment decisions.

Essay on Business
Decision Making
Decision Making
Paraphrase This Document
Need a fresh take? Get an instant paraphrase of this document with our AI Paraphraser
Contents
MAIN BODY..................................................................................................................................3
TASK 1............................................................................................................................................3
Calculate the payback period of Akwaaba Plc............................................................................3
Compute the Net Present Value (NPV) of Akwaaba Plc............................................................4
Assessment of registered discoveries and independent direction:...............................................5
Determine the financial and non-financial variables that influenced your decision....................6
TASK 2............................................................................................................................................6
Mean of Grouped and Ungrouped data...........................................................................................6
Standard Deviation of Ungrouped Data..........................................................................................7
Variance...........................................................................................................................................7
Base-Weighted Index or Laspeyres Price Index (LPI)....................................................................8
Current Weighted Index or Paasche Price Index (PPI)...................................................................8
Internal Rate of Return....................................................................................................................9
CONCLUSION..............................................................................................................................11
REFERENCES..............................................................................................................................12
INTRODUCTION
Some decisions are made based on the analysis of outcomes. These decisions related to the
cash inflows and outflow and investing in any project helps in making better decisions through
the help of the investment appraisal techniques. In this report, the company Akwaaba Plc is taken
which is a textile firm that operates mostly in the United Kingdom as well as other European
countries. Leading to a lack of resources, Akwaaba Plc has outsourced its bag and shoe
manufacturing. The company must choose one product from the bag and shoe categories.
Expected profitability and performance of both products are examined in this research using
investment evaluation tools to identify financial and non-financial factors that influence decision
choice (Lang, Cleophas and Ehmke, 2021).
MAIN BODY
TASK 1
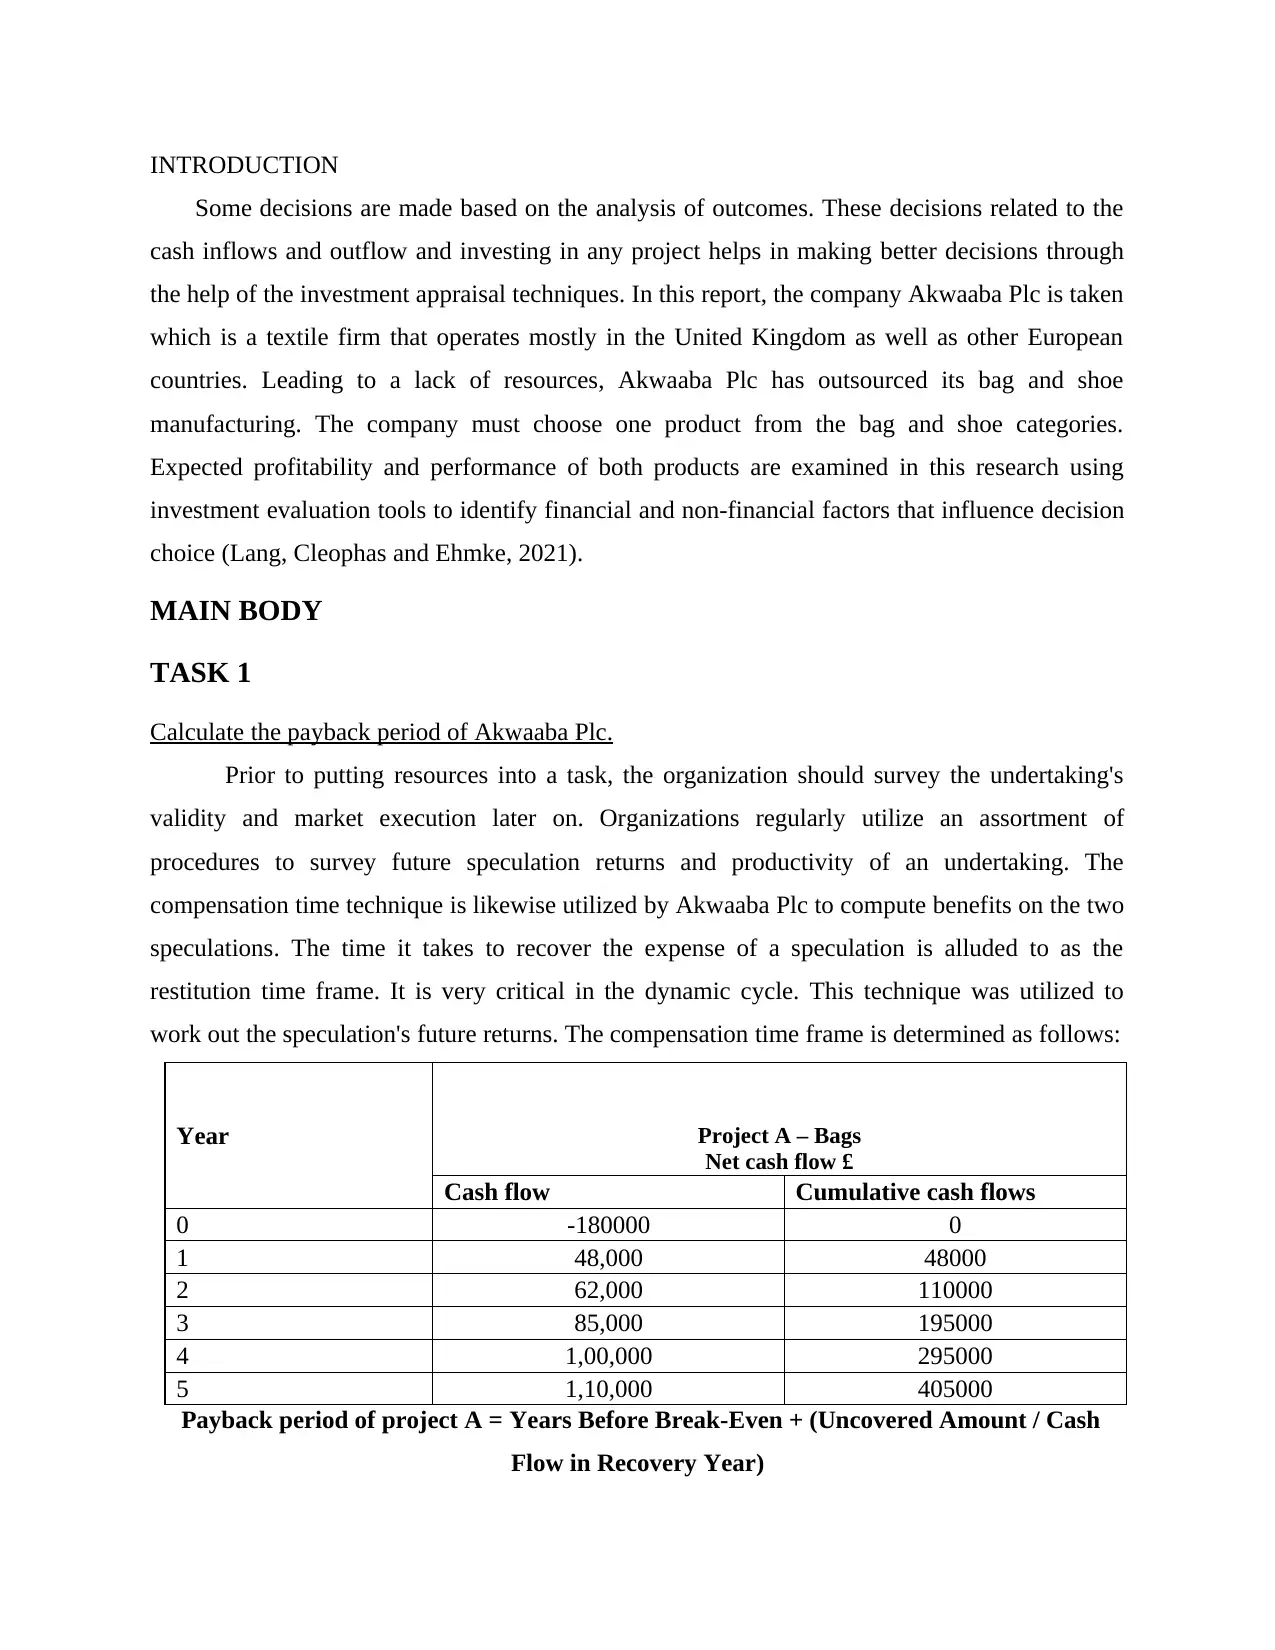
Calculate the payback period of Akwaaba Plc.
Prior to putting resources into a task, the organization should survey the undertaking's
validity and market execution later on. Organizations regularly utilize an assortment of
procedures to survey future speculation returns and productivity of an undertaking. The
compensation time technique is likewise utilized by Akwaaba Plc to compute benefits on the two
speculations. The time it takes to recover the expense of a speculation is alluded to as the
restitution time frame. It is very critical in the dynamic cycle. This technique was utilized to
work out the speculation's future returns. The compensation time frame is determined as follows:
Year Project A – Bags
Net cash flow £
Cash flow Cumulative cash flows
0 -180000 0
1 48,000 48000
2 62,000 110000
3 85,000 195000
4 1,00,000 295000
5 1,10,000 405000
Payback period of project A = Years Before Break-Even + (Uncovered Amount / Cash
Flow in Recovery Year)
Some decisions are made based on the analysis of outcomes. These decisions related to the
cash inflows and outflow and investing in any project helps in making better decisions through
the help of the investment appraisal techniques. In this report, the company Akwaaba Plc is taken
which is a textile firm that operates mostly in the United Kingdom as well as other European
countries. Leading to a lack of resources, Akwaaba Plc has outsourced its bag and shoe
manufacturing. The company must choose one product from the bag and shoe categories.
Expected profitability and performance of both products are examined in this research using
investment evaluation tools to identify financial and non-financial factors that influence decision
choice (Lang, Cleophas and Ehmke, 2021).
MAIN BODY
TASK 1
Calculate the payback period of Akwaaba Plc.
Prior to putting resources into a task, the organization should survey the undertaking's
validity and market execution later on. Organizations regularly utilize an assortment of
procedures to survey future speculation returns and productivity of an undertaking. The
compensation time technique is likewise utilized by Akwaaba Plc to compute benefits on the two
speculations. The time it takes to recover the expense of a speculation is alluded to as the
restitution time frame. It is very critical in the dynamic cycle. This technique was utilized to
work out the speculation's future returns. The compensation time frame is determined as follows:
Year Project A – Bags
Net cash flow £
Cash flow Cumulative cash flows
0 -180000 0
1 48,000 48000
2 62,000 110000
3 85,000 195000
4 1,00,000 295000
5 1,10,000 405000
Payback period of project A = Years Before Break-Even + (Uncovered Amount / Cash
Flow in Recovery Year)
⊘ This is a preview!⊘
Do you want full access?
Subscribe today to unlock all pages.
Trusted by 1+ million students worldwide
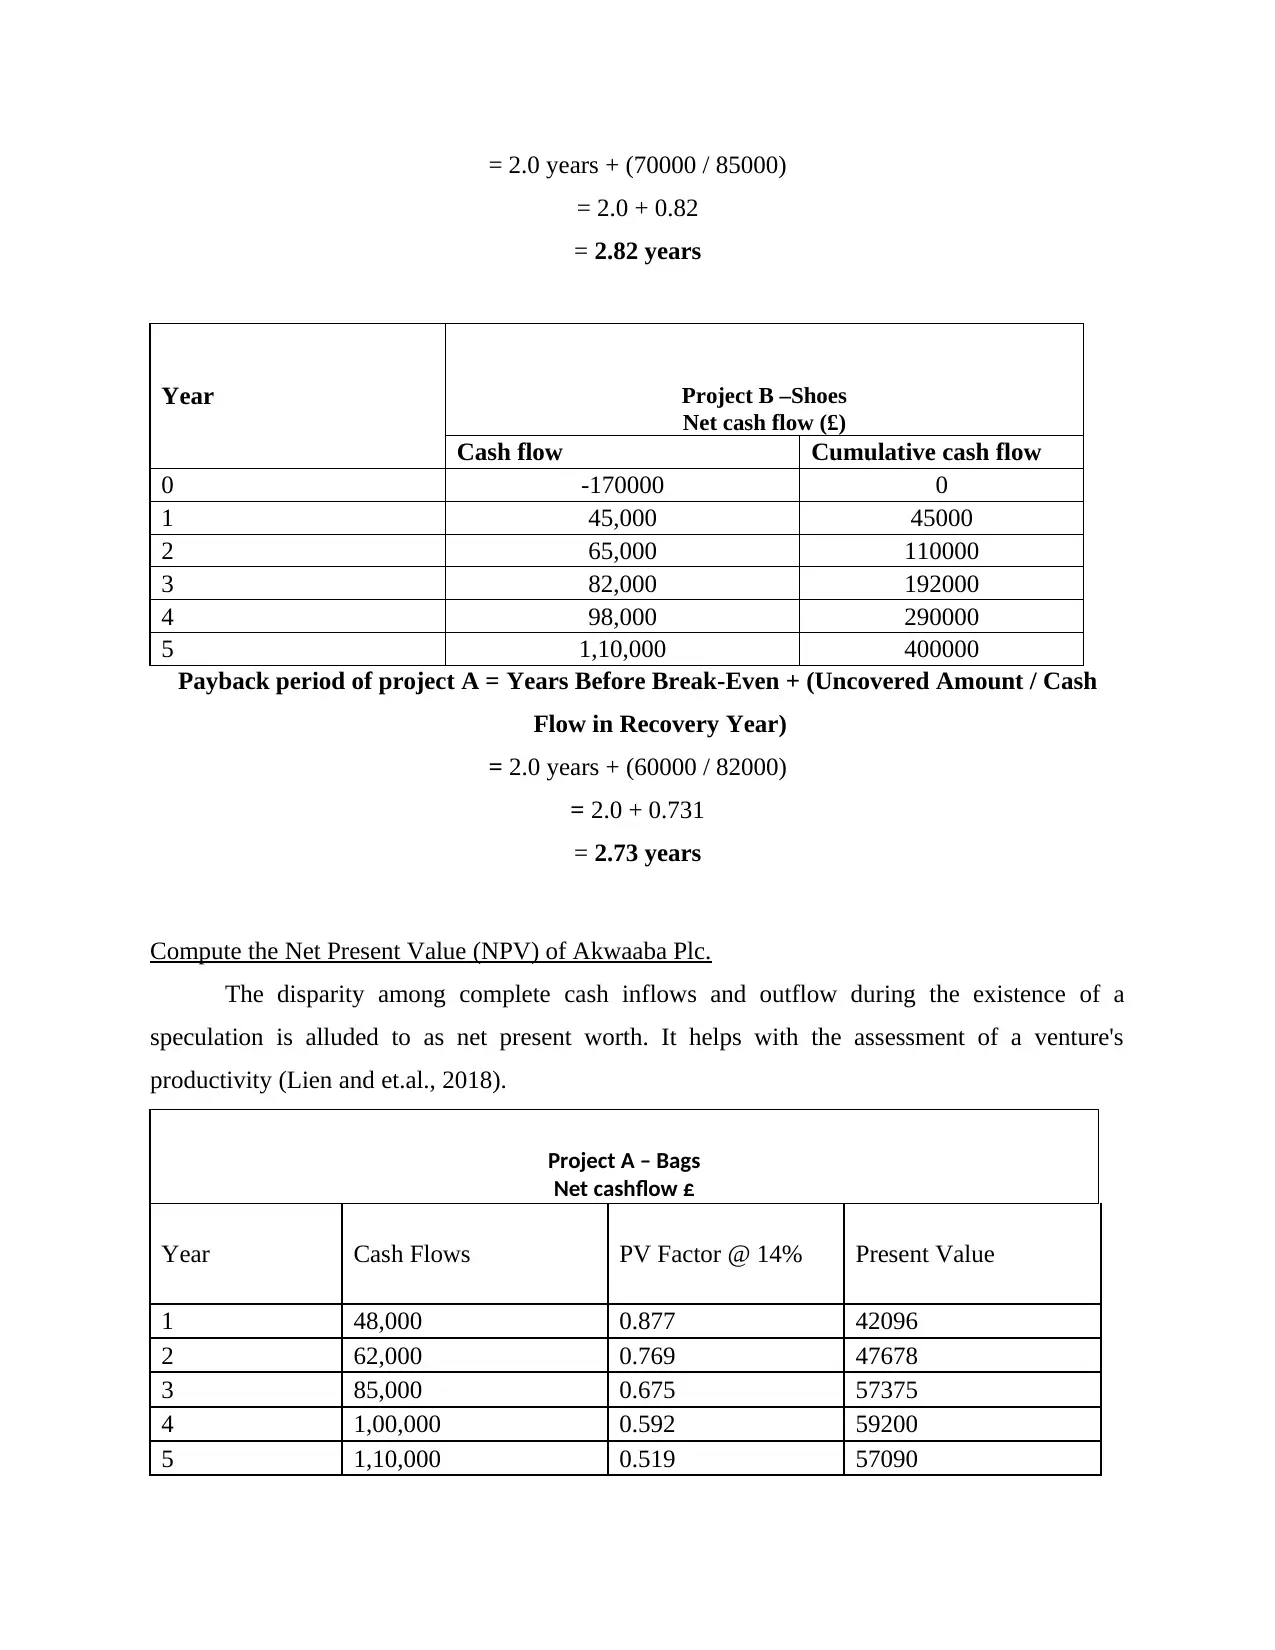
= 2.0 years + (70000 / 85000)
= 2.0 + 0.82
= 2.82 years
Year Project B –Shoes
Net cash flow (£)
Cash flow Cumulative cash flow
0 -170000 0
1 45,000 45000
2 65,000 110000
3 82,000 192000
4 98,000 290000
5 1,10,000 400000
Payback period of project A = Years Before Break-Even + (Uncovered Amount / Cash
Flow in Recovery Year)
= 2.0 years + (60000 / 82000)
= 2.0 + 0.731
= 2.73 years
Compute the Net Present Value (NPV) of Akwaaba Plc.
The disparity among complete cash inflows and outflow during the existence of a
speculation is alluded to as net present worth. It helps with the assessment of a venture's
productivity (Lien and et.al., 2018).
Project A – Bags
Net cashflow £
Year Cash Flows PV Factor @ 14% Present Value
1 48,000 0.877 42096
2 62,000 0.769 47678
3 85,000 0.675 57375
4 1,00,000 0.592 59200
5 1,10,000 0.519 57090
Paraphrase This Document
Need a fresh take? Get an instant paraphrase of this document with our AI Paraphraser
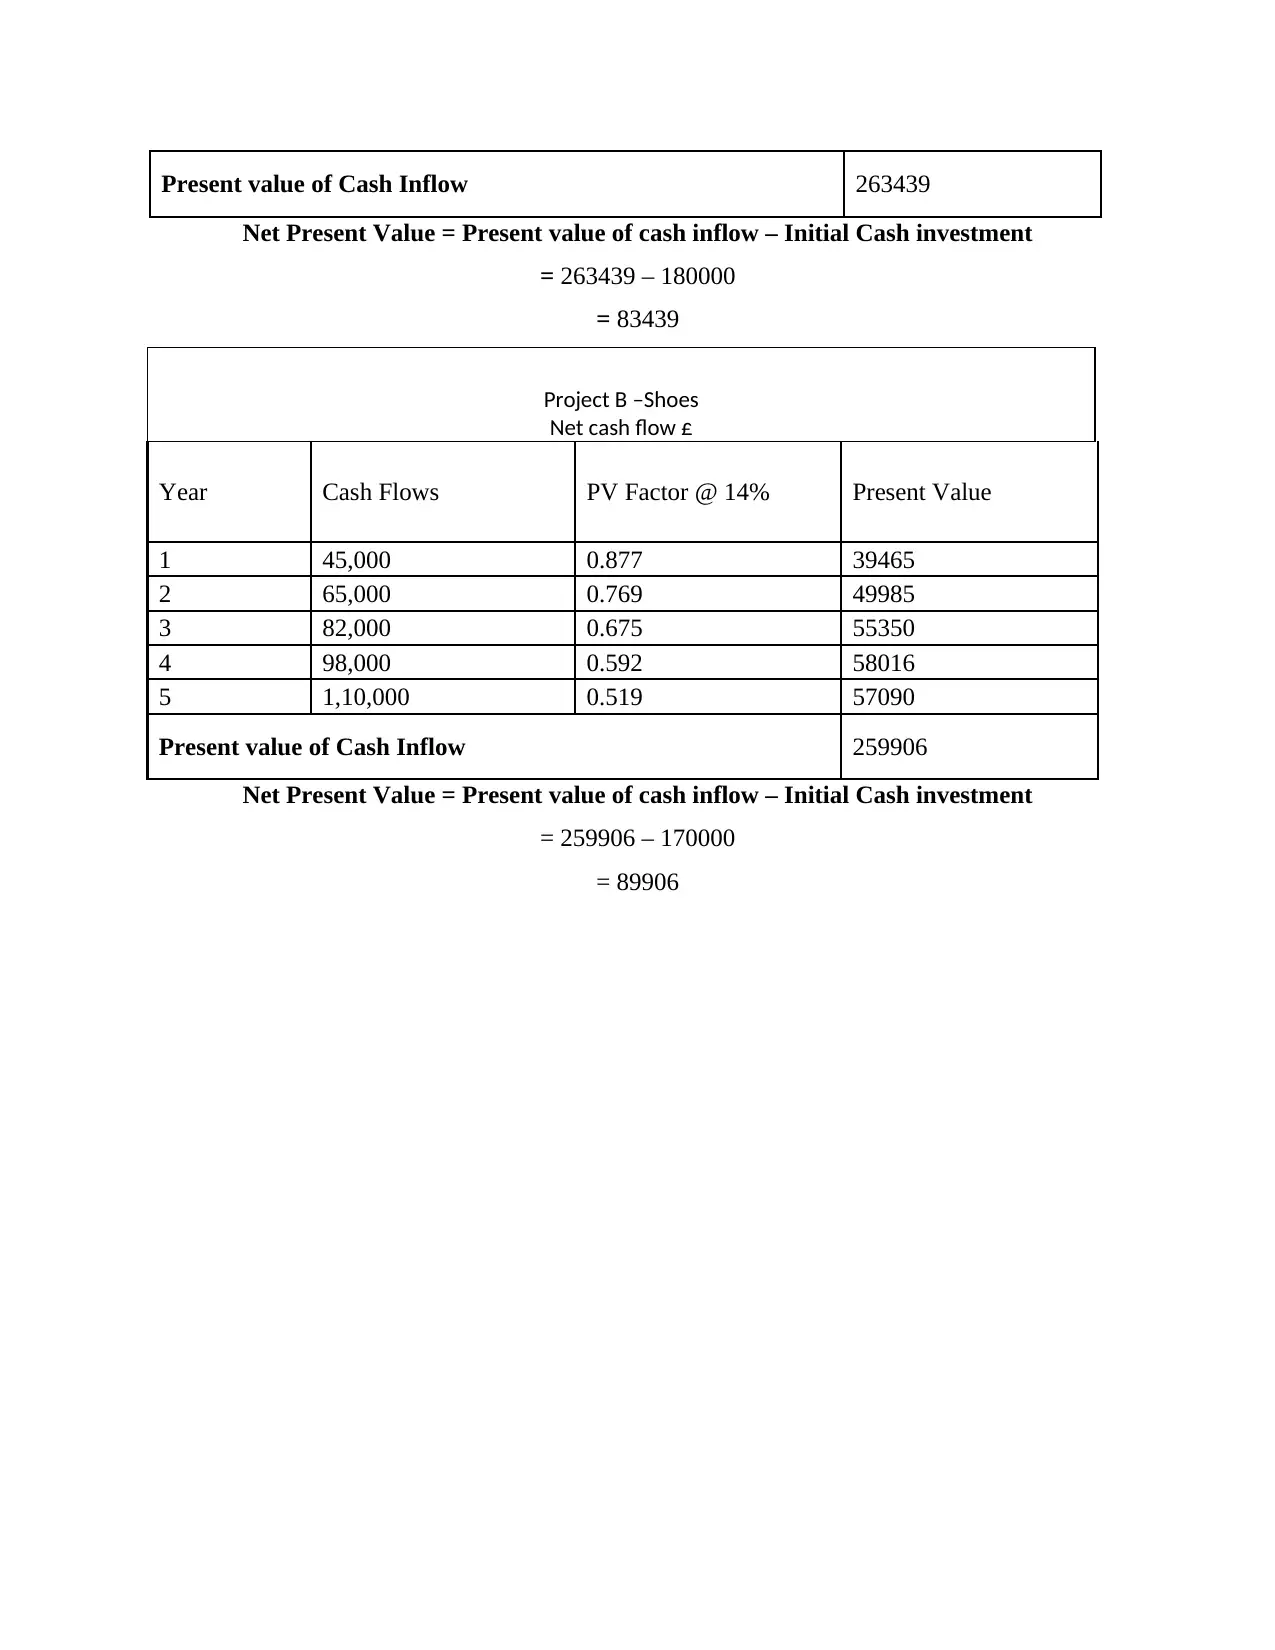
Present value of Cash Inflow 263439
Net Present Value = Present value of cash inflow – Initial Cash investment
= 263439 – 180000
= 83439
Project B –Shoes
Net cash flow £
Year Cash Flows PV Factor @ 14% Present Value
1 45,000 0.877 39465
2 65,000 0.769 49985
3 82,000 0.675 55350
4 98,000 0.592 58016
5 1,10,000 0.519 57090
Present value of Cash Inflow 259906
Net Present Value = Present value of cash inflow – Initial Cash investment
= 259906 – 170000
= 89906
Net Present Value = Present value of cash inflow – Initial Cash investment
= 263439 – 180000
= 83439
Project B –Shoes
Net cash flow £
Year Cash Flows PV Factor @ 14% Present Value
1 45,000 0.877 39465
2 65,000 0.769 49985
3 82,000 0.675 55350
4 98,000 0.592 58016
5 1,10,000 0.519 57090
Present value of Cash Inflow 259906
Net Present Value = Present value of cash inflow – Initial Cash investment
= 259906 – 170000
= 89906
Assessment of registered discoveries and independent direction:
From the calculations performed above, investment appraisal techniques are utilized to evaluate
the future presentation of the two tasks. Restitution period and net present worth strategies are
utilized to decide the best expected venture for future productivity. The two systems work on the
dynamic cycle. These strategies help Akwaaba Plc in settling on two tasks: a sack project and a
shoe project. The two activities have an equivalent restitution length, but project A has a higher
speculation than project B, demonstrating that the shoe project is more dependable than the sack
project. The net present worth of task A 83439 is lower than that of undertaking B 89906, it is
more important to demonstrate that project B. A higher net present value indicates that the
projects are performing well. According to both methods, project B is the more profitable option
for Akwaaba Plc. The company must decide whether to pursue Project B, which is the shoe
business. It also mentions the importance of investment appraisal methodologies in the decision-
making process (Lu and et.al., 2019).
Determine the financial and non-financial variables that influenced your decision.
Financial Factors:
It benefits in the budgeting and control of project costs and expenses.
It aids in the production of higher-quality products while reducing resource waste.
It helps in the analysis of a company's financial performance as well as the enhancement
of brand value and reputation.
It supports in the achievement of objectives in a shorter time frame.
Non – Financial Factors:
It improves the company's reputation by enhancing the monitoring system.
It allows suppliers and customers to work together effectively.
It gives the company the ability to deal with future risks and uncertainties.
It motivates employees, which improves their performance (Zhao and et.al., 2021).
TASK 2
Mean of Grouped and Ungrouped data.
⊘ This is a preview!⊘
Do you want full access?
Subscribe today to unlock all pages.
Trusted by 1+ million students worldwide
The mean is characterized by the number of perceptions divided by the complete number of
perceptions. There are two different equations for calculating the average of ungrouped
information and the average of grouped data.
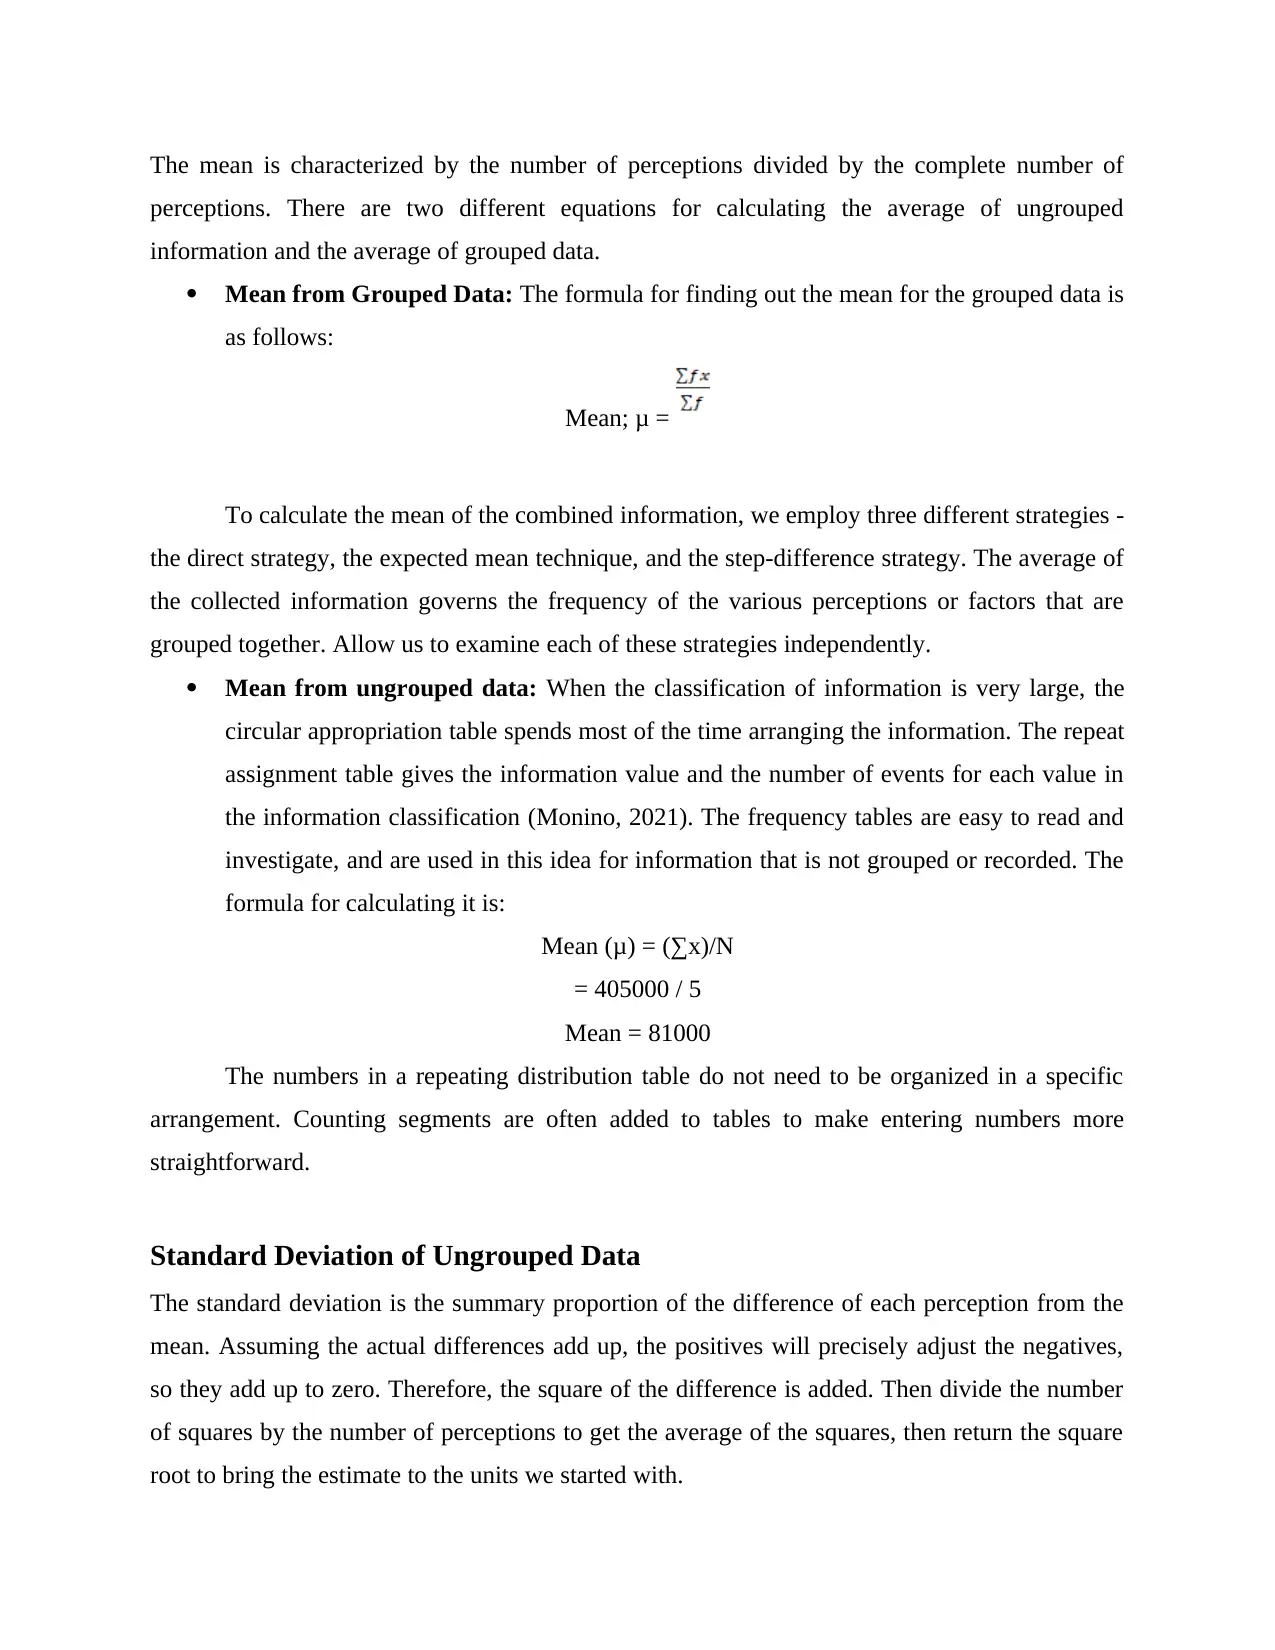
Mean from Grouped Data: The formula for finding out the mean for the grouped data is
as follows:
Mean; μ =
To calculate the mean of the combined information, we employ three different strategies -
the direct strategy, the expected mean technique, and the step-difference strategy. The average of
the collected information governs the frequency of the various perceptions or factors that are
grouped together. Allow us to examine each of these strategies independently.
Mean from ungrouped data: When the classification of information is very large, the
circular appropriation table spends most of the time arranging the information. The repeat
assignment table gives the information value and the number of events for each value in
the information classification (Monino, 2021). The frequency tables are easy to read and
investigate, and are used in this idea for information that is not grouped or recorded. The
formula for calculating it is:
Mean (μ) = (∑x)/N
= 405000 / 5
Mean = 81000
The numbers in a repeating distribution table do not need to be organized in a specific
arrangement. Counting segments are often added to tables to make entering numbers more
straightforward.
Standard Deviation of Ungrouped Data
The standard deviation is the summary proportion of the difference of each perception from the
mean. Assuming the actual differences add up, the positives will precisely adjust the negatives,
so they add up to zero. Therefore, the square of the difference is added. Then divide the number
of squares by the number of perceptions to get the average of the squares, then return the square
root to bring the estimate to the units we started with.
perceptions. There are two different equations for calculating the average of ungrouped
information and the average of grouped data.
Mean from Grouped Data: The formula for finding out the mean for the grouped data is
as follows:
Mean; μ =
To calculate the mean of the combined information, we employ three different strategies -
the direct strategy, the expected mean technique, and the step-difference strategy. The average of
the collected information governs the frequency of the various perceptions or factors that are
grouped together. Allow us to examine each of these strategies independently.
Mean from ungrouped data: When the classification of information is very large, the
circular appropriation table spends most of the time arranging the information. The repeat
assignment table gives the information value and the number of events for each value in
the information classification (Monino, 2021). The frequency tables are easy to read and
investigate, and are used in this idea for information that is not grouped or recorded. The
formula for calculating it is:
Mean (μ) = (∑x)/N
= 405000 / 5
Mean = 81000
The numbers in a repeating distribution table do not need to be organized in a specific
arrangement. Counting segments are often added to tables to make entering numbers more
straightforward.
Standard Deviation of Ungrouped Data
The standard deviation is the summary proportion of the difference of each perception from the
mean. Assuming the actual differences add up, the positives will precisely adjust the negatives,
so they add up to zero. Therefore, the square of the difference is added. Then divide the number
of squares by the number of perceptions to get the average of the squares, then return the square
root to bring the estimate to the units we started with.
Paraphrase This Document
Need a fresh take? Get an instant paraphrase of this document with our AI Paraphraser
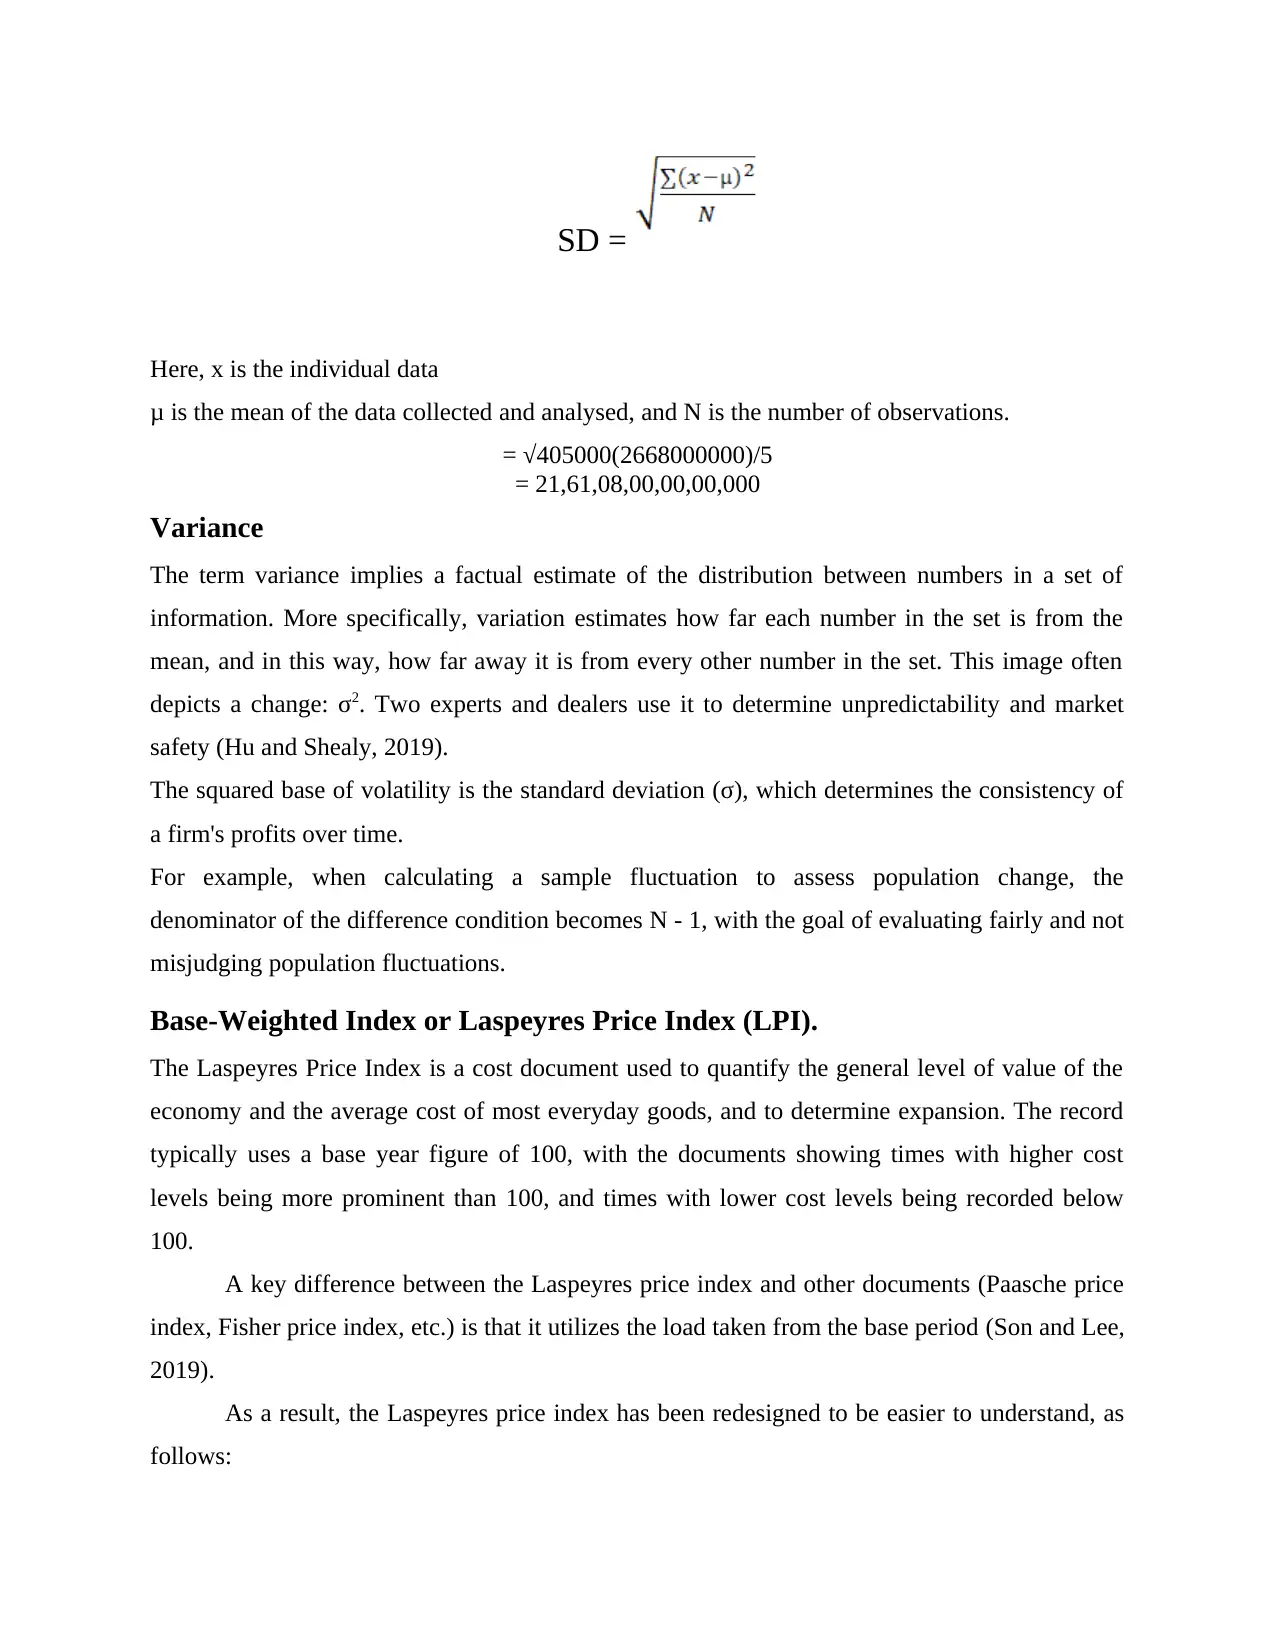
SD =
Here, x is the individual data
μ is the mean of the data collected and analysed, and N is the number of observations.
= √405000(2668000000)/5
= 21,61,08,00,00,00,000
Variance
The term variance implies a factual estimate of the distribution between numbers in a set of
information. More specifically, variation estimates how far each number in the set is from the
mean, and in this way, how far away it is from every other number in the set. This image often
depicts a change: σ2. Two experts and dealers use it to determine unpredictability and market
safety (Hu and Shealy, 2019).
The squared base of volatility is the standard deviation (σ), which determines the consistency of
a firm's profits over time.
For example, when calculating a sample fluctuation to assess population change, the
denominator of the difference condition becomes N - 1, with the goal of evaluating fairly and not
misjudging population fluctuations.
Base-Weighted Index or Laspeyres Price Index (LPI).
The Laspeyres Price Index is a cost document used to quantify the general level of value of the
economy and the average cost of most everyday goods, and to determine expansion. The record
typically uses a base year figure of 100, with the documents showing times with higher cost
levels being more prominent than 100, and times with lower cost levels being recorded below
100.
A key difference between the Laspeyres price index and other documents (Paasche price
index, Fisher price index, etc.) is that it utilizes the load taken from the base period (Son and Lee,
2019).
As a result, the Laspeyres price index has been redesigned to be easier to understand, as
follows:
The numerator is essentially the total consumption of everything in the perceived time
frame using the base amount, while the denominator is the absolute consumption of everything
in the base time frame using the base amount.
Current Weighted Index or Paasche Price Index (PPI)
A Paasche Cost Inventory is a document equation used in Cost Insights to estimate the value lift
of a box of labor and product consumed in the current time frame. The query it responded to was
how much the bins purchased by the buyer in the current time frame cost during the base period.
Therefore, it also features fixed weight or fixed crate records as it utilizes the labor and product
boxes and their loads in the current time frame (Rai and Lin, 2019). Along these lines, otherwise
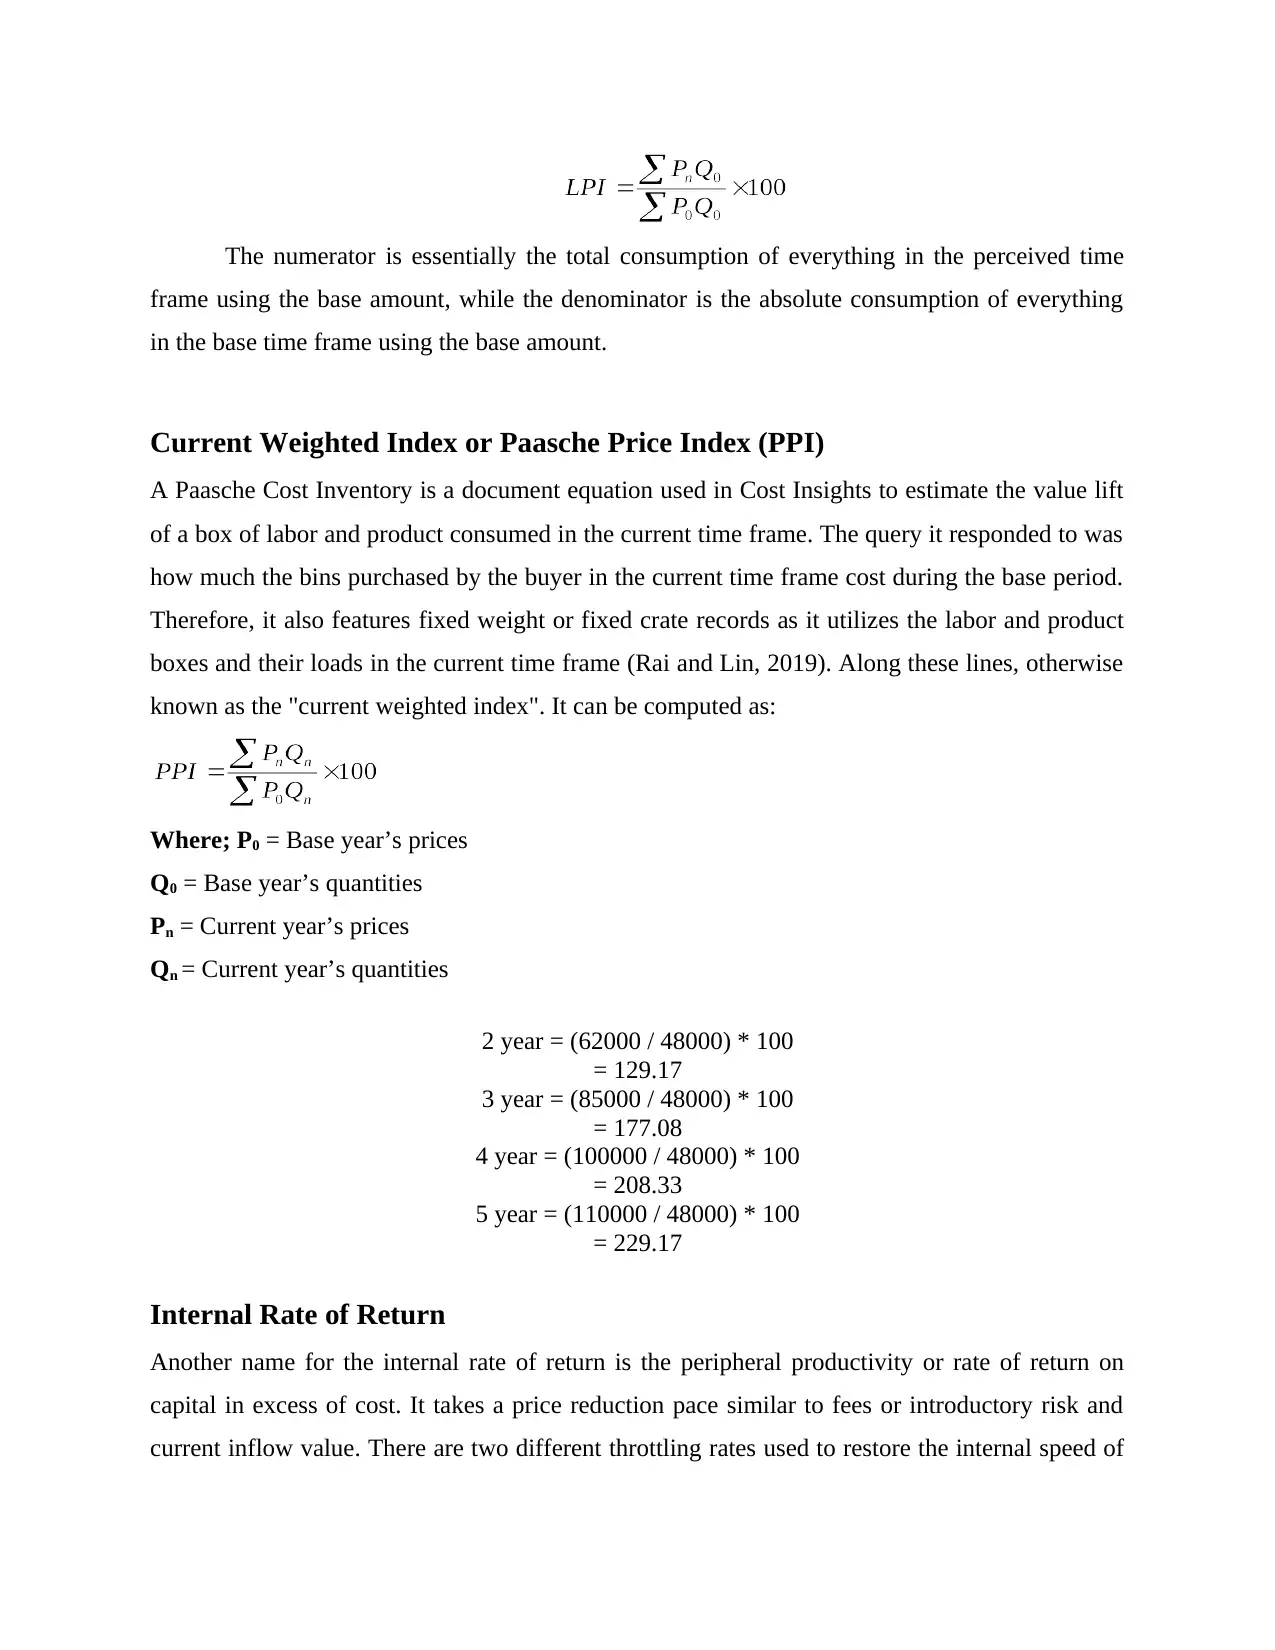
known as the "current weighted index". It can be computed as:
Where; P0 = Base year’s prices
Q0 = Base year’s quantities
Pn = Current year’s prices
Qn = Current year’s quantities
2 year = (62000 / 48000) * 100
= 129.17
3 year = (85000 / 48000) * 100
= 177.08
4 year = (100000 / 48000) * 100
= 208.33
5 year = (110000 / 48000) * 100
= 229.17
Internal Rate of Return
Another name for the internal rate of return is the peripheral productivity or rate of return on
capital in excess of cost. It takes a price reduction pace similar to fees or introductory risk and
current inflow value. There are two different throttling rates used to restore the internal speed of
frame using the base amount, while the denominator is the absolute consumption of everything
in the base time frame using the base amount.
Current Weighted Index or Paasche Price Index (PPI)
A Paasche Cost Inventory is a document equation used in Cost Insights to estimate the value lift
of a box of labor and product consumed in the current time frame. The query it responded to was
how much the bins purchased by the buyer in the current time frame cost during the base period.
Therefore, it also features fixed weight or fixed crate records as it utilizes the labor and product
boxes and their loads in the current time frame (Rai and Lin, 2019). Along these lines, otherwise
known as the "current weighted index". It can be computed as:
Where; P0 = Base year’s prices
Q0 = Base year’s quantities
Pn = Current year’s prices
Qn = Current year’s quantities
2 year = (62000 / 48000) * 100
= 129.17
3 year = (85000 / 48000) * 100
= 177.08
4 year = (100000 / 48000) * 100
= 208.33
5 year = (110000 / 48000) * 100
= 229.17
Internal Rate of Return
Another name for the internal rate of return is the peripheral productivity or rate of return on
capital in excess of cost. It takes a price reduction pace similar to fees or introductory risk and
current inflow value. There are two different throttling rates used to restore the internal speed of
⊘ This is a preview!⊘
Do you want full access?
Subscribe today to unlock all pages.
Trusted by 1+ million students worldwide
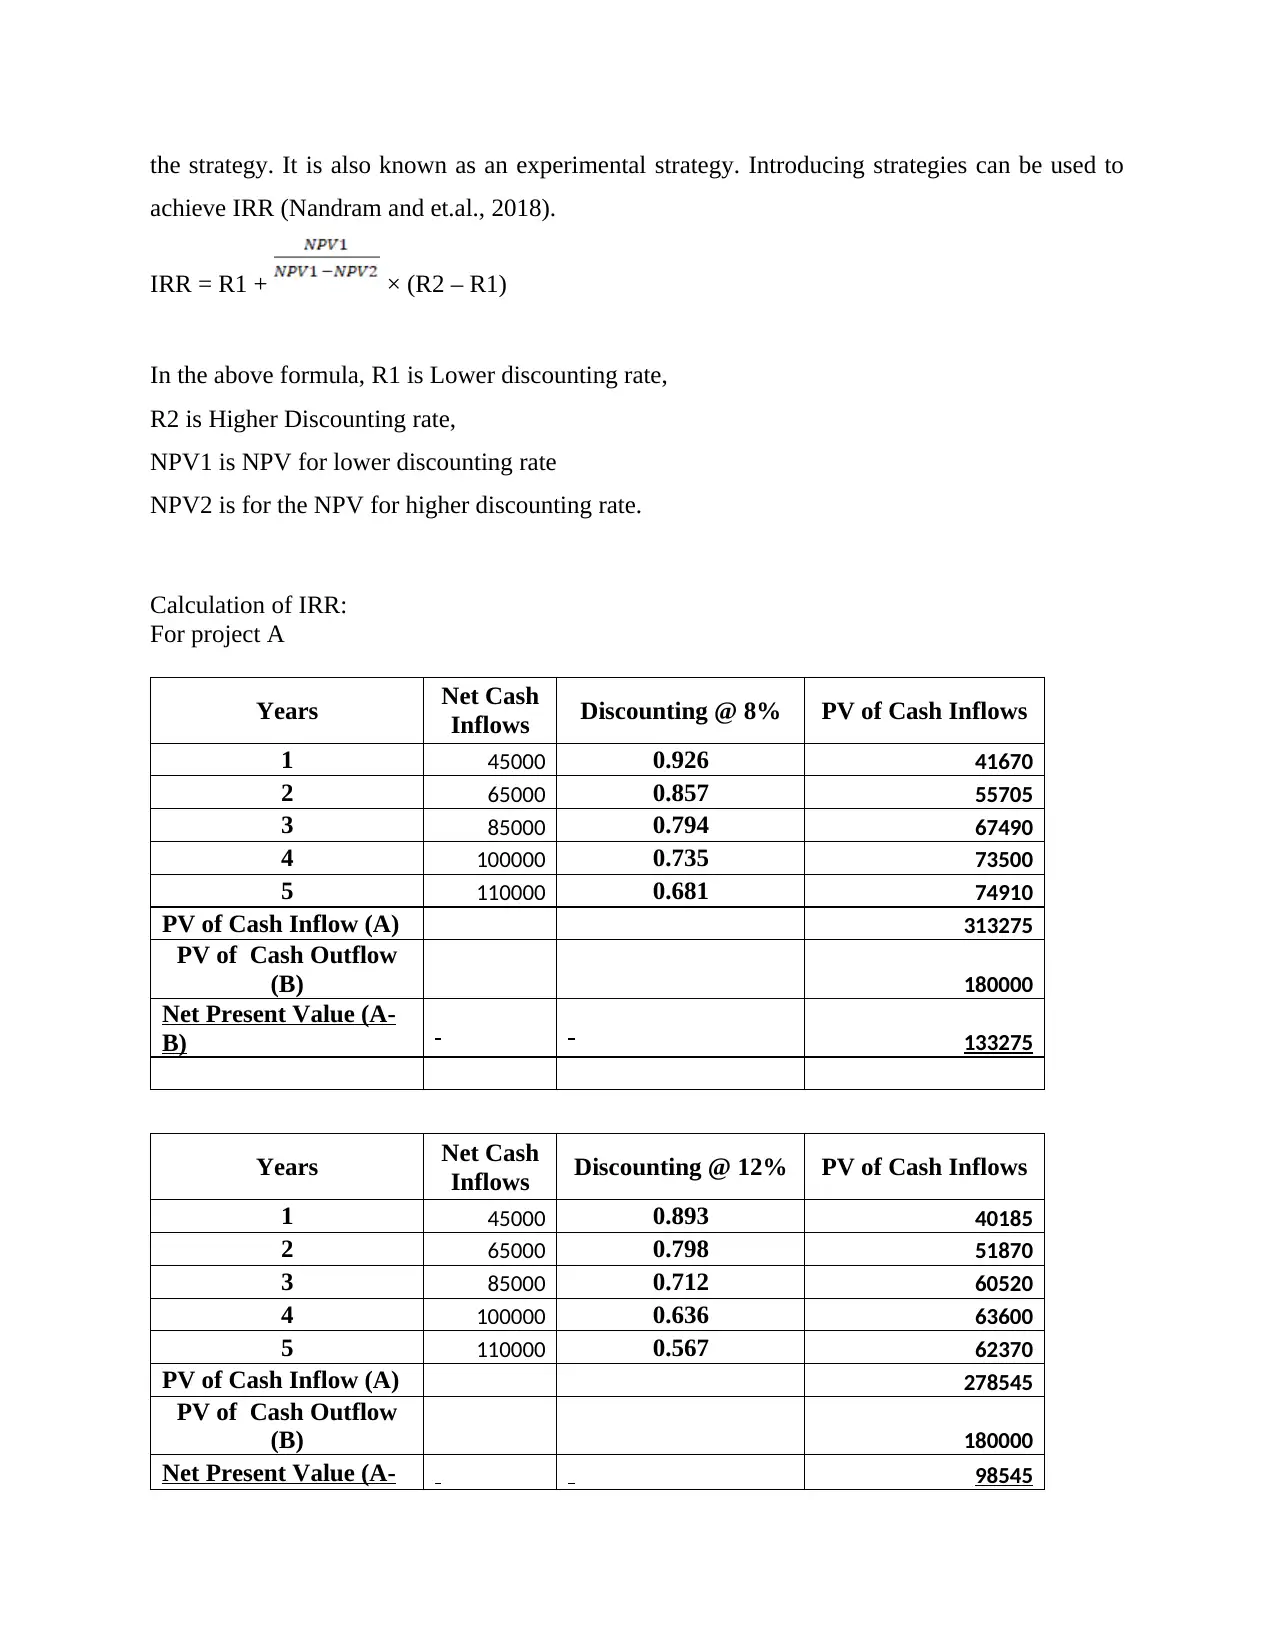
the strategy. It is also known as an experimental strategy. Introducing strategies can be used to
achieve IRR (Nandram and et.al., 2018).
IRR = R1 + × (R2 – R1)
In the above formula, R1 is Lower discounting rate,
R2 is Higher Discounting rate,
NPV1 is NPV for lower discounting rate
NPV2 is for the NPV for higher discounting rate.
Calculation of IRR:
For project A
Years Net Cash
Inflows Discounting @ 8% PV of Cash Inflows
1 45000 0.926 41670
2 65000 0.857 55705
3 85000 0.794 67490
4 100000 0.735 73500
5 110000 0.681 74910
PV of Cash Inflow (A) 313275
PV of Cash Outflow
(B) 180000
Net Present Value (A-
B) 133275
Years Net Cash
Inflows Discounting @ 12% PV of Cash Inflows
1 45000 0.893 40185
2 65000 0.798 51870
3 85000 0.712 60520
4 100000 0.636 63600
5 110000 0.567 62370
PV of Cash Inflow (A) 278545
PV of Cash Outflow
(B) 180000
Net Present Value (A- 98545
Paraphrase This Document
Need a fresh take? Get an instant paraphrase of this document with our AI Paraphraser
B)
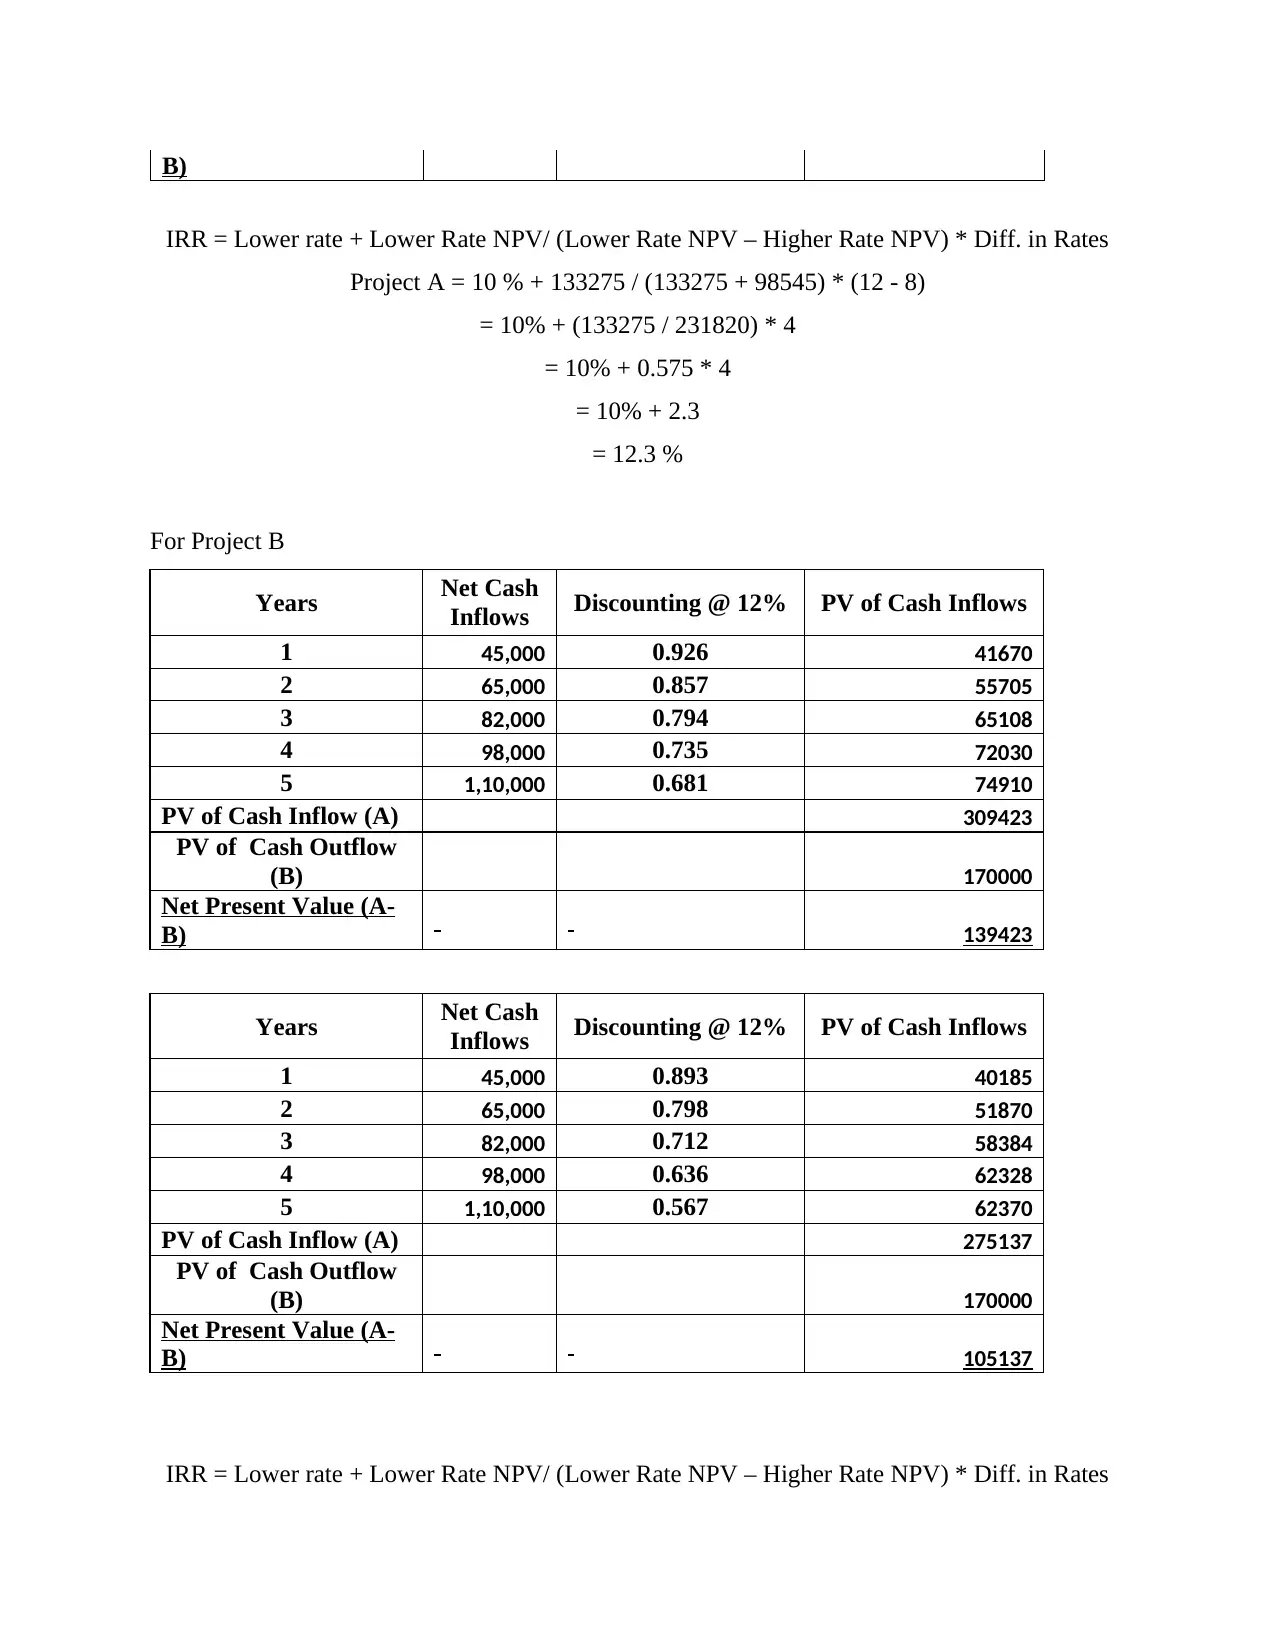
IRR = Lower rate + Lower Rate NPV/ (Lower Rate NPV – Higher Rate NPV) * Diff. in Rates
Project A = 10 % + 133275 / (133275 + 98545) * (12 - 8)
= 10% + (133275 / 231820) * 4
= 10% + 0.575 * 4
= 10% + 2.3
= 12.3 %
For Project B
Years Net Cash
Inflows Discounting @ 12% PV of Cash Inflows
1 45,000 0.926 41670
2 65,000 0.857 55705
3 82,000 0.794 65108
4 98,000 0.735 72030
5 1,10,000 0.681 74910
PV of Cash Inflow (A) 309423
PV of Cash Outflow
(B) 170000
Net Present Value (A-
B) 139423
Years Net Cash
Inflows Discounting @ 12% PV of Cash Inflows
1 45,000 0.893 40185
2 65,000 0.798 51870
3 82,000 0.712 58384
4 98,000 0.636 62328
5 1,10,000 0.567 62370
PV of Cash Inflow (A) 275137
PV of Cash Outflow
(B) 170000
Net Present Value (A-
B) 105137
IRR = Lower rate + Lower Rate NPV/ (Lower Rate NPV – Higher Rate NPV) * Diff. in Rates
IRR = Lower rate + Lower Rate NPV/ (Lower Rate NPV – Higher Rate NPV) * Diff. in Rates
Project A = 10 % + 133275 / (133275 + 98545) * (12 - 8)
= 10% + (133275 / 231820) * 4
= 10% + 0.575 * 4
= 10% + 2.3
= 12.3 %
For Project B
Years Net Cash
Inflows Discounting @ 12% PV of Cash Inflows
1 45,000 0.926 41670
2 65,000 0.857 55705
3 82,000 0.794 65108
4 98,000 0.735 72030
5 1,10,000 0.681 74910
PV of Cash Inflow (A) 309423
PV of Cash Outflow
(B) 170000
Net Present Value (A-
B) 139423
Years Net Cash
Inflows Discounting @ 12% PV of Cash Inflows
1 45,000 0.893 40185
2 65,000 0.798 51870
3 82,000 0.712 58384
4 98,000 0.636 62328
5 1,10,000 0.567 62370
PV of Cash Inflow (A) 275137
PV of Cash Outflow
(B) 170000
Net Present Value (A-
B) 105137
IRR = Lower rate + Lower Rate NPV/ (Lower Rate NPV – Higher Rate NPV) * Diff. in Rates
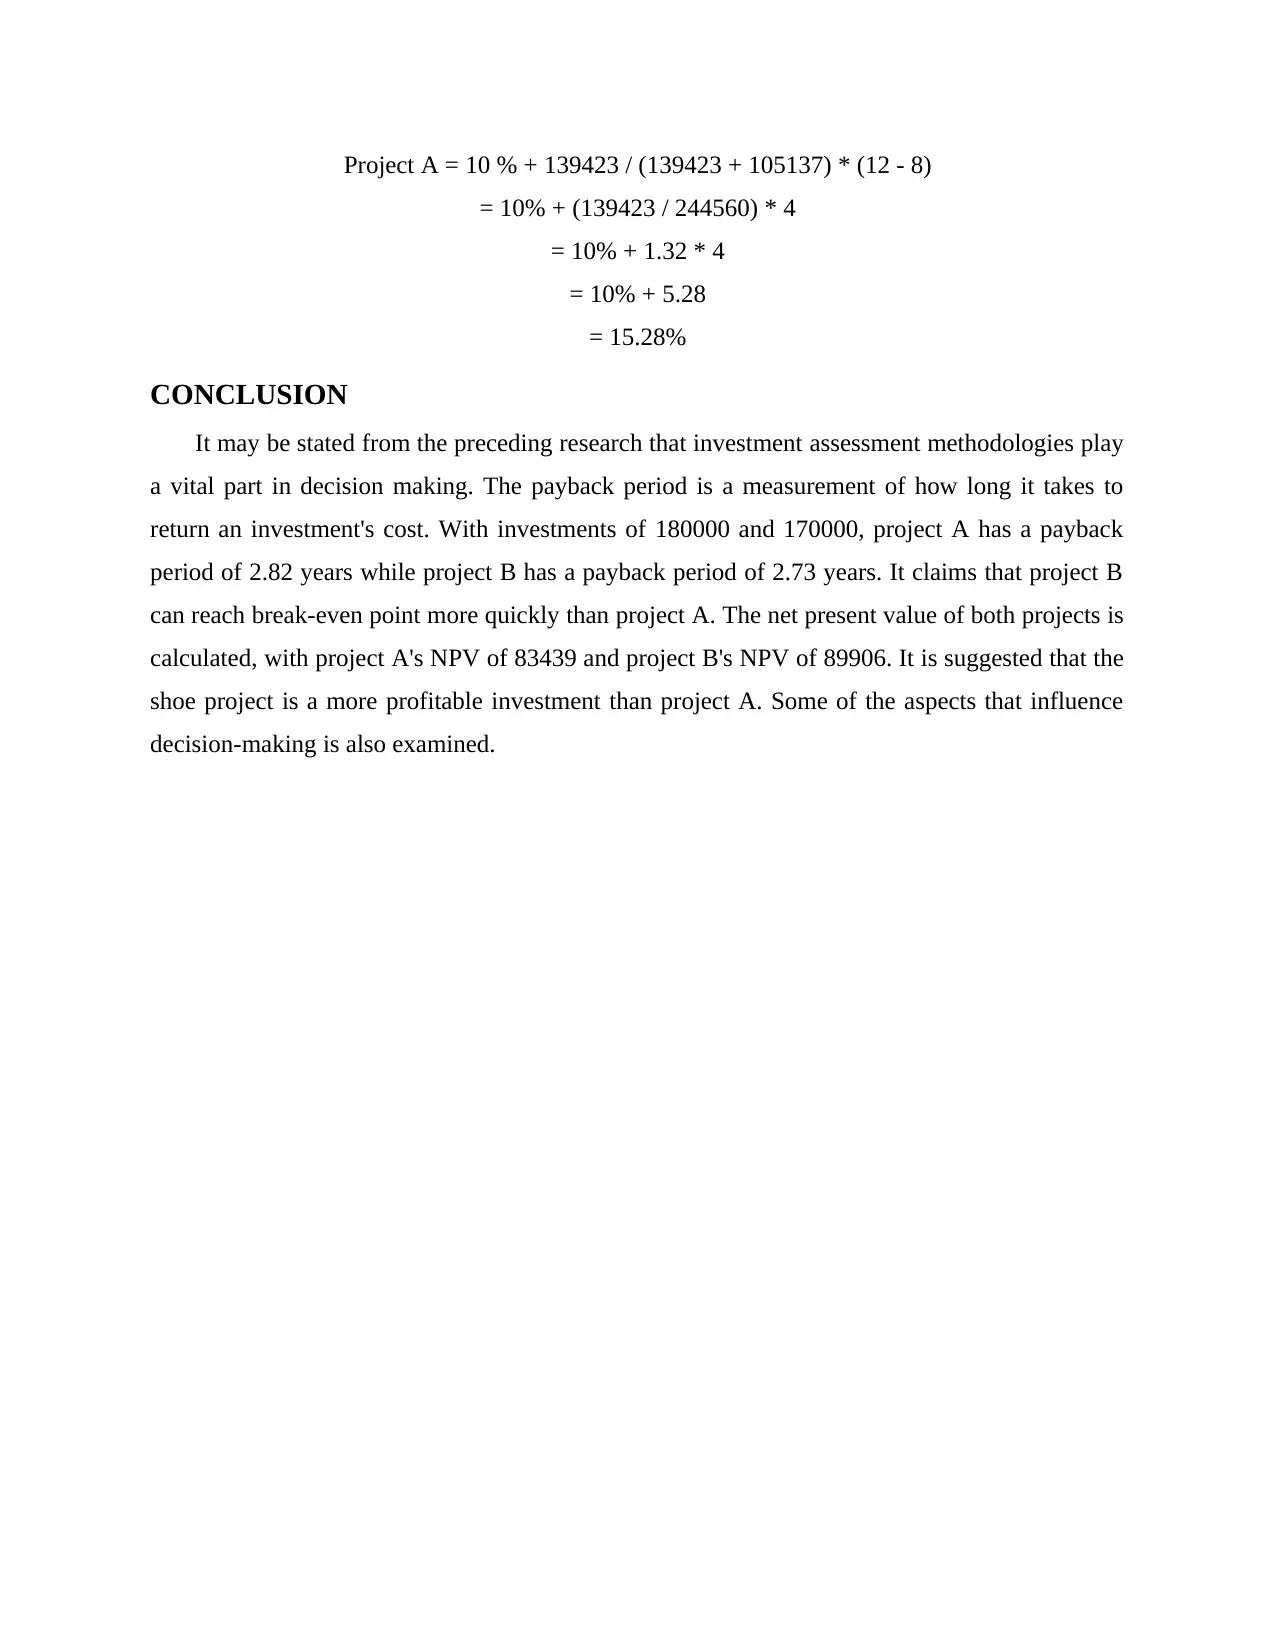
Project A = 10 % + 139423 / (139423 + 105137) * (12 - 8)
= 10% + (139423 / 244560) * 4
= 10% + 1.32 * 4
= 10% + 5.28
= 15.28%
CONCLUSION
It may be stated from the preceding research that investment assessment methodologies play
a vital part in decision making. The payback period is a measurement of how long it takes to
return an investment's cost. With investments of 180000 and 170000, project A has a payback
period of 2.82 years while project B has a payback period of 2.73 years. It claims that project B
can reach break-even point more quickly than project A. The net present value of both projects is
calculated, with project A's NPV of 83439 and project B's NPV of 89906. It is suggested that the
shoe project is a more profitable investment than project A. Some of the aspects that influence
decision-making is also examined.
⊘ This is a preview!⊘
Do you want full access?
Subscribe today to unlock all pages.
Trusted by 1+ million students worldwide
1 out of 13
Related Documents


Your All-in-One AI-Powered Toolkit for Academic Success.
+13062052269
info@desklib.com
Available 24*7 on WhatsApp / Email
![[object Object]](/_next/static/media/star-bottom.7253800d.svg)
Unlock your academic potential
Copyright © 2020–2026 A2Z Services. All Rights Reserved. Developed and managed by ZUCOL.