LSBF Accounting and Managerial Finance: ASOS Financial Analysis Report
VerifiedAdded on 2022/08/12
|21
|5275
|12
Report
AI Summary
This report provides a comprehensive financial analysis of ASOS Plc, examining its financial health through various ratio analyses, including liquidity, profitability, activity, debt, and market value ratios. The report compares ASOS's performance with its competitor, Marks and Spencer, to assess its financial standing. The analysis delves into key financial aspects, such as working capital management, and the impact of market changes on ASOS's share price. The study evaluates ASOS's performance from 2017 to 2019, providing insights into its financial trends and strategic decision-making. The report also includes an evaluation of ASOS's new project, using different valuation methods to determine the most effective approach for assessing its value. The conclusion summarizes the financial condition and strategic recommendations for ASOS Plc.
Running Head: FINANCIAL ANALYSIS OF ASOS
FINANCIAL ANALYSIS OF ASOS
Name of Student
Name of the University
Author notes
Word count
FINANCIAL ANALYSIS OF ASOS
Name of Student
Name of the University
Author notes
Word count
Paraphrase This Document
Need a fresh take? Get an instant paraphrase of this document with our AI Paraphraser
1FINANCIAL ANALYSIS OF ASOS
Executive summary
The purpose of the study is to examine the financial condition of ASOS Plc through ratio
analysis. The liquidity, profitability, activity, debt and market value ratios are analysed to
find out the financial condition of ASOS compared to their competitor Mark and Spencer.
The interpretation of these ratios is analysed to estimate the financial situation of the firm.
ASOS Plc is in better financial condition than their competitor. The new project of ASOS Plc
is evaluated by using three methods. APV method is the most useful method amongst them
for valuation of their new project.
2FINANCIAL ANALYSIS OF ASOS
Table of Contents
Task 1.........................................................................................................................................4
ASOS Plc...................................................................................................................................4
Financial analysis.......................................................................................................................5
Ratio analysis.........................................................................................................................5
Liquidity Ratio...................................................................................................................5
Activity Ratio.....................................................................................................................6
Debt ratio............................................................................................................................6
Profitability Ratio...............................................................................................................6
Gross profit margin............................................................................................................7
Return on assets..................................................................................................................7
Interpretation of ASOS Plc’s performance................................................................................8
Liquidity ratio.........................................................................................................................8
Activity ratio..........................................................................................................................9
Debt ratio..............................................................................................................................10
Profitability ratio..................................................................................................................10
Market value ratios...............................................................................................................11
Working capital management..................................................................................................13
Task 2.......................................................................................................................................15
Conclusion................................................................................................................................17
References................................................................................................................................18
⊘ This is a preview!⊘
Do you want full access?
Subscribe today to unlock all pages.
Trusted by 1+ million students worldwide
3FINANCIAL ANALYSIS OF ASOS
Task 1
ASOS Plc
ASOS plc is an online e-commercial fashion platform providing retail accessories, fashion
clothing and footwear to their customers. This website primarily focuses on delivering its
products and services to young adults. ASOS Plc sells over 850 brands across 186 large
countries. ASOS Plc has approximately 75000 separate ranges of clothing including
menswear, women’s wear, footwear and accessories along with jewellery. ASOS has
fulfilment centres in the UK, US and EU which assist the company in delivering its services
across these countries. This company focuses on becoming the world largest fashion-clothing
provider in the e-market. ASOS Plc. was established in 2000 who is focused on providing
their customers with good quality, fashionable and comfortable clothing for nearly 20 years.
The recent changes in the global market affected the shares of the company. ASOS Plc’s
market shares started to reduce from 2016 till 2019. ASOS also maintains proper corporate
social responsibility program, which ensures sustainability, ethnicity and responsibility. The
financial issues will be described later after analysing the financial report of ASOS Plc.
ASOS Plc prioritises their investments in their infrastructures, which aid them to achieve
their target growth over the last few years. ASOS Plc. is focusing on providing more
sustainable clothing to their customers in the next five years. ASOS Plc also has offline
market place other than online websites which offer plenty of fashionable products to the
community. ASOS is primarily focused on expanding its services through the global market.
Digital marketing also aided the firm to expand its business. The online mobile app of ASOS
helped the users to get better service and experience.
Paraphrase This Document
Need a fresh take? Get an instant paraphrase of this document with our AI Paraphraser
4FINANCIAL ANALYSIS OF ASOS
Financial analysis
This report includes a full financial analysis of ASOS Plc providing detailed
information about the financial health of the company as well as will aid to understand the
financial health of its primary competitor. The financial analysis will aid to evaluate the
recent changes in the share price of the company. The working capital management will also
be provided in the analysis. The primary ratios which will be included in the analysis are
given below. This will strengthen the concepts of the report.
Ratio analysis
The ratio analysis will be including liquidity, Activity, debt ratio, profitability ratio
and market ratio (Roy, 2019). The financial ratios are discussed below, which will aid to
understand the financial position of the company. The balance sheet and cash flows will
assist the analysis.
Liquidity Ratio
The liquidity ratio assists the company in estimating their ability to pay off their short-
term obligation without the need to increase their any external financial capitals
(Abdelraheem & Serajeldin, 2017). The current ratios and quick ratio are the two types of
liquidity ratio.
Current Ratio
The current ratio aids the firm to evaluate the liquidity of the company. Current ratio
aid the investor to understand the position of the company regarding asset maximization to
pay off the debts and other payables (Mahmudin, Lau & Tandirerung, 2019).
Quick Ratio
5FINANCIAL ANALYSIS OF ASOS
The quick ratio indicates the financial position of the company, which evaluates
whether the company is able to meet its short term liabilities and debts. Acid test ratio
excludes the inventory from the analysis, which provides the company with better cash
management.
Activity Ratio
The activity ratio evaluates the operational efficiency and profitability of the firm
(Baraja & Yosya, 2019). Activity ratio includes account receivable turnover ratio and total
assets turnover ratio.
Account receivable turnover ratio
Account receivable turnover ratio assists the firm to evaluate its operational efficiency
as well as estimates that how effective the company is in collecting their receivable and
managing their debts (Atika, & Sukoco, 2019).
Total asset turnover ratio
The total asset turnover ratio helps the firm to understand its efficiency of generating
sales, which aids in measuring the profitability of the firm (Utami, 2017).
Debt ratio
Debt ratio aids the firm to estimate the total liability, which helps the investors and
outsiders of the firm to analyse the total debt of the company. This ratio also estimates the
economic position of the firm for the future (Otekunrin et.al., 2018).
Profitability Ratio
Profitability ratio assists the firm to evaluate the earning of the business based on the
revenue of the firm. By accessing the information about profitability ratio of a firm, the
investors can evaluate the firm’s ability in generating profit. Profitability ratio includes
⊘ This is a preview!⊘
Do you want full access?
Subscribe today to unlock all pages.
Trusted by 1+ million students worldwide
6FINANCIAL ANALYSIS OF ASOS
analysis of Gross profit margin, return on assets, return on equity and price /earnings ratio
(Tamang, 2017).
Gross profit margin
The gross profit margin helps the firm to estimate their financial health. The gross
profit margin aids the firm to increase its area of operations by evaluating its financial
condition (Khamidah, Gagah, & Fathoni, 2018).
Return on assets
Return on assets shows the profitability of the firm, which is evaluated by net income
and shareholder’s fund. It measures the effectiveness of the firm in earning a return on its
investments in assets. A positive return on assets always indicates the profitability of the firm
(Bhatt & Verghese, 2018).
Return on equity
Return on equity is used to evaluate the financial profitability of a firm. This ratio
measures the effectiveness of management in the use of their assets to generate the
profitability of the company (Abraham, Harris, & Auerbach, 2017).
Market ratios
Market value ratios are used to evaluate the financial health of the company as well as
assists the investors to understand the position of the company in the share market
(Almumani, 2018). Market value ratios include the calculation of book value per share,
dividend yield, and earning per share.
Book value per share
Paraphrase This Document
Need a fresh take? Get an instant paraphrase of this document with our AI Paraphraser
7FINANCIAL ANALYSIS OF ASOS
The book value per share aid the firm to understand the share price of the company in the
market. The proper book value per share should be within 1.0.
Dividend yield
The dividend yield evaluates the amount of income received by the company from the
stock. This helps the investors to understand the position of the company; therefore; they can
make their decision regarding buying stock from that company (Baker, De Ridder, &
Råsbrant, 2019).
Earnings per share
Earnings per share indicate the profitability of the company. The higher earnings per
share indicate better profitability of a company (Kumar & Venoor, 2018).
Price/earnings ratio
Price to earnings ratio aids the company to evaluate their earning as well as estimates
whether the company is overvalued or undervalued in the market (Sha, 2017). The higher the
ratio, the better value the investors will pay for 1 dollar of their current earnings.
Interpretation of ASOS Plc’s performance
From the analysis of ratios, the financial condition can be observed. The interpretation
of the analysis is given below.
Liquidity ratio
The current ratio of ASOS was 0.95 in the year 2017. This was decreased in the
forthcoming years 2018 and 2019. The current ratio of 2018 and 2019 was 0.90 and 0.81
(Asosplc.com, 2020). ASOS Plc’s ability to generate cash has been decreased over the years.
This happened as the company purchased more stock, which affected the current ratio of the
8FINANCIAL ANALYSIS OF ASOS
company. The increase in inventory means the outflow of cash for the company. To increase
the current ratio of the company in the forecasted years, it is suggested to properly evaluate
receivables as well as the inventory, which will aid the farm to increase the cash inflow in the
business. Further, it can be analysed that the decrease in quick ratio occurred in the company
during 2017, 2018 and 2019. The quick ratio was 0.35, 0.17 and 0.11, respectively. The
decrease in the quick ratio indicates that the liquidity position of the company is getting
worse over the years. The company should increase sales and pay off the liabilities as early as
possible, which will aid them to increase their quick ratio in the upcoming years. The current
liabilities of the company is increasing; thereby, it is suggested that the authority should use
their investments to pay off the liabilities (Rashid, 2018). However, the company is in better
financial condition than their primary competitor, mark and spencer (Annualreports.com,
2020).
Activity ratio
The activity ratio is analysed to find out the efficiency of the operations in the
business. ASOS Plc made net credit sales amounted to 1923.6 in the financial year 2017,
which was increased in the upcoming years. The net credit sales of 2018 and 2019 are
estimated at 2417.3 and 2733.5, which affected the account receivable turnover ratio of the
company (Asosplc.com, 2020). The account receivable turnover ratio of the company was
65.65 in the year 2017, which was decreased to 48.44 in the year 2018 due to the problem in
the credit collection of the company. The account receivable turnover ratio again increased
massively in the previous year, indicating the boost of sales of the company. During the year
2019, the company collected its receivables in time, enhancing the efficiency of the company.
The total asset turnover ratios for the year 2017, 2018 and 2019 remained one, which
indicates that the company generating 1 dollar of sales for every dollar invested in the assets
of the company. The analysis of this ratio indicates that the company is efficiently generating
⊘ This is a preview!⊘
Do you want full access?
Subscribe today to unlock all pages.
Trusted by 1+ million students worldwide
9FINANCIAL ANALYSIS OF ASOS
their sales by using their assets. The company should focus on credit collection as the
accounting receivable is decreasing. This will increase the revenue of the company by
evaluating their business operational efficiency (Osazefua, 2019).
Debt ratio
From the analysis, it can be observed that the debt ratio of the company remained the
same throughout the past three years. The debt ratio remained one, which indicates that
ASOS is putting themselves at risk in paying the liabilities. The debt ratios should be 0.3 to
0.5, which indicates good financial position of the company. To reduce the debt ratio, the
company should purchase more assets using their cash and pay off the liabilities as early as
possible. The debt ratio reduction can mitigate interest costs (Nguyen, 2019). The debt to
equity ratio of the company was 2.93 in 2017, which was decreased to 2.29 in the year 2018.
This is due to the improvement of the financial capital of ASOS. However, during 2019, the
debt to equity ratio increased to 2.75, which indicates that the company is putting themselves
to the risk associated with debt capital.
Profitability ratio
The profitability ratio indicates that the revenue of the company is increasing
drastically over the years. The revenue of ASOS in 2017 was 1923.6, which increased to
2417.3 during the year 2018. The revenue of the company increased further during the year
2019. The revenue was estimated at 2773.5 million in 2019. This drastic change happened as
the company increases its market throughout these years. ASOS also offered different
promotions over their online and offline marketplace, which aid them to increase the revenue
of the company. The strategic decision-making aided the increase in revenue of the company.
The gross profit margin of the company was 49.82 in 2017 and 51.18 in 2018. This increase
in gross profit margin helped the company to get more investors, which increased its capital.
This also indicated that the company did well in managing their cost of sales (Uz Zaman et
Paraphrase This Document
Need a fresh take? Get an instant paraphrase of this document with our AI Paraphraser
10FINANCIAL ANALYSIS OF ASOS
al., 2019). Further, the gross profit margin decreased in 2019. The gross profit margin
reduced to 48.11 in 2019. This occurred as the freight and duty of the company is increased
thorough out the year. The gross profit and revenue increased in the year 2019 compared to
previous years. The revenue increased as the retail and online sales increased compared to
previous years. The net income of the company was 64.1 million in 2017, which was
increased massively in 2018. The net income of 2018 is estimated at 82.4 million. Further,
the net income in 2019 was 24.6 million, which indicates that the company has excessive
distribution and administrative expense of the company during 2019. The return on asset
remained 0.2 in 2017 and 2019. However, an increase during 2018 can be observed from the
report, which is favourable for the investors of the company. The ROA decreased as the
company failed to manage its assets effectively in 2019. The return on equity has also
decreased in 2019, massively. The return on equity was 0.22,019 and 0.05, respectively in
2017, 2018 and 2019. The ROE reduced as the company failed to utilize the resources
provided by the investors, and the company gathered its profits to generate income.
Market value ratios
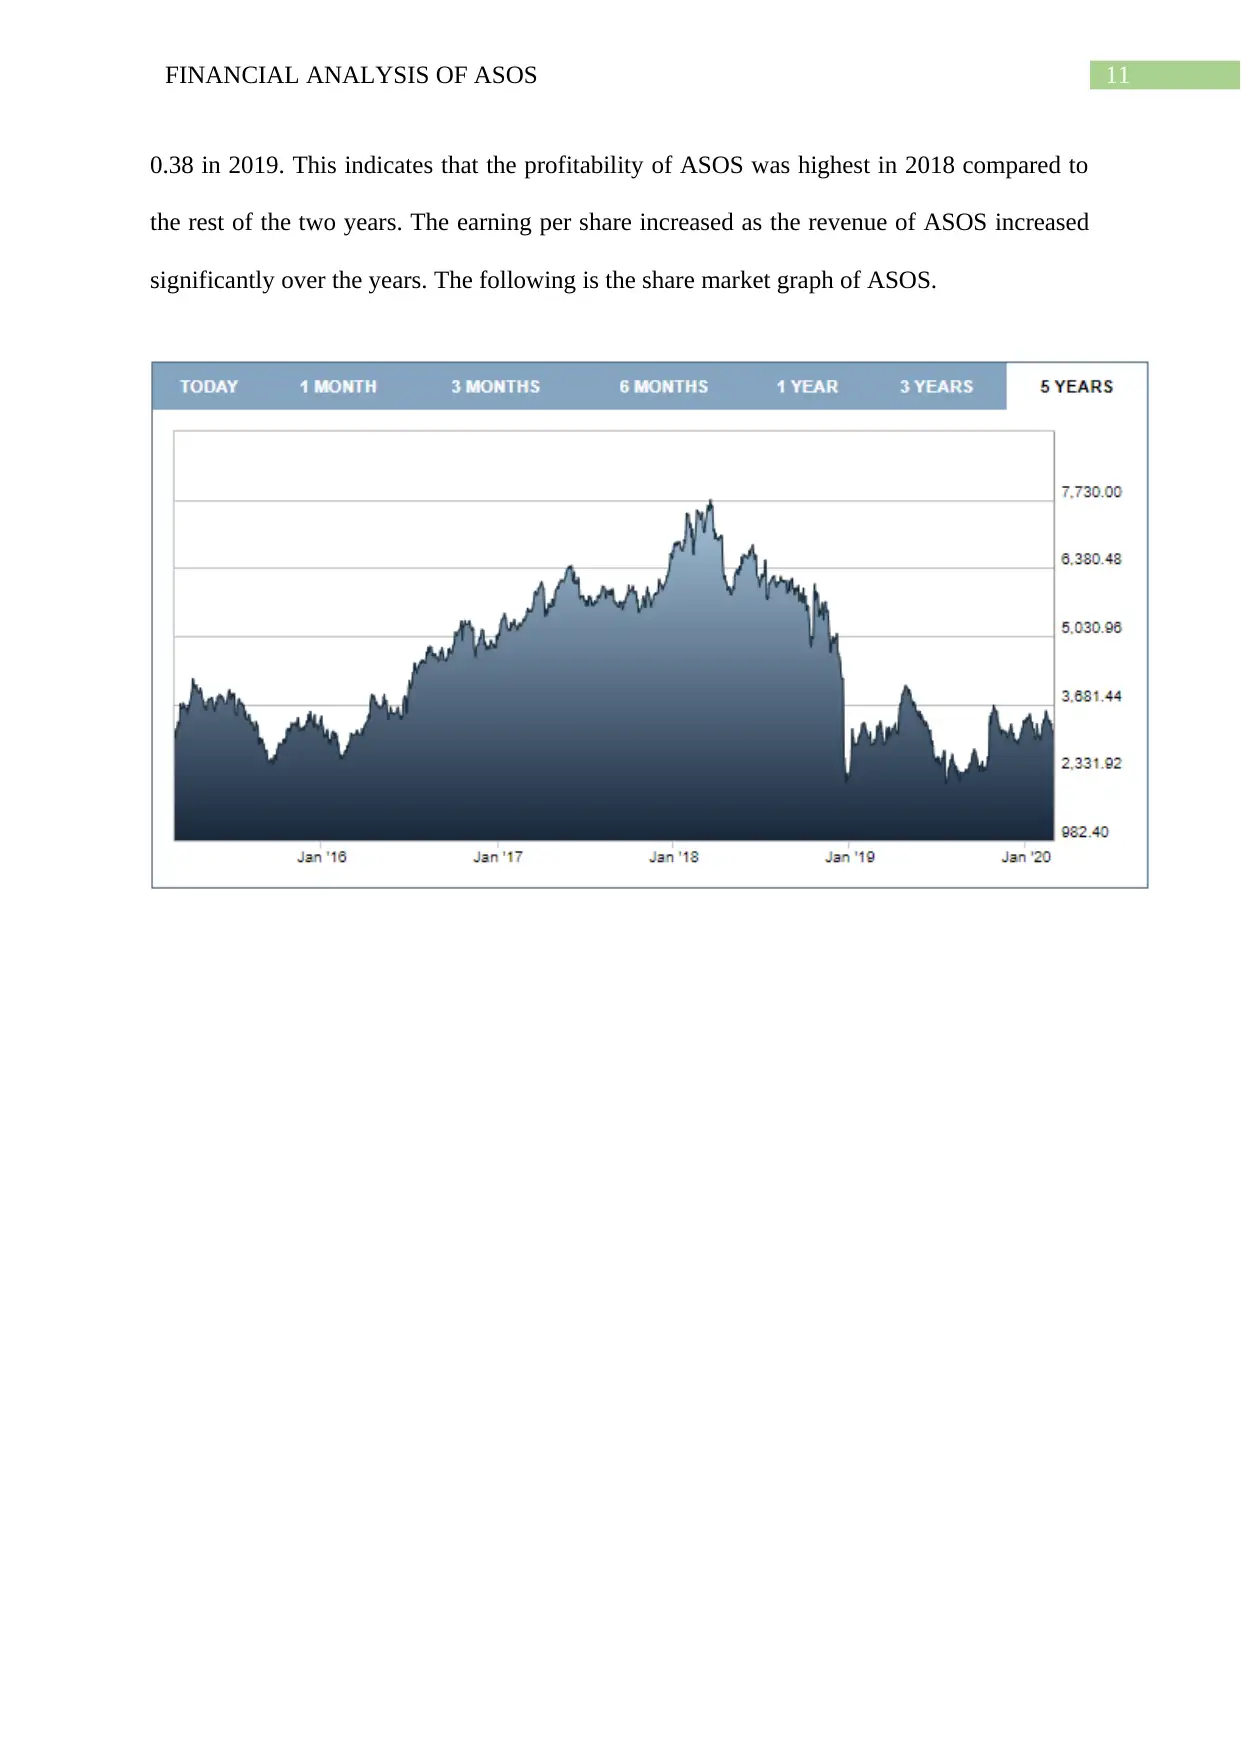
As per the analysis, the market value ratios of ASOS indicates that the share price of
the company increased in 2019; however, in 2018, the company had the highest price per
share of 0.08. The directors of ASOS Plc does not declare any dividend in these three
consecutive years. The director made the above decision as they want to reinvest the amount
of profit in the business, and they generated a good amount of return from invested capital.
This will help the business to deliver better values to their shareholders. The share price of
the company continued to increase until March 13, 2018, when the share price becomes
highest. The share price of 2016 was 3 million in the month of January. During 2019, the
share price was between 3 to 4 million. The earning per share was also the highest in 2018
compared to the rest two years. The earning per share was 0.99 in 2017, 1.26 in 2018 and
al., 2019). Further, the gross profit margin decreased in 2019. The gross profit margin
reduced to 48.11 in 2019. This occurred as the freight and duty of the company is increased
thorough out the year. The gross profit and revenue increased in the year 2019 compared to
previous years. The revenue increased as the retail and online sales increased compared to
previous years. The net income of the company was 64.1 million in 2017, which was
increased massively in 2018. The net income of 2018 is estimated at 82.4 million. Further,
the net income in 2019 was 24.6 million, which indicates that the company has excessive
distribution and administrative expense of the company during 2019. The return on asset
remained 0.2 in 2017 and 2019. However, an increase during 2018 can be observed from the
report, which is favourable for the investors of the company. The ROA decreased as the
company failed to manage its assets effectively in 2019. The return on equity has also
decreased in 2019, massively. The return on equity was 0.22,019 and 0.05, respectively in
2017, 2018 and 2019. The ROE reduced as the company failed to utilize the resources
provided by the investors, and the company gathered its profits to generate income.
Market value ratios
As per the analysis, the market value ratios of ASOS indicates that the share price of
the company increased in 2019; however, in 2018, the company had the highest price per
share of 0.08. The directors of ASOS Plc does not declare any dividend in these three
consecutive years. The director made the above decision as they want to reinvest the amount
of profit in the business, and they generated a good amount of return from invested capital.
This will help the business to deliver better values to their shareholders. The share price of
the company continued to increase until March 13, 2018, when the share price becomes
highest. The share price of 2016 was 3 million in the month of January. During 2019, the
share price was between 3 to 4 million. The earning per share was also the highest in 2018
compared to the rest two years. The earning per share was 0.99 in 2017, 1.26 in 2018 and
11FINANCIAL ANALYSIS OF ASOS
0.38 in 2019. This indicates that the profitability of ASOS was highest in 2018 compared to
the rest of the two years. The earning per share increased as the revenue of ASOS increased
significantly over the years. The following is the share market graph of ASOS.
0.38 in 2019. This indicates that the profitability of ASOS was highest in 2018 compared to
the rest of the two years. The earning per share increased as the revenue of ASOS increased
significantly over the years. The following is the share market graph of ASOS.
⊘ This is a preview!⊘
Do you want full access?
Subscribe today to unlock all pages.
Trusted by 1+ million students worldwide
1 out of 21
Related Documents


Your All-in-One AI-Powered Toolkit for Academic Success.
+13062052269
info@desklib.com
Available 24*7 on WhatsApp / Email
![[object Object]](/_next/static/media/star-bottom.7253800d.svg)
Unlock your academic potential
Copyright © 2020–2026 A2Z Services. All Rights Reserved. Developed and managed by ZUCOL.