Financial Analysis and Cash Flow Assignment for Finance Course

Verified

Added on  2021/10/11

|6
|542
|479
Homework Assignment
AI Summary
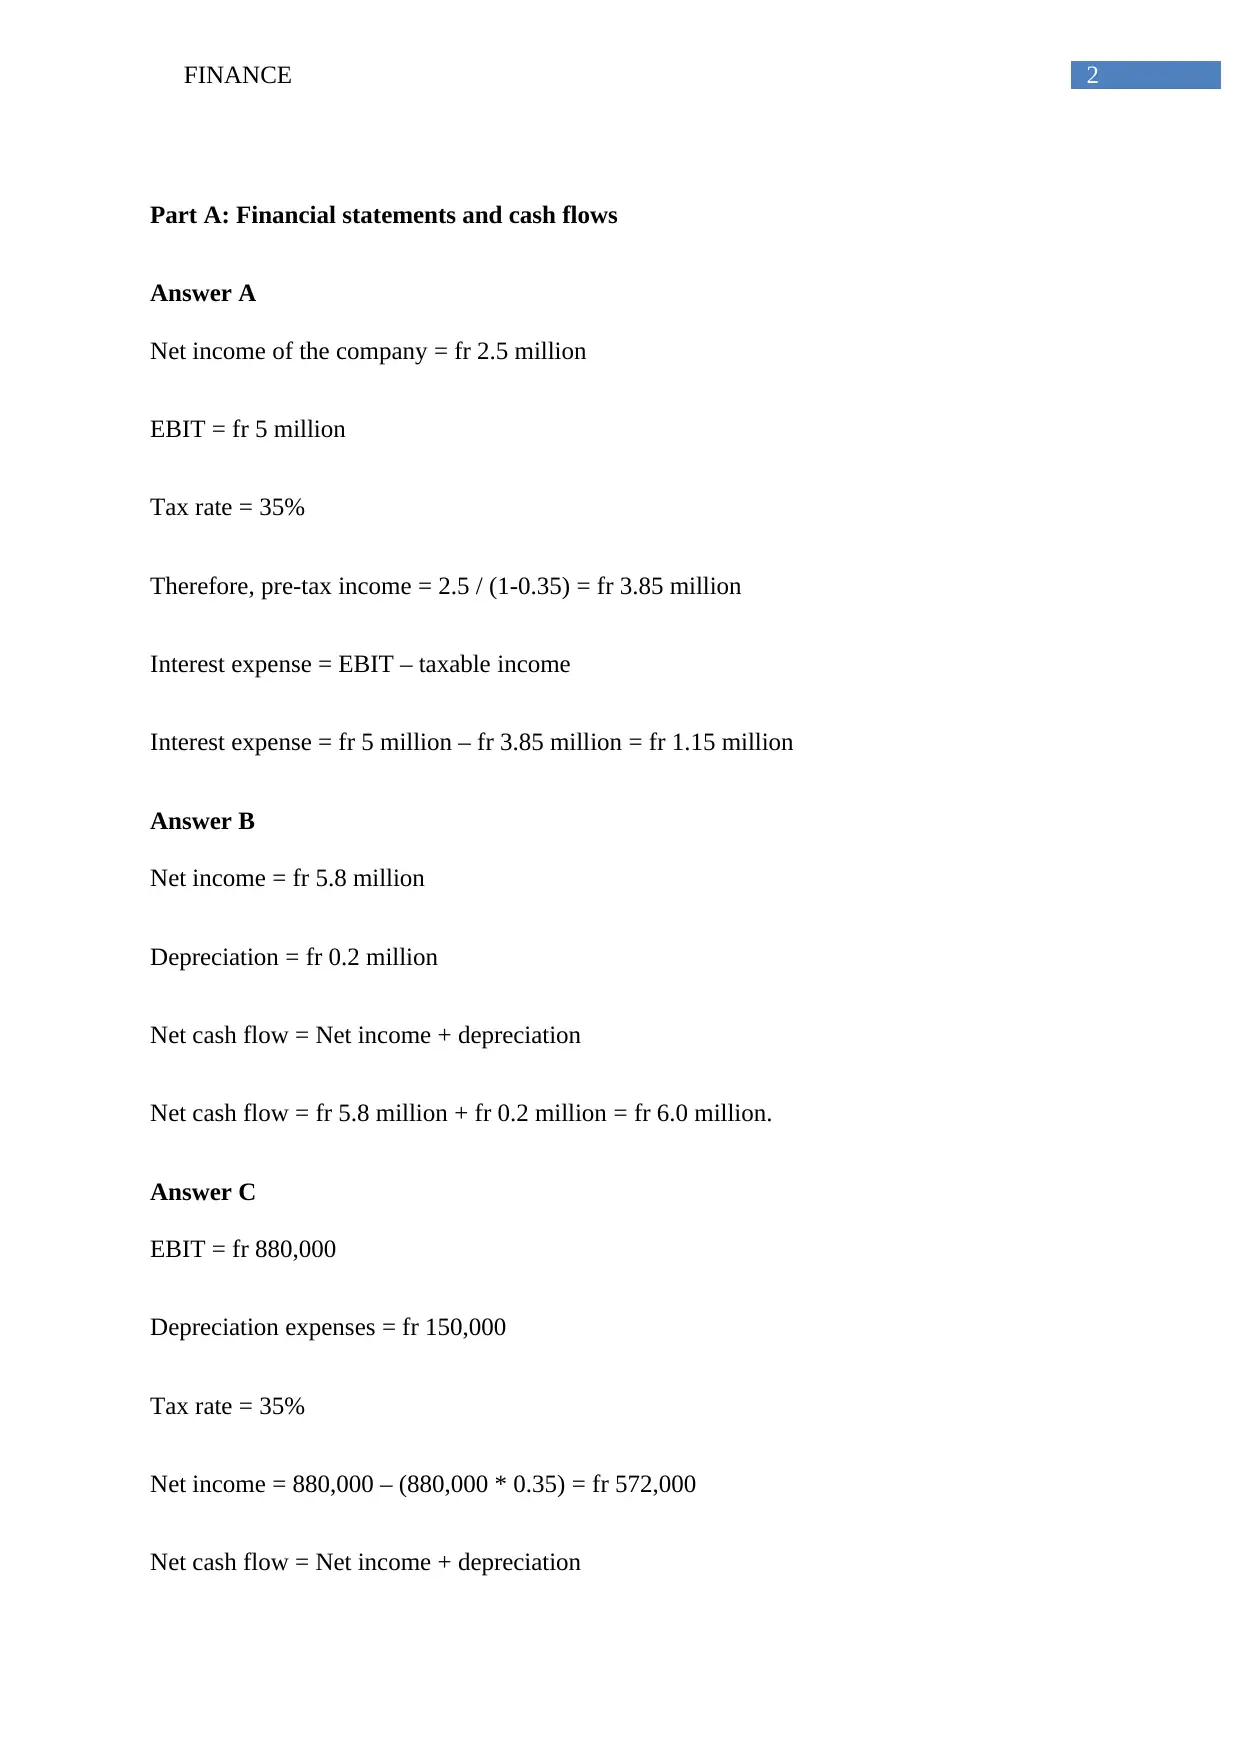
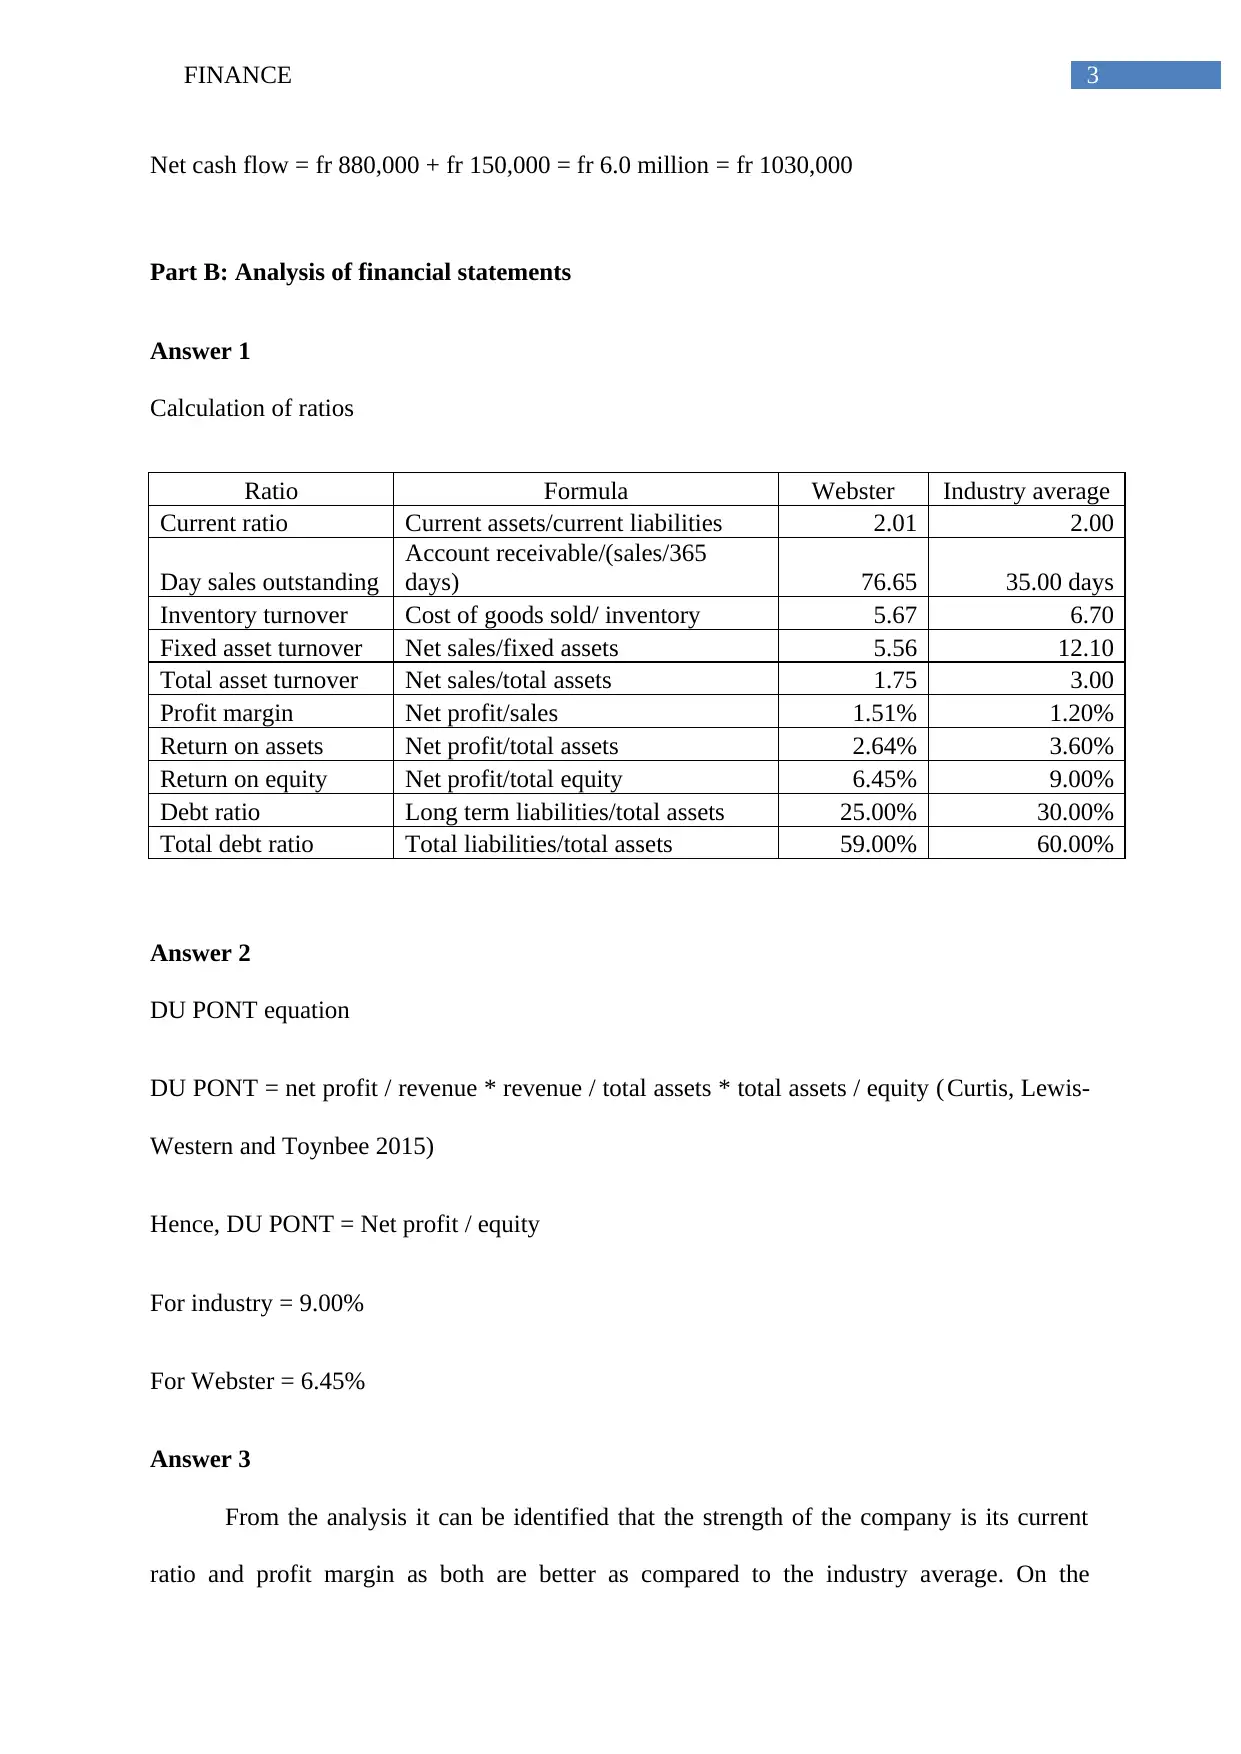
This finance assignment provides a comprehensive analysis of financial statements and cash flows. Part A focuses on calculating key financial metrics such as net income, EBIT, and net cash flow using provided data and formulas. Part B delves into the analysis of financial statements through the calculation of various financial ratios, including current ratio, day sales outstanding, inventory turnover, and profitability ratios like profit margin and return on equity. The assignment also utilizes the DuPont equation to evaluate return on equity. The analysis compares the company's performance against industry averages, highlighting strengths like the current ratio and profit margin, and weaknesses like day sales outstanding and return on equity. The document includes references to relevant financial literature to support the analysis.
Document Page
Running head: FINANCE
Finance
Name of the student
Name of the university
Student ID
Author note
tabler-icon-diamond-filled.svg

Paraphrase This Document

Need a fresh take? Get an instant paraphrase of this document with our AI Paraphraser
Document Page
1FINANCE
Table of Contents
Part A: Financial statements and cash flows..............................................................................2
Answer A...............................................................................................................................2
Answer B................................................................................................................................2
Answer C................................................................................................................................2
Part B: Analysis of financial statements....................................................................................3
Answer 1................................................................................................................................3
Answer 2................................................................................................................................3
Answer 3................................................................................................................................3
Reference....................................................................................................................................5
Document Page
2FINANCE
Part A: Financial statements and cash flows
Answer A
Net income of the company = fr 2.5 million
EBIT = fr 5 million
Tax rate = 35%
Therefore, pre-tax income = 2.5 / (1-0.35) = fr 3.85 million
Interest expense = EBIT – taxable income
Interest expense = fr 5 million – fr 3.85 million = fr 1.15 million
Answer B
Net income = fr 5.8 million
Depreciation = fr 0.2 million
Net cash flow = Net income + depreciation
Net cash flow = fr 5.8 million + fr 0.2 million = fr 6.0 million.
Answer C
EBIT = fr 880,000
Depreciation expenses = fr 150,000
Tax rate = 35%
Net income = 880,000 – (880,000 * 0.35) = fr 572,000
Net cash flow = Net income + depreciation
Document Page
3FINANCE
Net cash flow = fr 880,000 + fr 150,000 = fr 6.0 million = fr 1030,000
Part B: Analysis of financial statements
Answer 1
Calculation of ratios
Ratio Formula Webster Industry average
Current ratio Current assets/current liabilities 2.01 2.00
Day sales outstanding
Account receivable/(sales/365
days) 76.65 35.00 days
Inventory turnover Cost of goods sold/ inventory 5.67 6.70
Fixed asset turnover Net sales/fixed assets 5.56 12.10
Total asset turnover Net sales/total assets 1.75 3.00
Profit margin Net profit/sales 1.51% 1.20%
Return on assets Net profit/total assets 2.64% 3.60%
Return on equity Net profit/total equity 6.45% 9.00%
Debt ratio Long term liabilities/total assets 25.00% 30.00%
Total debt ratio Total liabilities/total assets 59.00% 60.00%
Answer 2
DU PONT equation
DU PONT = net profit / revenue * revenue / total assets * total assets / equity ( Curtis, Lewis-
Western and Toynbee 2015)
Hence, DU PONT = Net profit / equity
For industry = 9.00%
For Webster = 6.45%
Answer 3
From the analysis it can be identified that the strength of the company is its current
ratio and profit margin as both are better as compared to the industry average. On the
tabler-icon-diamond-filled.svg

Paraphrase This Document

Need a fresh take? Get an instant paraphrase of this document with our AI Paraphraser
Document Page
4FINANCE
contrary, the weakness of the company is day sales outstanding as the industry average is 35
days whereas the company is taking 76.65 days for collecting its receivables from sales
(Wahlen, Baginski and Bradshaw 2014). Further, the return on equity is another weakness as
the ROE of the company is only 6.45% as compared to the industry average of 9.00%.
Document Page
5FINANCE
Reference
Curtis, A., Lewis-Western, M.F. and Toynbee, S., 2015. Historical cost measurement and the
use of DuPont analysis by market participants. Review of Accounting Studies, 20(3), pp.1210-
1245.
Wahlen, J., Baginski, S. and Bradshaw, M., 2014. Financial reporting, financial statement
analysis and valuation. Nelson Education.
chevron_up_icon
1 out of 6
circle_padding
hide_on_mobile
zoom_out_icon
[object Object]