Financial Derivatives and Portfolio Management Assignment
VerifiedAdded on 2023/05/28
|23
|2417
|187
Homework Assignment
AI Summary
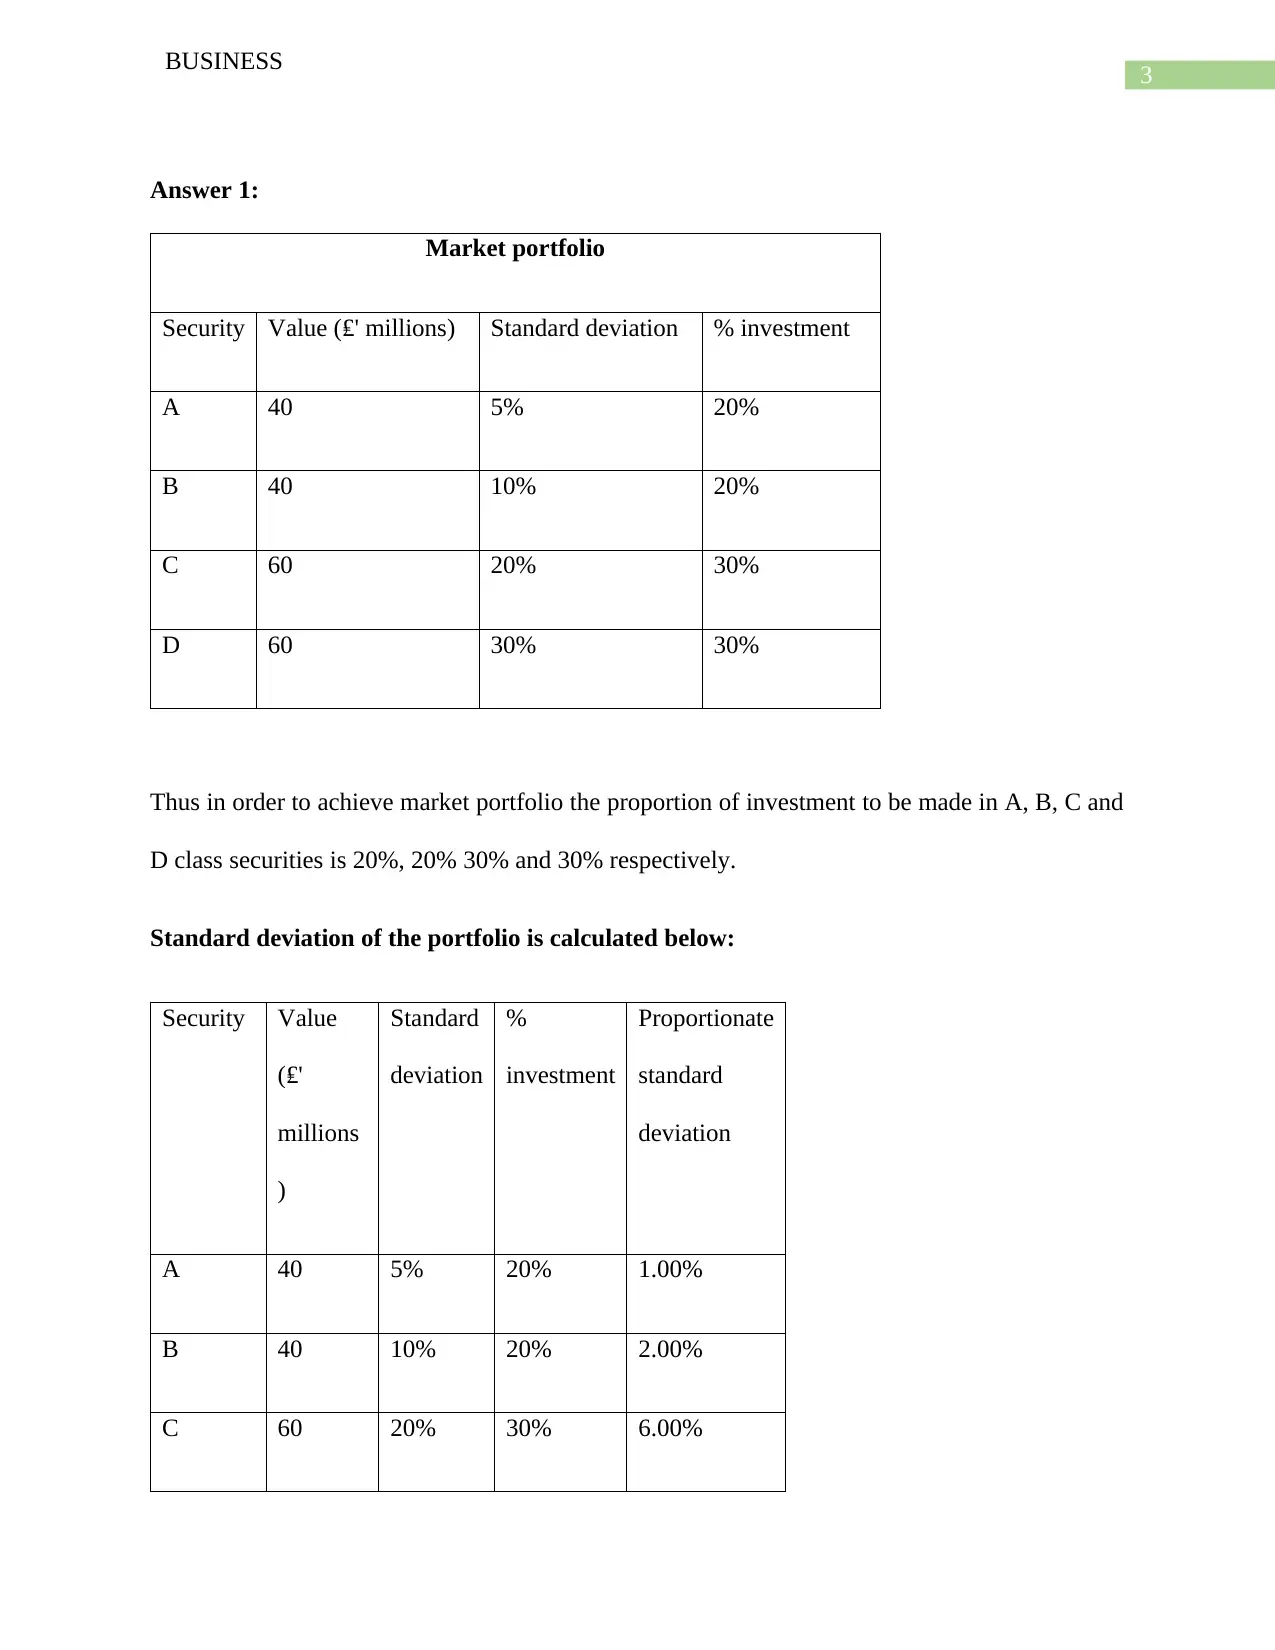
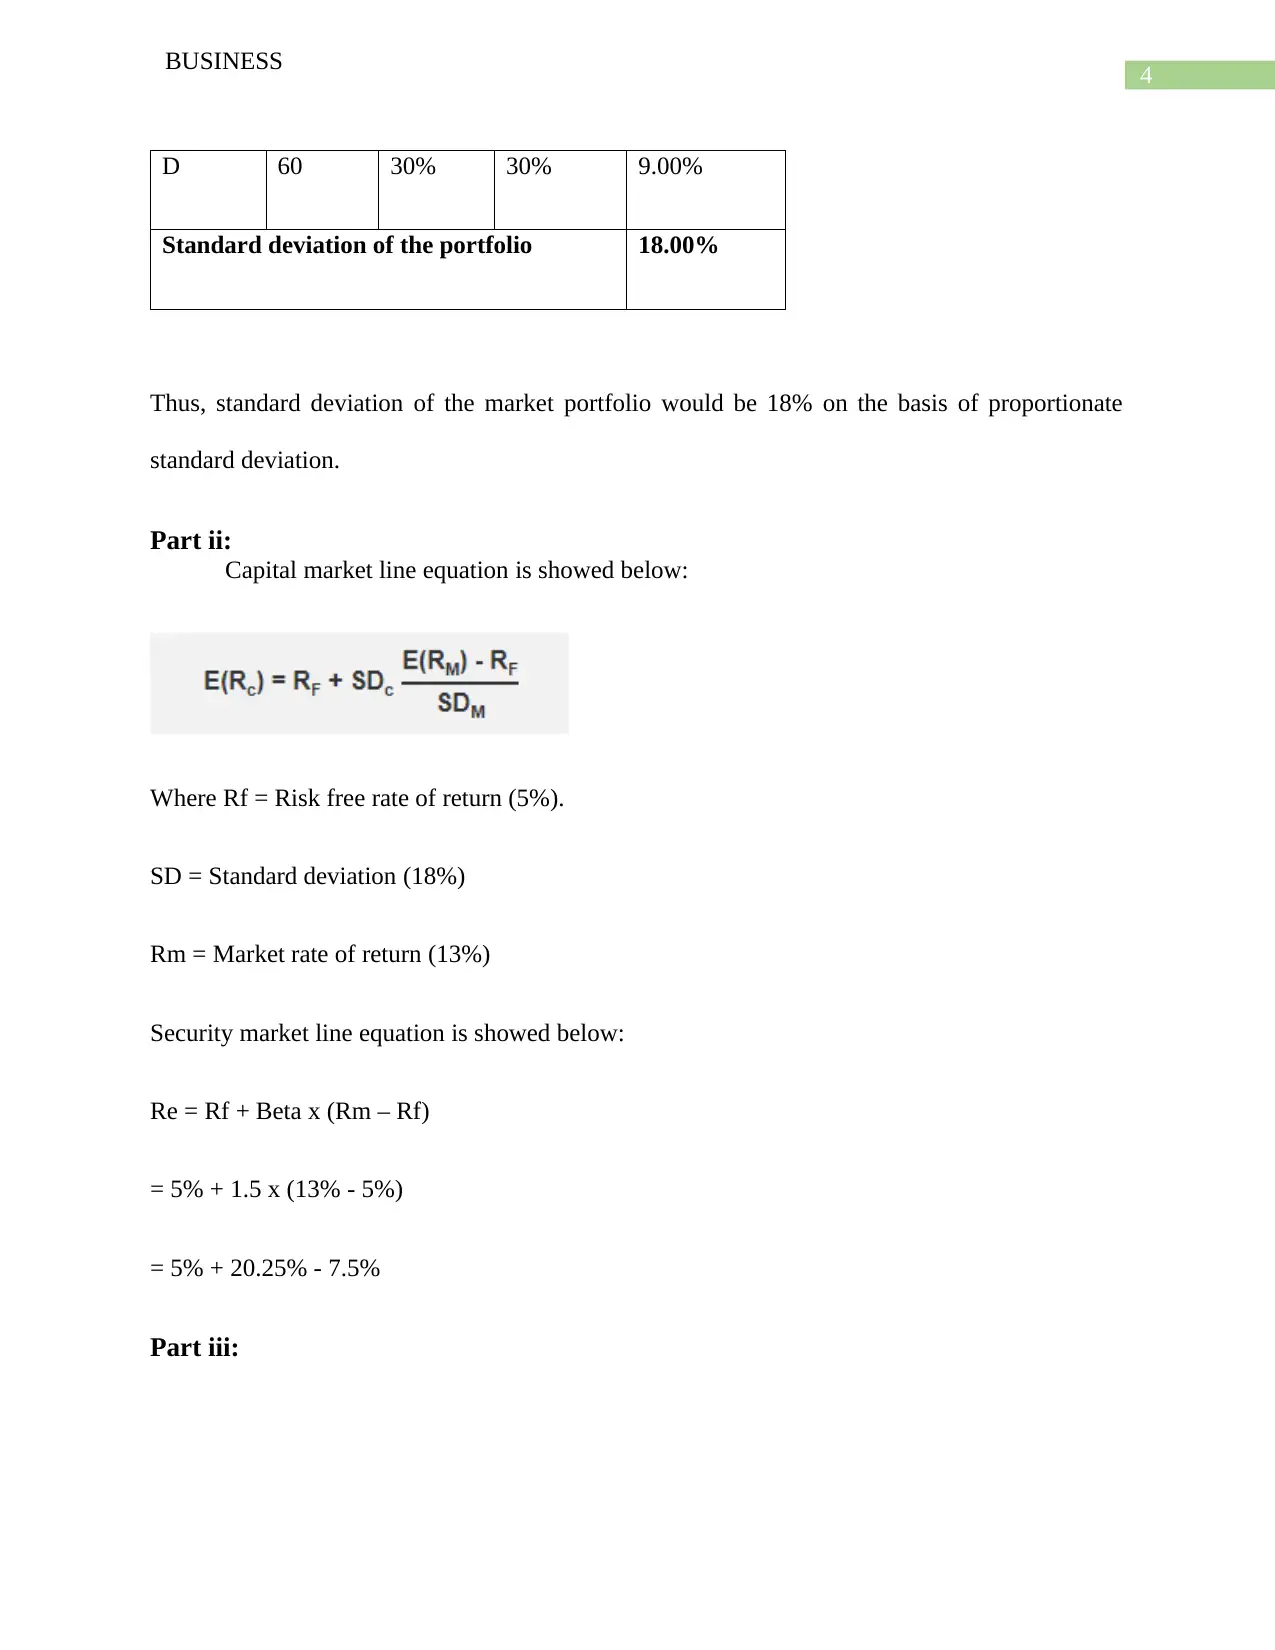
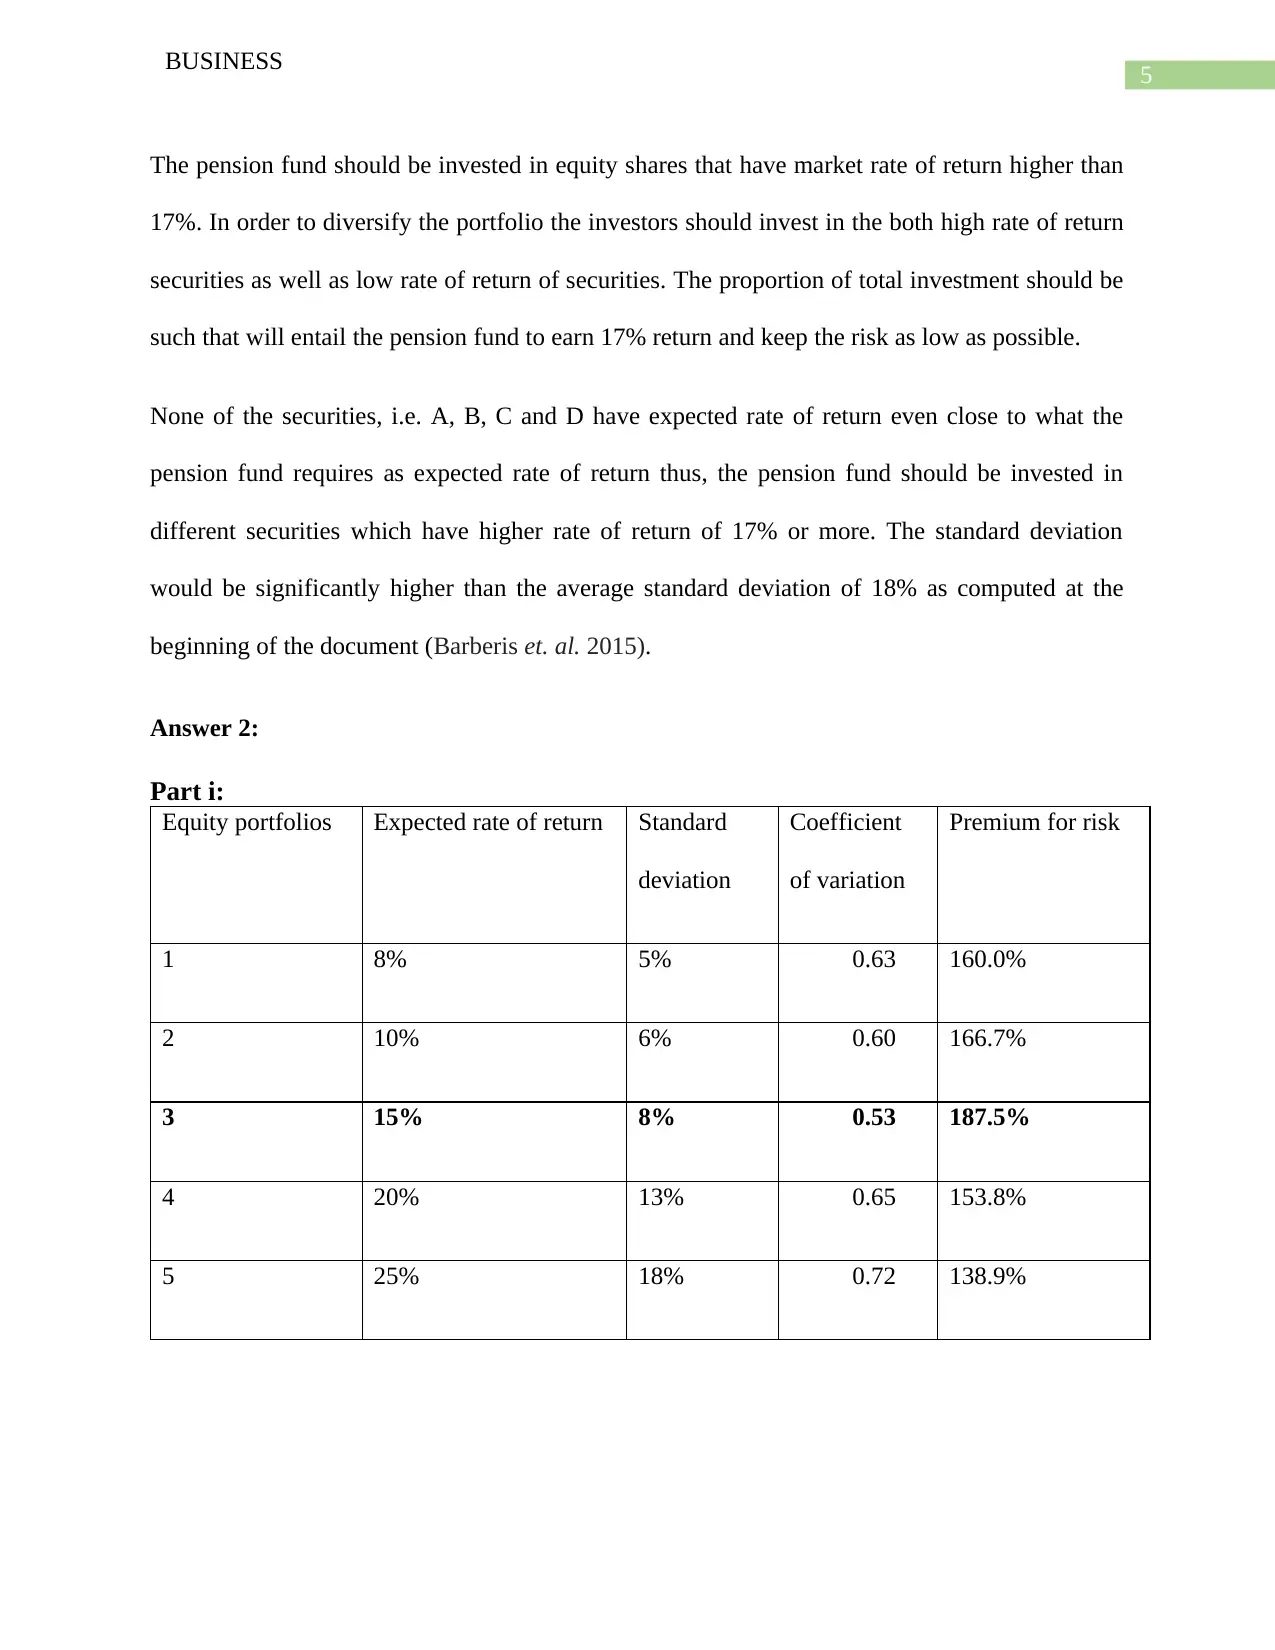
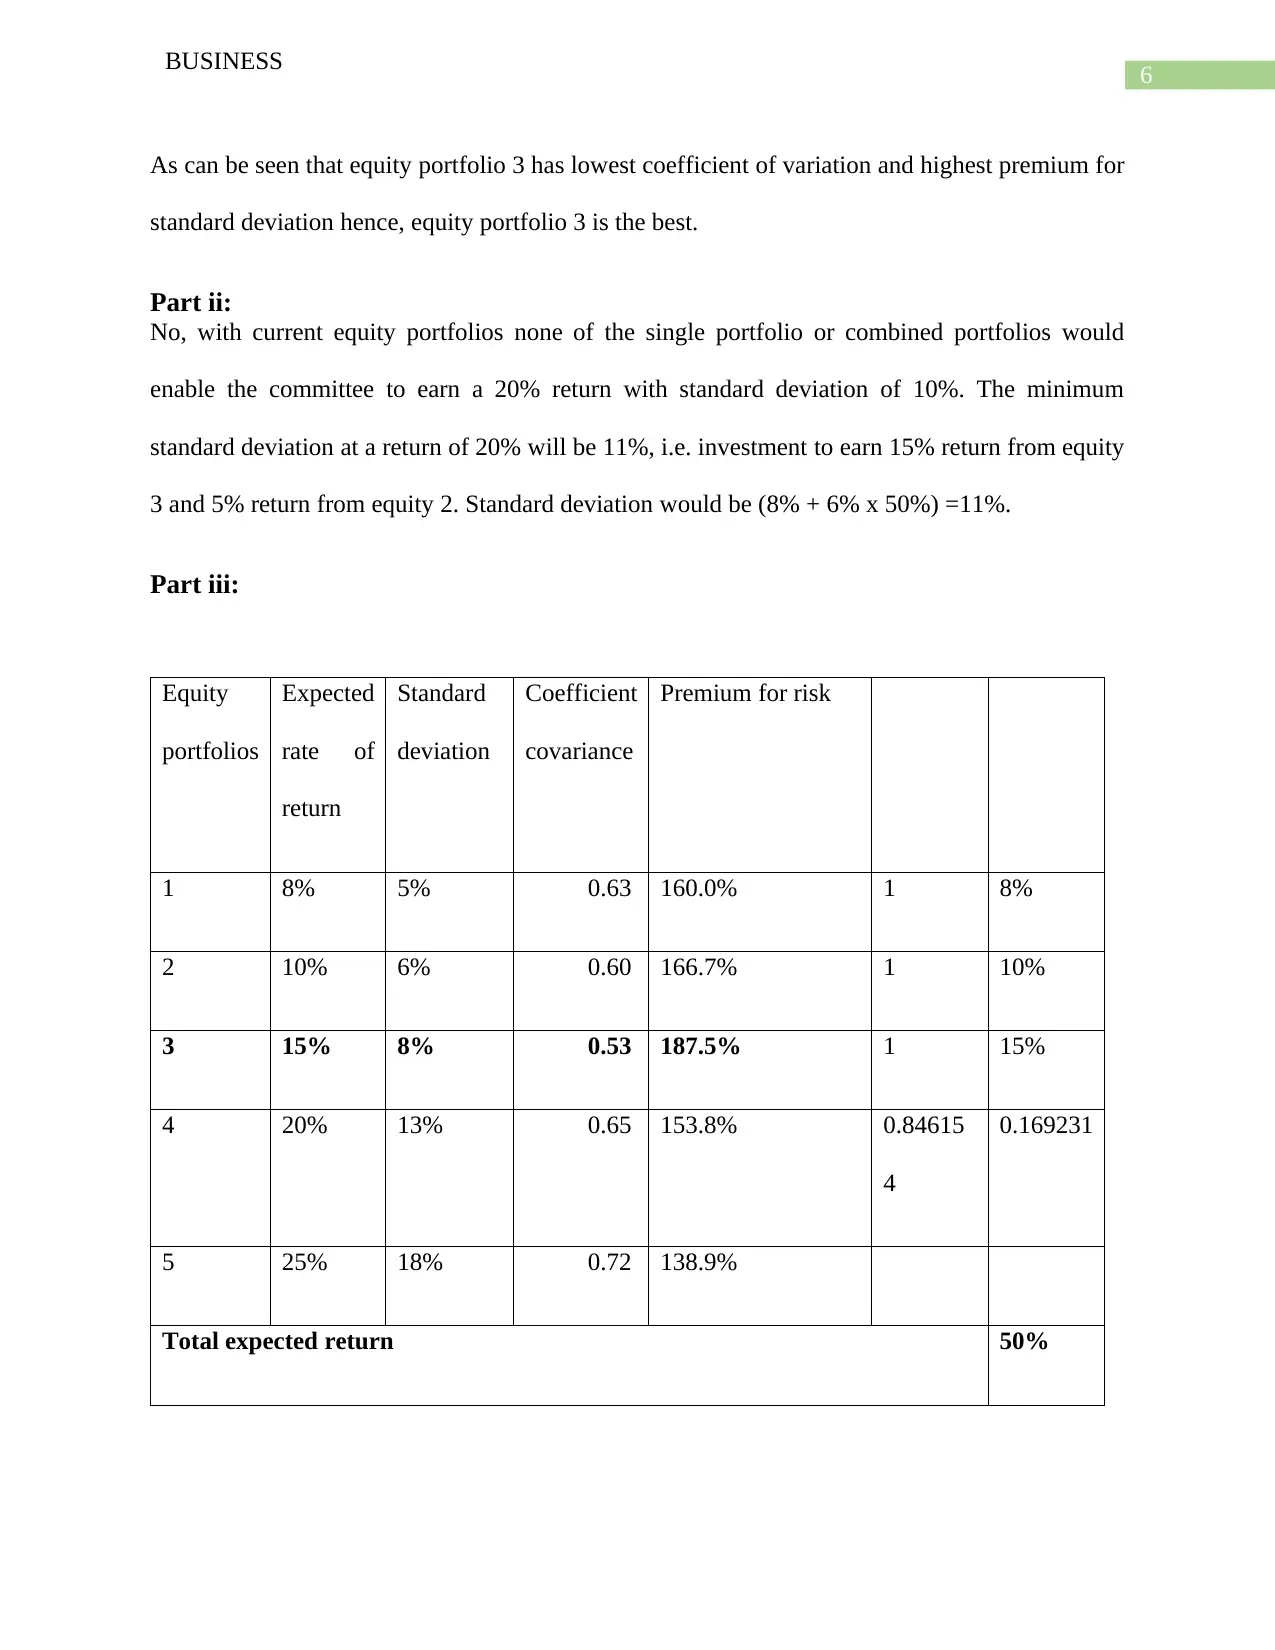
This comprehensive finance assignment delves into various aspects of financial management, including portfolio construction, risk analysis, and valuation techniques. It begins with an analysis of market portfolios, calculating standard deviations and applying the Capital Asset Pricing Model (CAPM) to determine expected returns. The assignment then explores equity portfolios, evaluating their performance based on different metrics and assessing the impact of diversification. Bond valuation is another key area, with calculations of Macaulay and modified duration, and the analysis of bond yields and price changes. The use of financial derivatives, such as futures and options, is also examined, including forward contracts, put options, and the Black-Scholes model. Additionally, the assignment considers the impact of debt-to-equity ratios on the rate of return and provides insights into currency exchange rate risk and hedging strategies. Overall, this assignment provides a detailed overview of financial concepts and practical applications, equipping students with essential knowledge for financial decision-making.


1 out of 23
Related Documents


Your All-in-One AI-Powered Toolkit for Academic Success.
+13062052269
info@desklib.com
Available 24*7 on WhatsApp / Email
![[object Object]](/_next/static/media/star-bottom.7253800d.svg)
Copyright © 2020–2026 A2Z Services. All Rights Reserved. Developed and managed by ZUCOL.