Financial Analysis Management Report: Astro Malaysia Holdings Berhad
VerifiedAdded on 2023/06/15
|23
|6174
|325
Report
AI Summary
This report provides a comprehensive financial analysis of Astro Malaysia Holdings Berhad, a Malaysian media and entertainment company. It begins by detailing the company's background, market presence, and the dynamics of the Malaysian mass media and entertainment industry, including regulatory restrictions and the shift from old to new media. The report then evaluates the company's financial performance over five years, focusing on profitability (gross and net profit margins), liquidity (times interest earned ratio), efficiency, capital structure, investor returns, and cash flows. Key drivers of change affecting Astro Malaysia Holdings are identified as consumer behavior, regulatory changes, technological advancements, and macroeconomic conditions. The analysis uses financial ratios and graphs to illustrate trends and provides insights into the company's strengths and areas for improvement. This report is useful for investors and those interested in the financial health and strategic challenges of media companies in Malaysia. Desklib provides access to similar solved assignments and past papers for students.
Running head: FINANCIAL ANALYSIS MANAGEMENT
Financial Analysis Management
Name of the Student
Name of the University
Author’s Note
Financial Analysis Management
Name of the Student
Name of the University
Author’s Note
Paraphrase This Document
Need a fresh take? Get an instant paraphrase of this document with our AI Paraphraser
1FINANCIAL ANALYSIS MANAGEMENT
Table of Contents
Company and Market Details..........................................................................................................2
Industry Dynamics and Drivers of Change.....................................................................................3
Evaluation of Financial Performance..............................................................................................5
Profitability Analysis...................................................................................................................5
Liquidity Position Analysis.........................................................................................................7
Efficiency Analysis......................................................................................................................9
Capital Structure Analysis.........................................................................................................11
Investor Return Analysis...........................................................................................................13
Analysis of Cash Flows.................................................................................................................14
References......................................................................................................................................17
Appendix........................................................................................................................................20
2FINANCIAL ANALYSIS MANAGEMENT
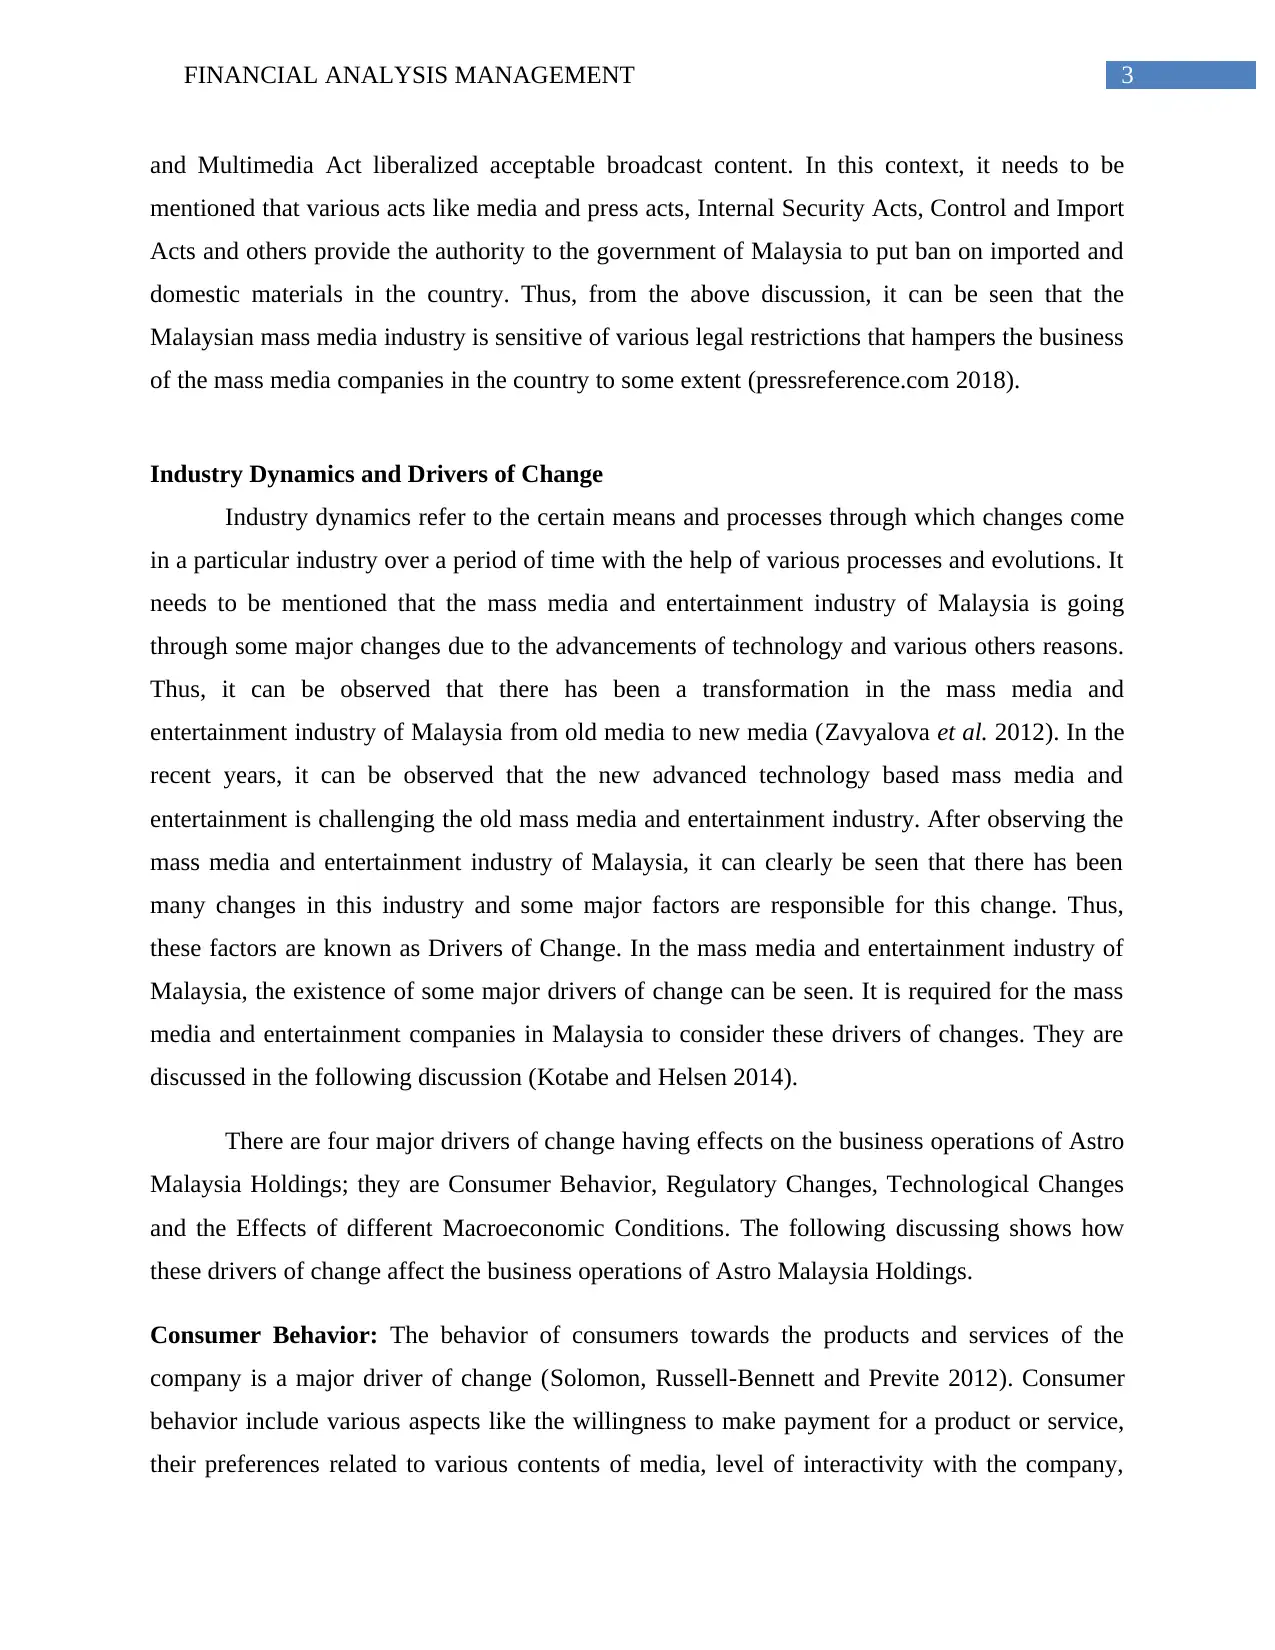
Company and Market Details
Astro Malaysia Holdings Berhad is a media and entertainment Company operates in the
regions of Malaysia. More specifically, it can be said that Astro Malaysia Holdings is a
Malaysian and ASEAN consumer and content company (corporate.astro.com.my 2018). In the
recent years, the company has taken strong commitment towards becoming a technology-driven
business organization in the TV, digital, e-commerce and radio space. The company was
established in the year of 1996 and it is headquartered at Technology Park Malaysia, Kuala
Lumpur, Malaysia. The main products of the company are pay television, broadcasting and
publishing. Astro Malaysia Holdings has a customer base of 5.8 million that is considered as the
71% of the total household of Malaysia. The company offers vast range of media and
entertainment spanning across different digital media, television, radio and home shopping to
almost 21 million individuals (corporate.astro.com.my 2018). The major value propositions of
Astro Malaysia Holdings includes the broadcast of 188 TV channels via DTH Satellite TV, OTT
and IPTV platforms; among all these, 60 includes in the brand of Astro and 72 are HD. Apart
from this, the company also offers various other services like HD, PVR, OD, IPTV and many
others. In this context, it needs to be mentioned that the main aim of the company is to originate
and create excellent content for consumption in the different regions of Malaysia. Astro Malaysia
Holdings has won different awards for their different products and services. The company has
won Gold Award in the category of media and entertainment of the Putra Brand Awards for the
last six years. Apart from this, the company has also won Brand of the Year award and Brand
Icon award in the year 2012 and 2013 respectively (corporate.astro.com.my 2018).
The mass media and entertainment industry of Malaysia is considered as a major industry
of the company as it contributes significantly towards the economic development of the country.
The government of Malaysia and the ruling political party control the mass media and
entertainment industry. Thus, all the mass media and entertainment companies of Malaysia need
to acquire business license from the government of the company and the licenses are required to
be renewed at regular period (factsanddetails.com 2018). In most of the cases, the mainstream
mass media is pro-government. Most importantly, the media and entertainment industry of
Malaysia is subject to various legal restrictions. In 1998, the implementation of Communications
⊘ This is a preview!⊘
Do you want full access?
Subscribe today to unlock all pages.
Trusted by 1+ million students worldwide
3FINANCIAL ANALYSIS MANAGEMENT
and Multimedia Act liberalized acceptable broadcast content. In this context, it needs to be
mentioned that various acts like media and press acts, Internal Security Acts, Control and Import
Acts and others provide the authority to the government of Malaysia to put ban on imported and
domestic materials in the country. Thus, from the above discussion, it can be seen that the
Malaysian mass media industry is sensitive of various legal restrictions that hampers the business
of the mass media companies in the country to some extent (pressreference.com 2018).
Industry Dynamics and Drivers of Change
Industry dynamics refer to the certain means and processes through which changes come
in a particular industry over a period of time with the help of various processes and evolutions. It
needs to be mentioned that the mass media and entertainment industry of Malaysia is going
through some major changes due to the advancements of technology and various others reasons.
Thus, it can be observed that there has been a transformation in the mass media and
entertainment industry of Malaysia from old media to new media (Zavyalova et al. 2012). In the
recent years, it can be observed that the new advanced technology based mass media and
entertainment is challenging the old mass media and entertainment industry. After observing the
mass media and entertainment industry of Malaysia, it can clearly be seen that there has been
many changes in this industry and some major factors are responsible for this change. Thus,
these factors are known as Drivers of Change. In the mass media and entertainment industry of
Malaysia, the existence of some major drivers of change can be seen. It is required for the mass
media and entertainment companies in Malaysia to consider these drivers of changes. They are
discussed in the following discussion (Kotabe and Helsen 2014).
There are four major drivers of change having effects on the business operations of Astro
Malaysia Holdings; they are Consumer Behavior, Regulatory Changes, Technological Changes
and the Effects of different Macroeconomic Conditions. The following discussing shows how
these drivers of change affect the business operations of Astro Malaysia Holdings.
Consumer Behavior: The behavior of consumers towards the products and services of the
company is a major driver of change (Solomon, Russell-Bennett and Previte 2012). Consumer
behavior include various aspects like the willingness to make payment for a product or service,
their preferences related to various contents of media, level of interactivity with the company,
Paraphrase This Document
Need a fresh take? Get an instant paraphrase of this document with our AI Paraphraser
4FINANCIAL ANALYSIS MANAGEMENT
privacy, genre and many others. It can be seen that all these aspects have large impact on the
business model of Astro Malaysia Holding along with their media services, prices, profit margin
and others. For example, the consumers of Malaysia have become fond of the e-media; and
based on this particular preference of the consumers, Astro Malaysia Holdings has had to change
their business model (Schütte and Ciarlante 2016).
Regulatory Changes: As per the earlier discussion, the mass media and entertainment industry
of Malaysia has to comply with various legislative regulations and all these aspects affect the
business operations of Astro Malaysia Holdings (Keane and Donald 2014). This particular driver
of change includes various aspects like privacy regulation, net neutrality, various antitrust
enforcements, copyright enforcement, censorship, regulations related to advertisement, universal
broadcasting regulations and many others. All these aspects have negative impact on the
profitability of the company as the company needs to comply with all these legislative
regulations. In addition, frequent changes can be seen in the legal regulations and it is difficult
for Astro Malaysia Holdings to change the compliance with these regulations on time-to-time
basis. Thus, it is considered as a major driver of change for Astro Malaysia Holdings (Pepinsky
2013).
Technological Changes: Technological change is considered as one of the major drivers of
change having impact on the business operations of Astro Malaysia Holdings. This driver of
change includes some major aspects like ultra HD television, flexible screens, semantic analysis,
advanced technology of power system, ultra broadband services and many others (Jomo 2013).
For this reason, it is required for the company to update themselves with the latest technology in
order to stay in the market. This process affects the profitability of Astro Malaysia Holdings as
the company has to incur large amount of costs while implementing these advance technological
aspects. At the same time, this also brings positive changes in the company as the company has
become able to increase their revenue (Hashim 2015).
Macroeconomics Conditions: This is also considered as a major driver of change. The major
factors of this driver are recession, balance of trade, price of commodity, supply, demand and
many others. These factors are considered as less predictable; but at the same time, they have
drastic impact on the business organizations of the company (Nor, Ibrahim and Rashid 2013).

5FINANCIAL ANALYSIS MANAGEMENT
⊘ This is a preview!⊘
Do you want full access?
Subscribe today to unlock all pages.
Trusted by 1+ million students worldwide
6FINANCIAL ANALYSIS MANAGEMENT
Evaluation of Financial Performance
Evaluation of financial performance of the business organizations indicates towards the
overall financial condition of the businesses over the years. The evaluation of financial
performance is a useful tool for the investors as they can make investment decisions by
analyzing the trend of financial performance of the companies (Brigham and Houston 2012).
There is not any exception of this fact in case of Astro Malaysia Holdings. The following
discussion shows the evaluation of the financial performance of the company by analyzing the
profitability, liquidity, efficiency, debt position of the company along with the analysis of
investors return.
Profitability Analysis
Gross Profit Ratio
2017 2016 2015 2014 2013
34.50%
35.00%
35.50%
36.00%
36.50%
37.00%
37.50%
38.00%
38.50%
39.00% 38.33% 38.34%
36.13%
36.93%
38.81%
Gross Profit Ratio
Gross Profit Ratio (A/C)
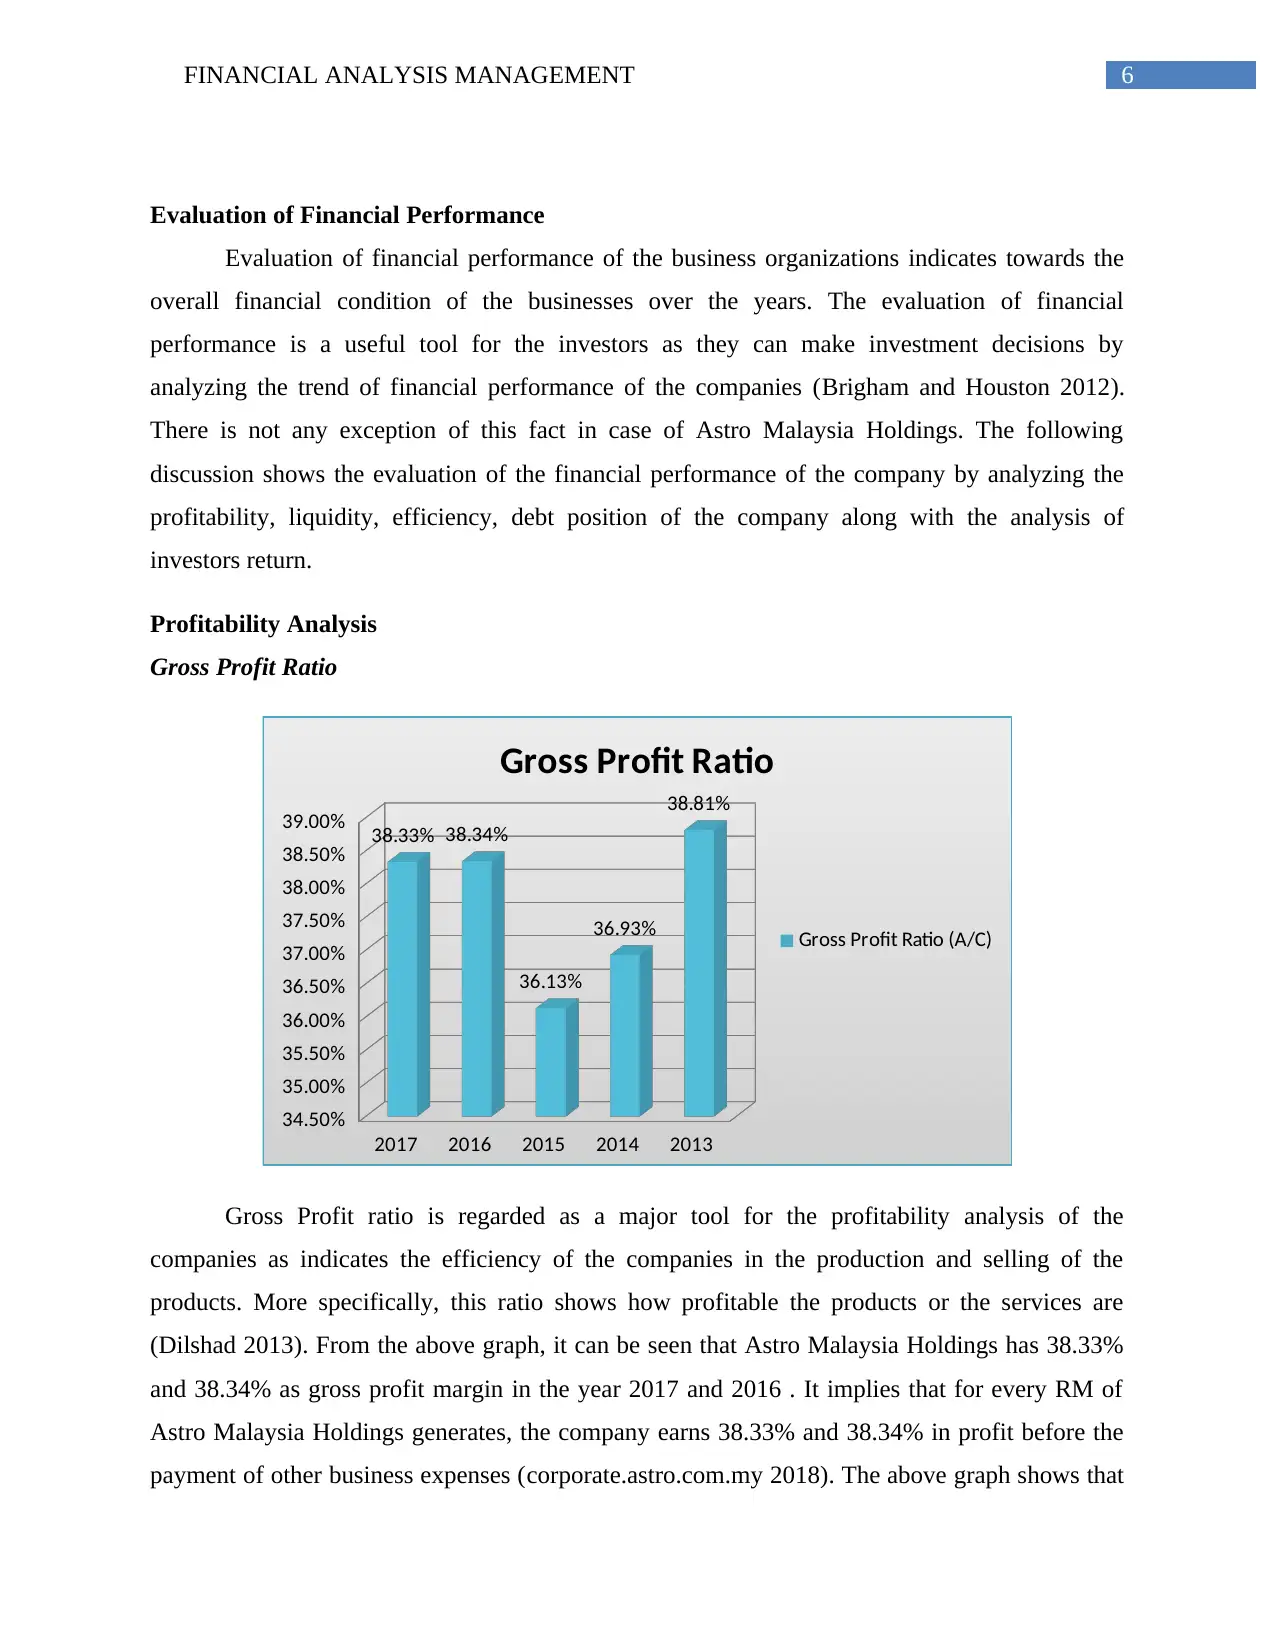
Gross Profit ratio is regarded as a major tool for the profitability analysis of the
companies as indicates the efficiency of the companies in the production and selling of the
products. More specifically, this ratio shows how profitable the products or the services are
(Dilshad 2013). From the above graph, it can be seen that Astro Malaysia Holdings has 38.33%
and 38.34% as gross profit margin in the year 2017 and 2016 . It implies that for every RM of
Astro Malaysia Holdings generates, the company earns 38.33% and 38.34% in profit before the
payment of other business expenses (corporate.astro.com.my 2018). The above graph shows that
Evaluation of Financial Performance
Evaluation of financial performance of the business organizations indicates towards the
overall financial condition of the businesses over the years. The evaluation of financial
performance is a useful tool for the investors as they can make investment decisions by
analyzing the trend of financial performance of the companies (Brigham and Houston 2012).
There is not any exception of this fact in case of Astro Malaysia Holdings. The following
discussion shows the evaluation of the financial performance of the company by analyzing the
profitability, liquidity, efficiency, debt position of the company along with the analysis of
investors return.
Profitability Analysis
Gross Profit Ratio
2017 2016 2015 2014 2013
34.50%
35.00%
35.50%
36.00%
36.50%
37.00%
37.50%
38.00%
38.50%
39.00% 38.33% 38.34%
36.13%
36.93%
38.81%
Gross Profit Ratio
Gross Profit Ratio (A/C)
Gross Profit ratio is regarded as a major tool for the profitability analysis of the
companies as indicates the efficiency of the companies in the production and selling of the
products. More specifically, this ratio shows how profitable the products or the services are
(Dilshad 2013). From the above graph, it can be seen that Astro Malaysia Holdings has 38.33%
and 38.34% as gross profit margin in the year 2017 and 2016 . It implies that for every RM of
Astro Malaysia Holdings generates, the company earns 38.33% and 38.34% in profit before the
payment of other business expenses (corporate.astro.com.my 2018). The above graph shows that
Paraphrase This Document
Need a fresh take? Get an instant paraphrase of this document with our AI Paraphraser
7FINANCIAL ANALYSIS MANAGEMENT
there have been fluctuations in this gross profit margin over the five years as 2015 and 2014
witnessed decline in the gross profit. It needs to be mentioned that the main reason behind this
fluctuation in gross profit margin is the decline in sales of Astro Malaysia Holdings. It is evident
from the financial statements of the company that there has been decline in sales in 2015 and
2014 that affected the gross profit margin. Thus, for Astro Malaysia Holdings, some of the major
ways to improve their gross profit margin are th increase in sales, increase in the price, less
discounting and less competition in price.
Net Profit Ratio
2017 2016 2015 2014 2013
8.00%
8.50%
9.00%
9.50%
10.00%
10.50%
11.00%
11.50% 10.99% 11.10%
9.82%
9.35%
9.84%
Net Profit Ratio
Net Profit Ratio (B/C)
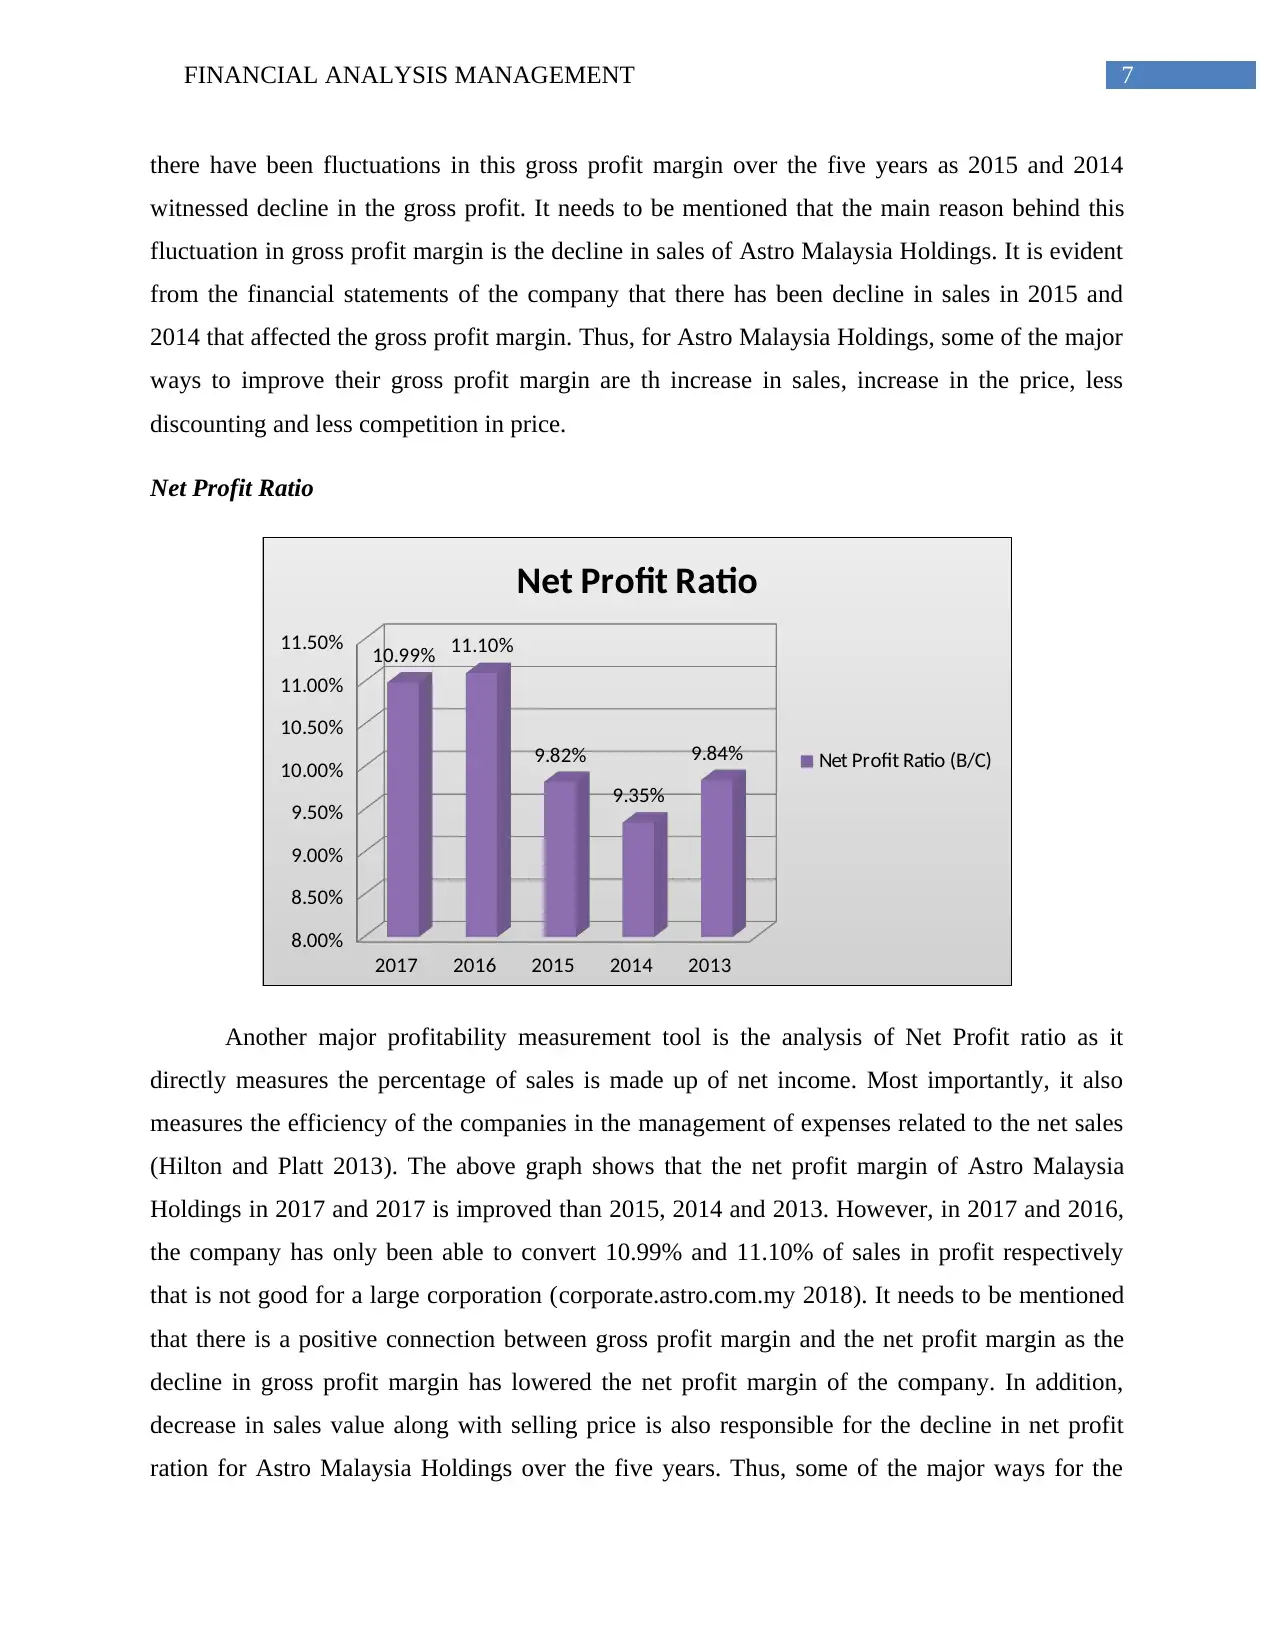
Another major profitability measurement tool is the analysis of Net Profit ratio as it
directly measures the percentage of sales is made up of net income. Most importantly, it also
measures the efficiency of the companies in the management of expenses related to the net sales
(Hilton and Platt 2013). The above graph shows that the net profit margin of Astro Malaysia
Holdings in 2017 and 2017 is improved than 2015, 2014 and 2013. However, in 2017 and 2016,
the company has only been able to convert 10.99% and 11.10% of sales in profit respectively
that is not good for a large corporation (corporate.astro.com.my 2018). It needs to be mentioned
that there is a positive connection between gross profit margin and the net profit margin as the
decline in gross profit margin has lowered the net profit margin of the company. In addition,
decrease in sales value along with selling price is also responsible for the decline in net profit
ration for Astro Malaysia Holdings over the five years. Thus, some of the major ways for the
there have been fluctuations in this gross profit margin over the five years as 2015 and 2014
witnessed decline in the gross profit. It needs to be mentioned that the main reason behind this
fluctuation in gross profit margin is the decline in sales of Astro Malaysia Holdings. It is evident
from the financial statements of the company that there has been decline in sales in 2015 and
2014 that affected the gross profit margin. Thus, for Astro Malaysia Holdings, some of the major
ways to improve their gross profit margin are th increase in sales, increase in the price, less
discounting and less competition in price.
Net Profit Ratio
2017 2016 2015 2014 2013
8.00%
8.50%
9.00%
9.50%
10.00%
10.50%
11.00%
11.50% 10.99% 11.10%
9.82%
9.35%
9.84%
Net Profit Ratio
Net Profit Ratio (B/C)
Another major profitability measurement tool is the analysis of Net Profit ratio as it
directly measures the percentage of sales is made up of net income. Most importantly, it also
measures the efficiency of the companies in the management of expenses related to the net sales
(Hilton and Platt 2013). The above graph shows that the net profit margin of Astro Malaysia
Holdings in 2017 and 2017 is improved than 2015, 2014 and 2013. However, in 2017 and 2016,
the company has only been able to convert 10.99% and 11.10% of sales in profit respectively
that is not good for a large corporation (corporate.astro.com.my 2018). It needs to be mentioned
that there is a positive connection between gross profit margin and the net profit margin as the
decline in gross profit margin has lowered the net profit margin of the company. In addition,
decrease in sales value along with selling price is also responsible for the decline in net profit
ration for Astro Malaysia Holdings over the five years. Thus, some of the major ways for the
8FINANCIAL ANALYSIS MANAGEMENT
company to increase their net profit margin are the increase in sales and decrease in labor as well
as operation costs.
Liquidity Position Analysis
Times Interest Earned Ratio
2017 2016 2015 2014 2013
0.00
0.50
1.00
1.50
2.00
2.50
3.00
3.50
4.00
4.50 4.03
3.22
3.69
2.90 2.82
Times Interest Earned Ratio
Times Interest Earned Ratio
(D/E)
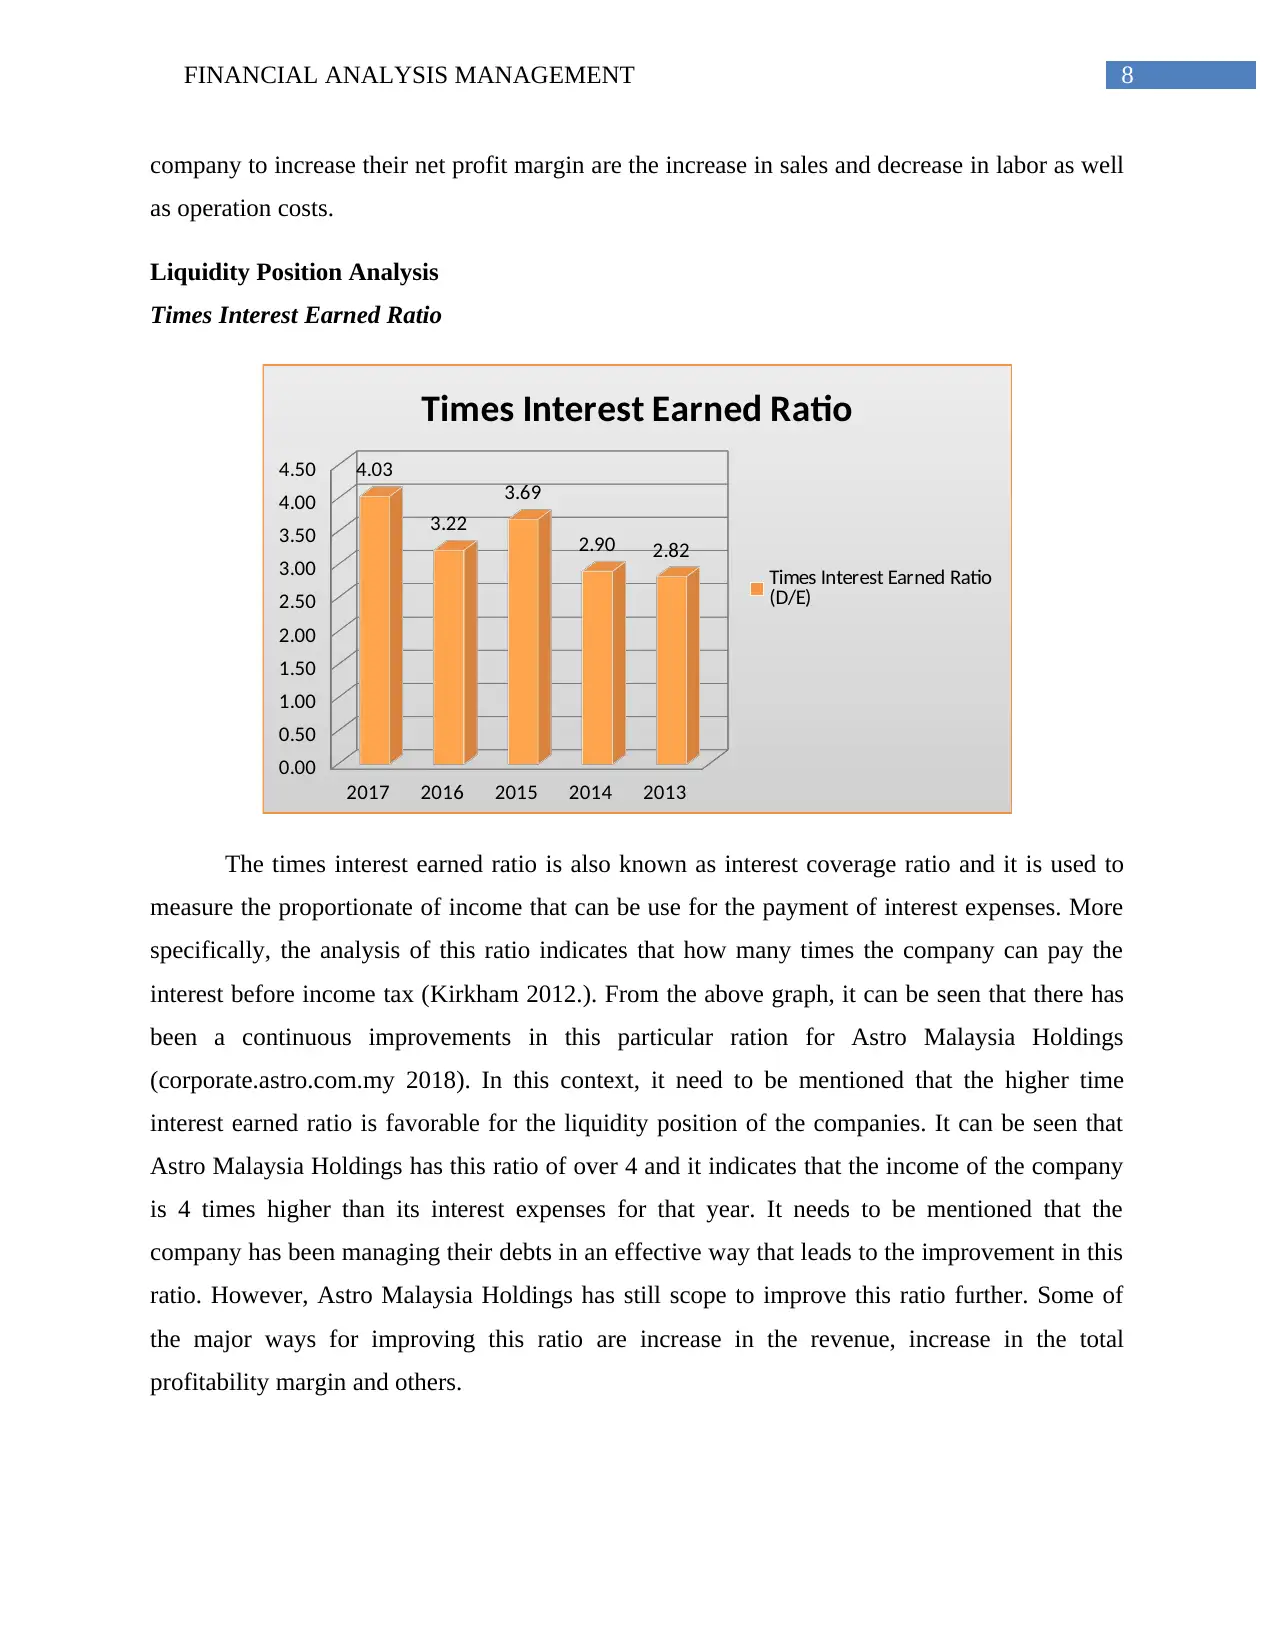
The times interest earned ratio is also known as interest coverage ratio and it is used to
measure the proportionate of income that can be use for the payment of interest expenses. More
specifically, the analysis of this ratio indicates that how many times the company can pay the
interest before income tax (Kirkham 2012.). From the above graph, it can be seen that there has
been a continuous improvements in this particular ration for Astro Malaysia Holdings
(corporate.astro.com.my 2018). In this context, it need to be mentioned that the higher time
interest earned ratio is favorable for the liquidity position of the companies. It can be seen that
Astro Malaysia Holdings has this ratio of over 4 and it indicates that the income of the company
is 4 times higher than its interest expenses for that year. It needs to be mentioned that the
company has been managing their debts in an effective way that leads to the improvement in this
ratio. However, Astro Malaysia Holdings has still scope to improve this ratio further. Some of
the major ways for improving this ratio are increase in the revenue, increase in the total
profitability margin and others.
company to increase their net profit margin are the increase in sales and decrease in labor as well
as operation costs.
Liquidity Position Analysis
Times Interest Earned Ratio
2017 2016 2015 2014 2013
0.00
0.50
1.00
1.50
2.00
2.50
3.00
3.50
4.00
4.50 4.03
3.22
3.69
2.90 2.82
Times Interest Earned Ratio
Times Interest Earned Ratio
(D/E)
The times interest earned ratio is also known as interest coverage ratio and it is used to
measure the proportionate of income that can be use for the payment of interest expenses. More
specifically, the analysis of this ratio indicates that how many times the company can pay the
interest before income tax (Kirkham 2012.). From the above graph, it can be seen that there has
been a continuous improvements in this particular ration for Astro Malaysia Holdings
(corporate.astro.com.my 2018). In this context, it need to be mentioned that the higher time
interest earned ratio is favorable for the liquidity position of the companies. It can be seen that
Astro Malaysia Holdings has this ratio of over 4 and it indicates that the income of the company
is 4 times higher than its interest expenses for that year. It needs to be mentioned that the
company has been managing their debts in an effective way that leads to the improvement in this
ratio. However, Astro Malaysia Holdings has still scope to improve this ratio further. Some of
the major ways for improving this ratio are increase in the revenue, increase in the total
profitability margin and others.
⊘ This is a preview!⊘
Do you want full access?
Subscribe today to unlock all pages.
Trusted by 1+ million students worldwide
9FINANCIAL ANALYSIS MANAGEMENT
Quick Ratio
2017 2016 2015 2014 2013
-
0.20
0.40
0.60
0.80
1.00
1.20
1.40
1.60
0.74
0.91
1.04
1.52 1.51
Quick Ratio
Quick Ratio {(A-C)/B}
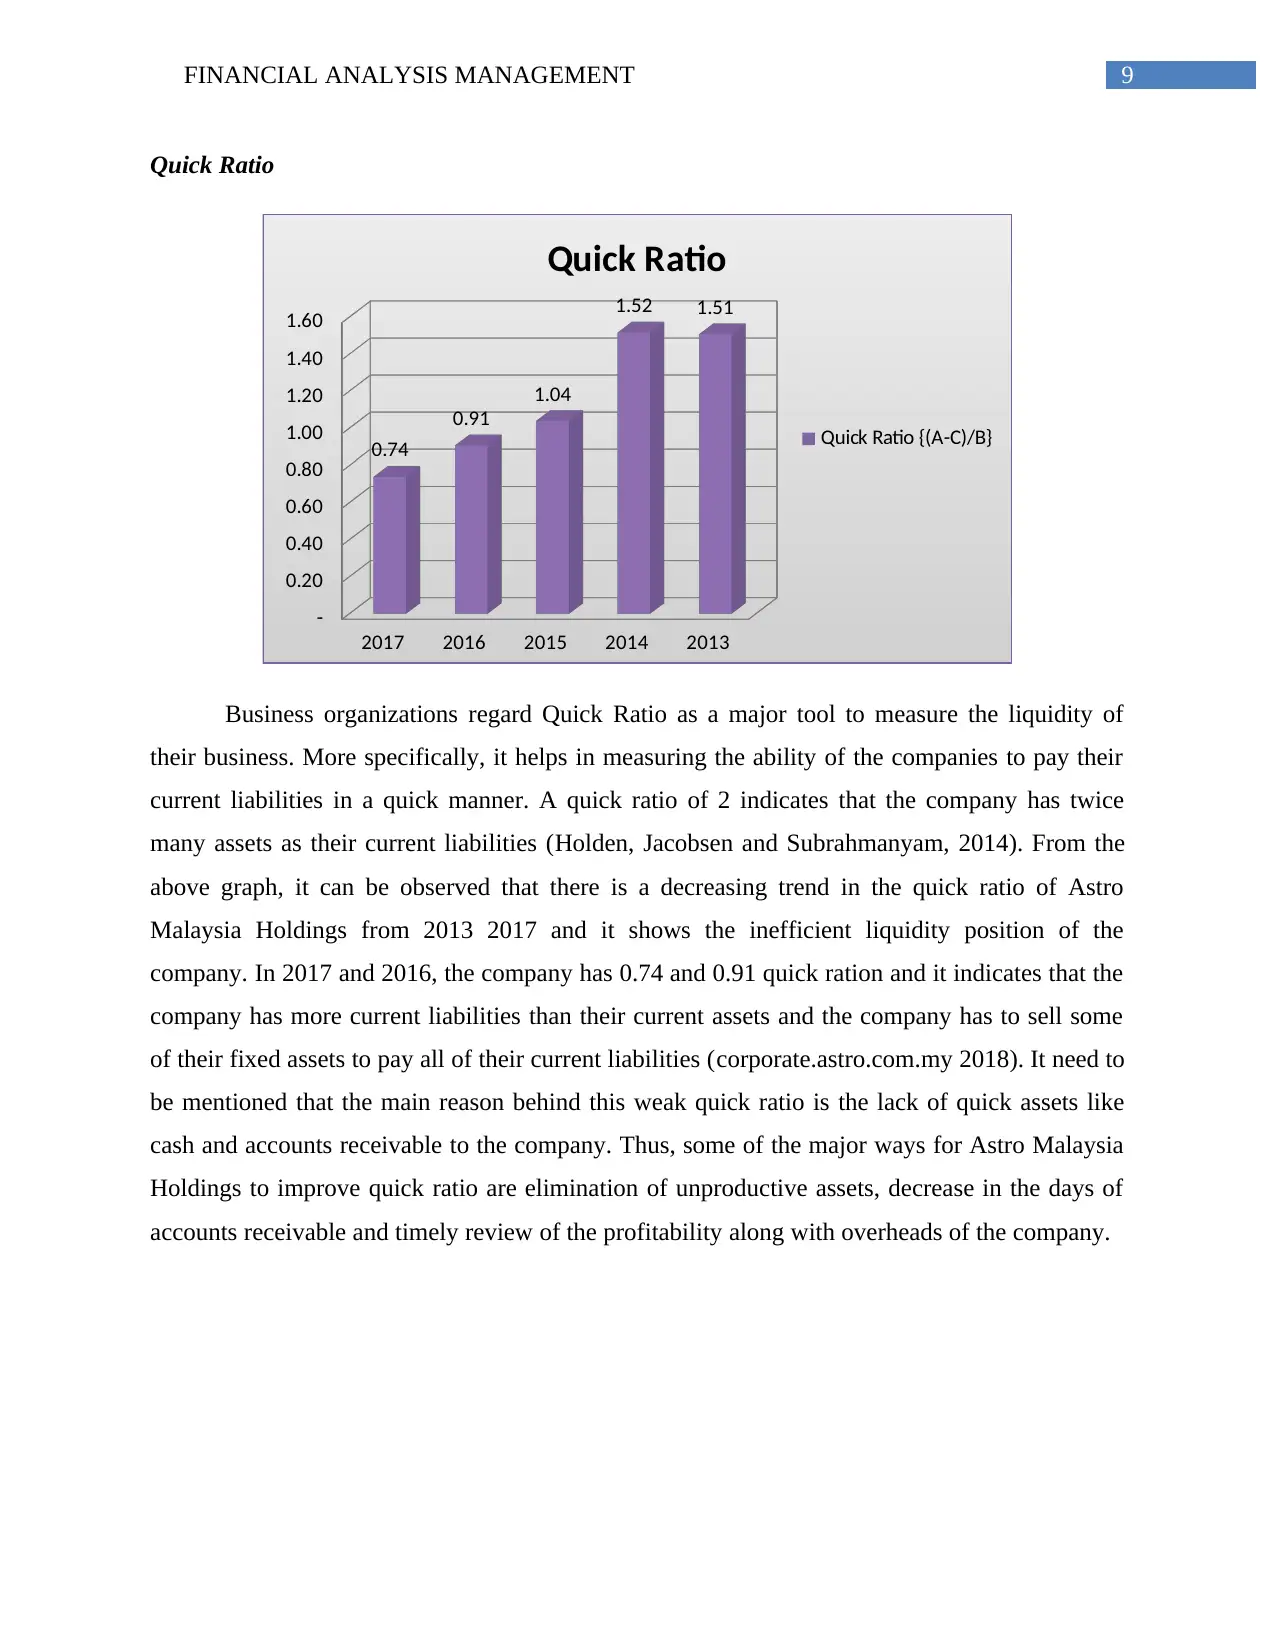
Business organizations regard Quick Ratio as a major tool to measure the liquidity of
their business. More specifically, it helps in measuring the ability of the companies to pay their
current liabilities in a quick manner. A quick ratio of 2 indicates that the company has twice
many assets as their current liabilities (Holden, Jacobsen and Subrahmanyam, 2014). From the
above graph, it can be observed that there is a decreasing trend in the quick ratio of Astro
Malaysia Holdings from 2013 2017 and it shows the inefficient liquidity position of the
company. In 2017 and 2016, the company has 0.74 and 0.91 quick ration and it indicates that the
company has more current liabilities than their current assets and the company has to sell some
of their fixed assets to pay all of their current liabilities (corporate.astro.com.my 2018). It need to
be mentioned that the main reason behind this weak quick ratio is the lack of quick assets like
cash and accounts receivable to the company. Thus, some of the major ways for Astro Malaysia
Holdings to improve quick ratio are elimination of unproductive assets, decrease in the days of
accounts receivable and timely review of the profitability along with overheads of the company.
Quick Ratio
2017 2016 2015 2014 2013
-
0.20
0.40
0.60
0.80
1.00
1.20
1.40
1.60
0.74
0.91
1.04
1.52 1.51
Quick Ratio
Quick Ratio {(A-C)/B}
Business organizations regard Quick Ratio as a major tool to measure the liquidity of
their business. More specifically, it helps in measuring the ability of the companies to pay their
current liabilities in a quick manner. A quick ratio of 2 indicates that the company has twice
many assets as their current liabilities (Holden, Jacobsen and Subrahmanyam, 2014). From the
above graph, it can be observed that there is a decreasing trend in the quick ratio of Astro
Malaysia Holdings from 2013 2017 and it shows the inefficient liquidity position of the
company. In 2017 and 2016, the company has 0.74 and 0.91 quick ration and it indicates that the
company has more current liabilities than their current assets and the company has to sell some
of their fixed assets to pay all of their current liabilities (corporate.astro.com.my 2018). It need to
be mentioned that the main reason behind this weak quick ratio is the lack of quick assets like
cash and accounts receivable to the company. Thus, some of the major ways for Astro Malaysia
Holdings to improve quick ratio are elimination of unproductive assets, decrease in the days of
accounts receivable and timely review of the profitability along with overheads of the company.
Paraphrase This Document
Need a fresh take? Get an instant paraphrase of this document with our AI Paraphraser
10FINANCIAL ANALYSIS MANAGEMENT
Efficiency Analysis
Working Capital Ratio
2017 2016 2015 2014 2013
0.00
0.20
0.40
0.60
0.80
1.00
1.20
1.40
1.60
0.75 0.92 1.04
1.53 1.52
Working Capital Ratio
Working Capital Ratio
(A/B)
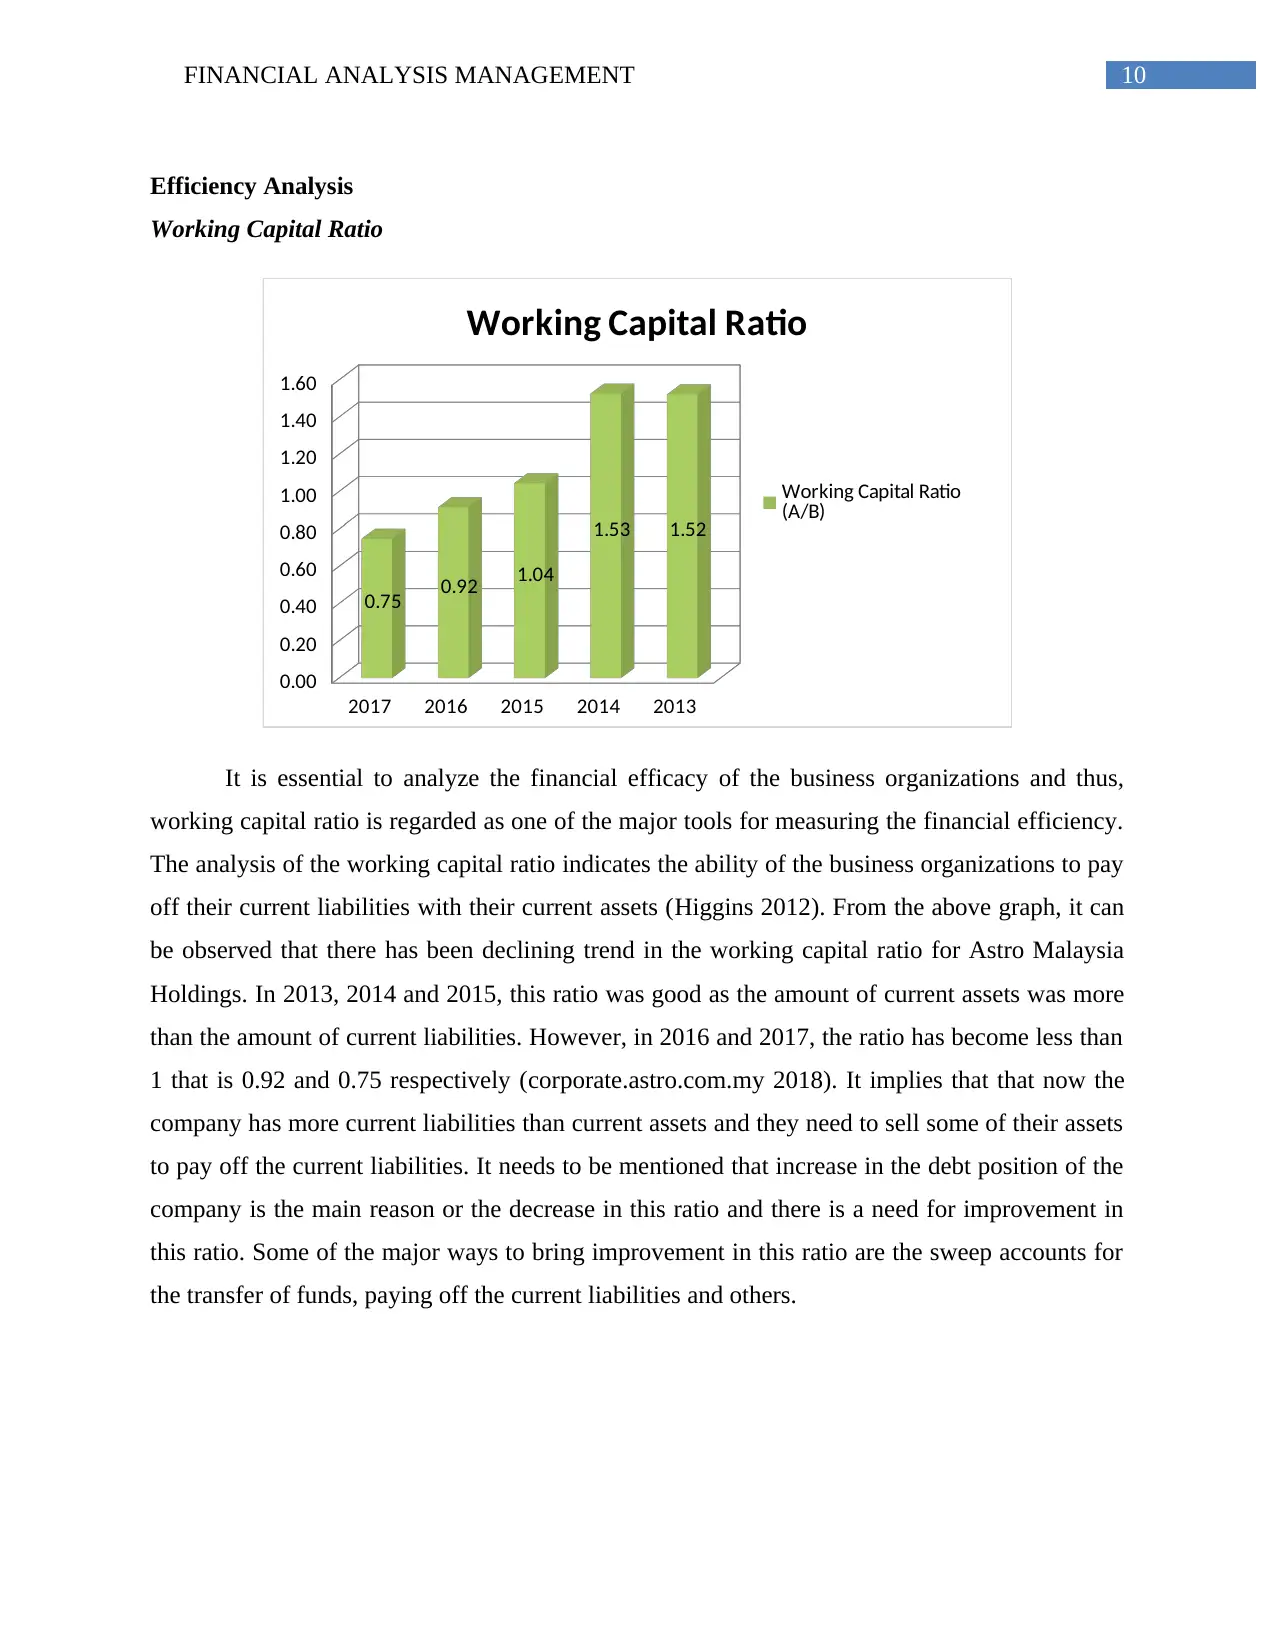
It is essential to analyze the financial efficacy of the business organizations and thus,
working capital ratio is regarded as one of the major tools for measuring the financial efficiency.
The analysis of the working capital ratio indicates the ability of the business organizations to pay
off their current liabilities with their current assets (Higgins 2012). From the above graph, it can
be observed that there has been declining trend in the working capital ratio for Astro Malaysia
Holdings. In 2013, 2014 and 2015, this ratio was good as the amount of current assets was more
than the amount of current liabilities. However, in 2016 and 2017, the ratio has become less than
1 that is 0.92 and 0.75 respectively (corporate.astro.com.my 2018). It implies that that now the
company has more current liabilities than current assets and they need to sell some of their assets
to pay off the current liabilities. It needs to be mentioned that increase in the debt position of the
company is the main reason or the decrease in this ratio and there is a need for improvement in
this ratio. Some of the major ways to bring improvement in this ratio are the sweep accounts for
the transfer of funds, paying off the current liabilities and others.
Efficiency Analysis
Working Capital Ratio
2017 2016 2015 2014 2013
0.00
0.20
0.40
0.60
0.80
1.00
1.20
1.40
1.60
0.75 0.92 1.04
1.53 1.52
Working Capital Ratio
Working Capital Ratio
(A/B)
It is essential to analyze the financial efficacy of the business organizations and thus,
working capital ratio is regarded as one of the major tools for measuring the financial efficiency.
The analysis of the working capital ratio indicates the ability of the business organizations to pay
off their current liabilities with their current assets (Higgins 2012). From the above graph, it can
be observed that there has been declining trend in the working capital ratio for Astro Malaysia
Holdings. In 2013, 2014 and 2015, this ratio was good as the amount of current assets was more
than the amount of current liabilities. However, in 2016 and 2017, the ratio has become less than
1 that is 0.92 and 0.75 respectively (corporate.astro.com.my 2018). It implies that that now the
company has more current liabilities than current assets and they need to sell some of their assets
to pay off the current liabilities. It needs to be mentioned that increase in the debt position of the
company is the main reason or the decrease in this ratio and there is a need for improvement in
this ratio. Some of the major ways to bring improvement in this ratio are the sweep accounts for
the transfer of funds, paying off the current liabilities and others.
11FINANCIAL ANALYSIS MANAGEMENT
Inventory Turnover ratio
2017 2016 2015 2014 2013
0.00
50.00
100.00
150.00
200.00
250.00
169.10
201.19
218.92
146.82
220.93
Inventory Turnover Ratio
Inventory Turnover Ratio
(C/E)
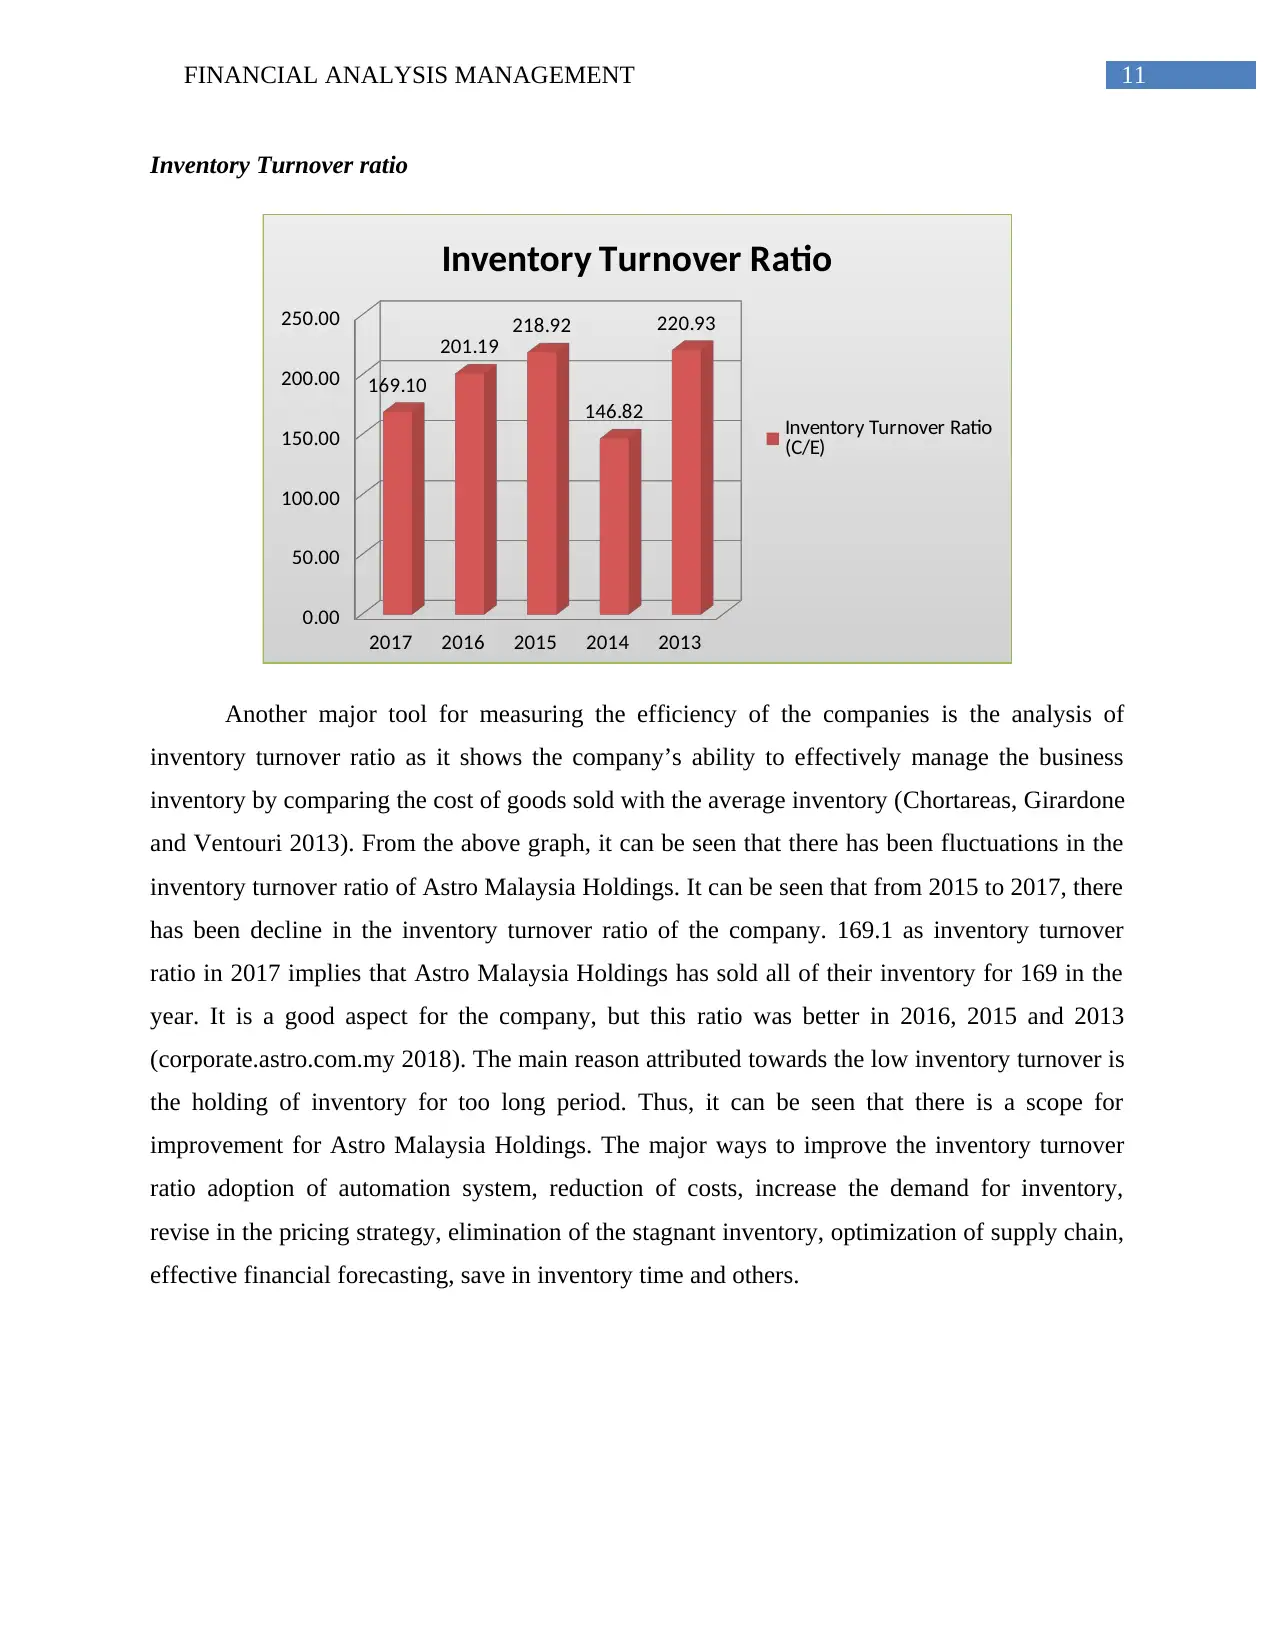
Another major tool for measuring the efficiency of the companies is the analysis of
inventory turnover ratio as it shows the company’s ability to effectively manage the business
inventory by comparing the cost of goods sold with the average inventory (Chortareas, Girardone
and Ventouri 2013). From the above graph, it can be seen that there has been fluctuations in the
inventory turnover ratio of Astro Malaysia Holdings. It can be seen that from 2015 to 2017, there
has been decline in the inventory turnover ratio of the company. 169.1 as inventory turnover
ratio in 2017 implies that Astro Malaysia Holdings has sold all of their inventory for 169 in the
year. It is a good aspect for the company, but this ratio was better in 2016, 2015 and 2013
(corporate.astro.com.my 2018). The main reason attributed towards the low inventory turnover is
the holding of inventory for too long period. Thus, it can be seen that there is a scope for
improvement for Astro Malaysia Holdings. The major ways to improve the inventory turnover
ratio adoption of automation system, reduction of costs, increase the demand for inventory,
revise in the pricing strategy, elimination of the stagnant inventory, optimization of supply chain,
effective financial forecasting, save in inventory time and others.
Inventory Turnover ratio
2017 2016 2015 2014 2013
0.00
50.00
100.00
150.00
200.00
250.00
169.10
201.19
218.92
146.82
220.93
Inventory Turnover Ratio
Inventory Turnover Ratio
(C/E)
Another major tool for measuring the efficiency of the companies is the analysis of
inventory turnover ratio as it shows the company’s ability to effectively manage the business
inventory by comparing the cost of goods sold with the average inventory (Chortareas, Girardone
and Ventouri 2013). From the above graph, it can be seen that there has been fluctuations in the
inventory turnover ratio of Astro Malaysia Holdings. It can be seen that from 2015 to 2017, there
has been decline in the inventory turnover ratio of the company. 169.1 as inventory turnover
ratio in 2017 implies that Astro Malaysia Holdings has sold all of their inventory for 169 in the
year. It is a good aspect for the company, but this ratio was better in 2016, 2015 and 2013
(corporate.astro.com.my 2018). The main reason attributed towards the low inventory turnover is
the holding of inventory for too long period. Thus, it can be seen that there is a scope for
improvement for Astro Malaysia Holdings. The major ways to improve the inventory turnover
ratio adoption of automation system, reduction of costs, increase the demand for inventory,
revise in the pricing strategy, elimination of the stagnant inventory, optimization of supply chain,
effective financial forecasting, save in inventory time and others.
⊘ This is a preview!⊘
Do you want full access?
Subscribe today to unlock all pages.
Trusted by 1+ million students worldwide
1 out of 23
Related Documents


Your All-in-One AI-Powered Toolkit for Academic Success.
+13062052269
info@desklib.com
Available 24*7 on WhatsApp / Email
![[object Object]](/_next/static/media/star-bottom.7253800d.svg)
Unlock your academic potential
Copyright © 2020–2026 A2Z Services. All Rights Reserved. Developed and managed by ZUCOL.