Financial Analysis of Aus Net Service Company Report - 2015-2017

Verified

Added on  2020/04/07

|5
|424
|85
Report
AI Summary
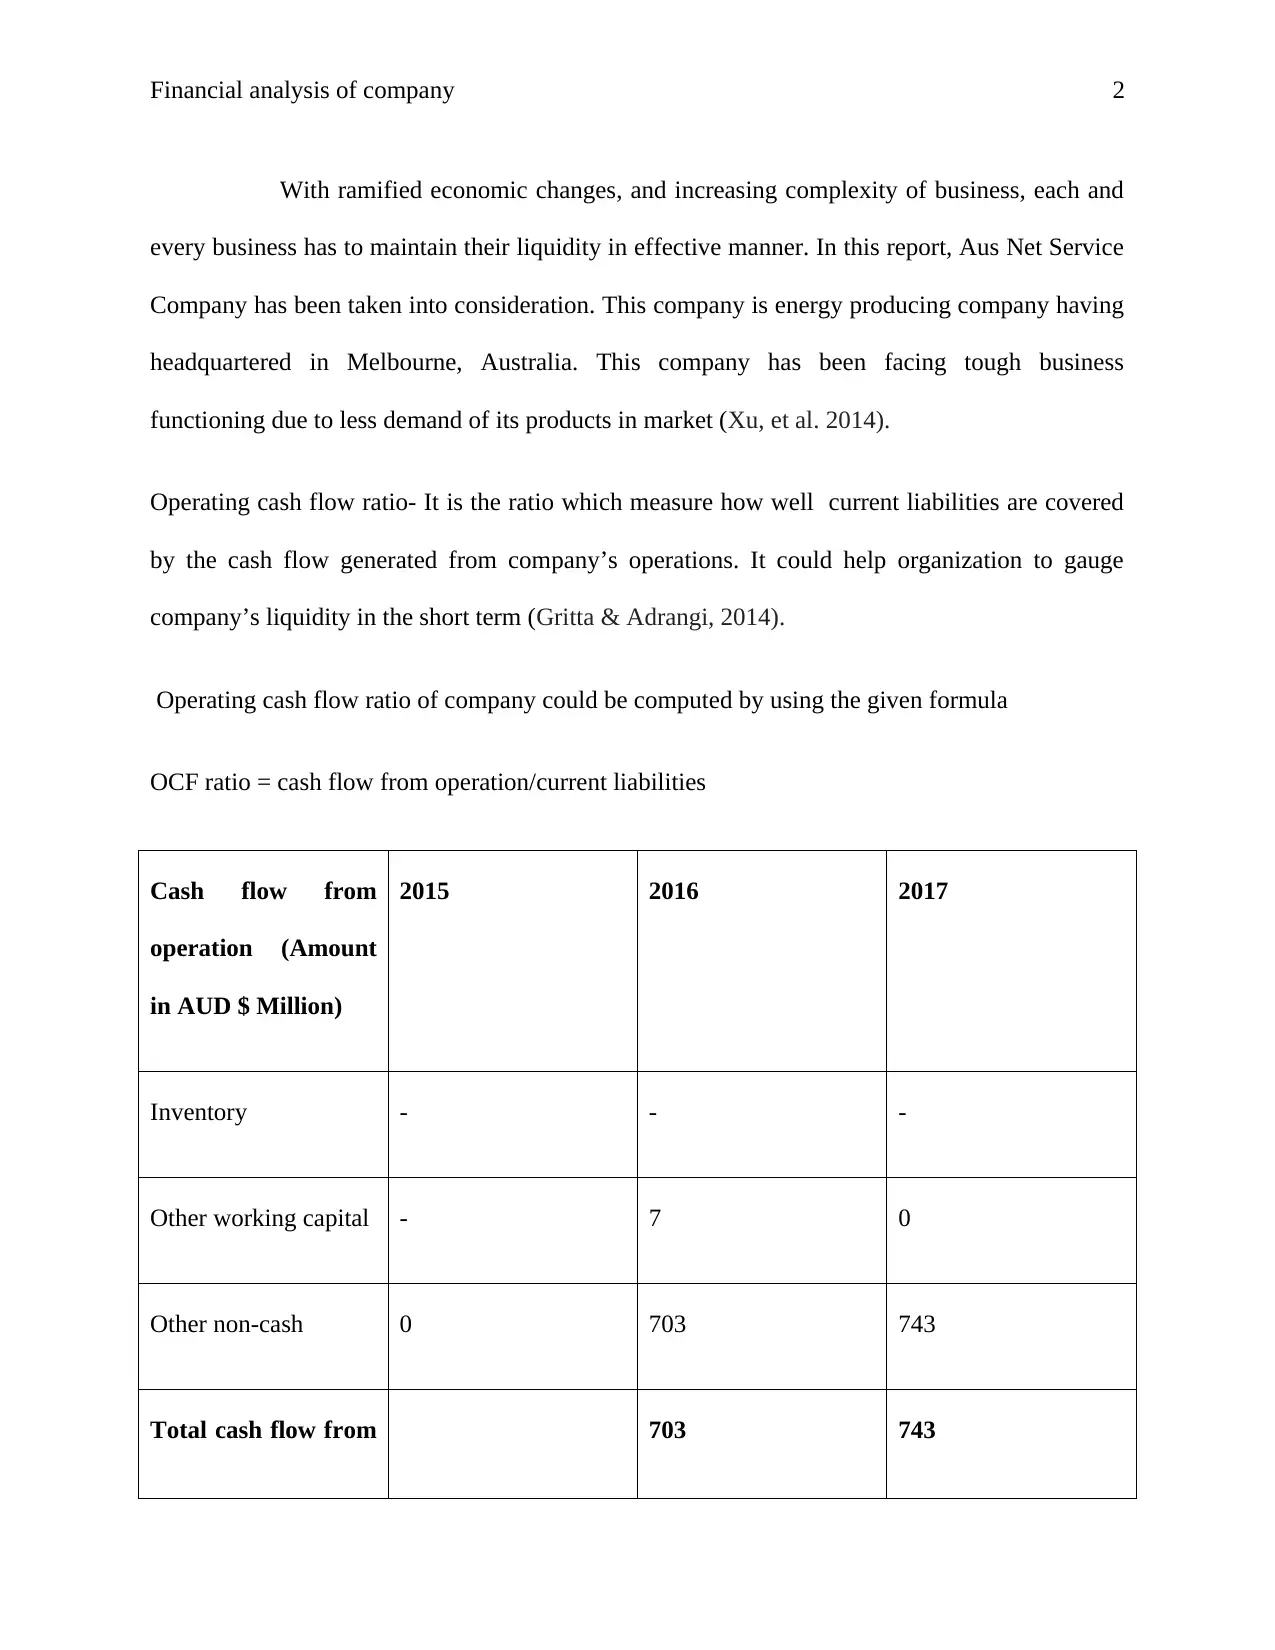
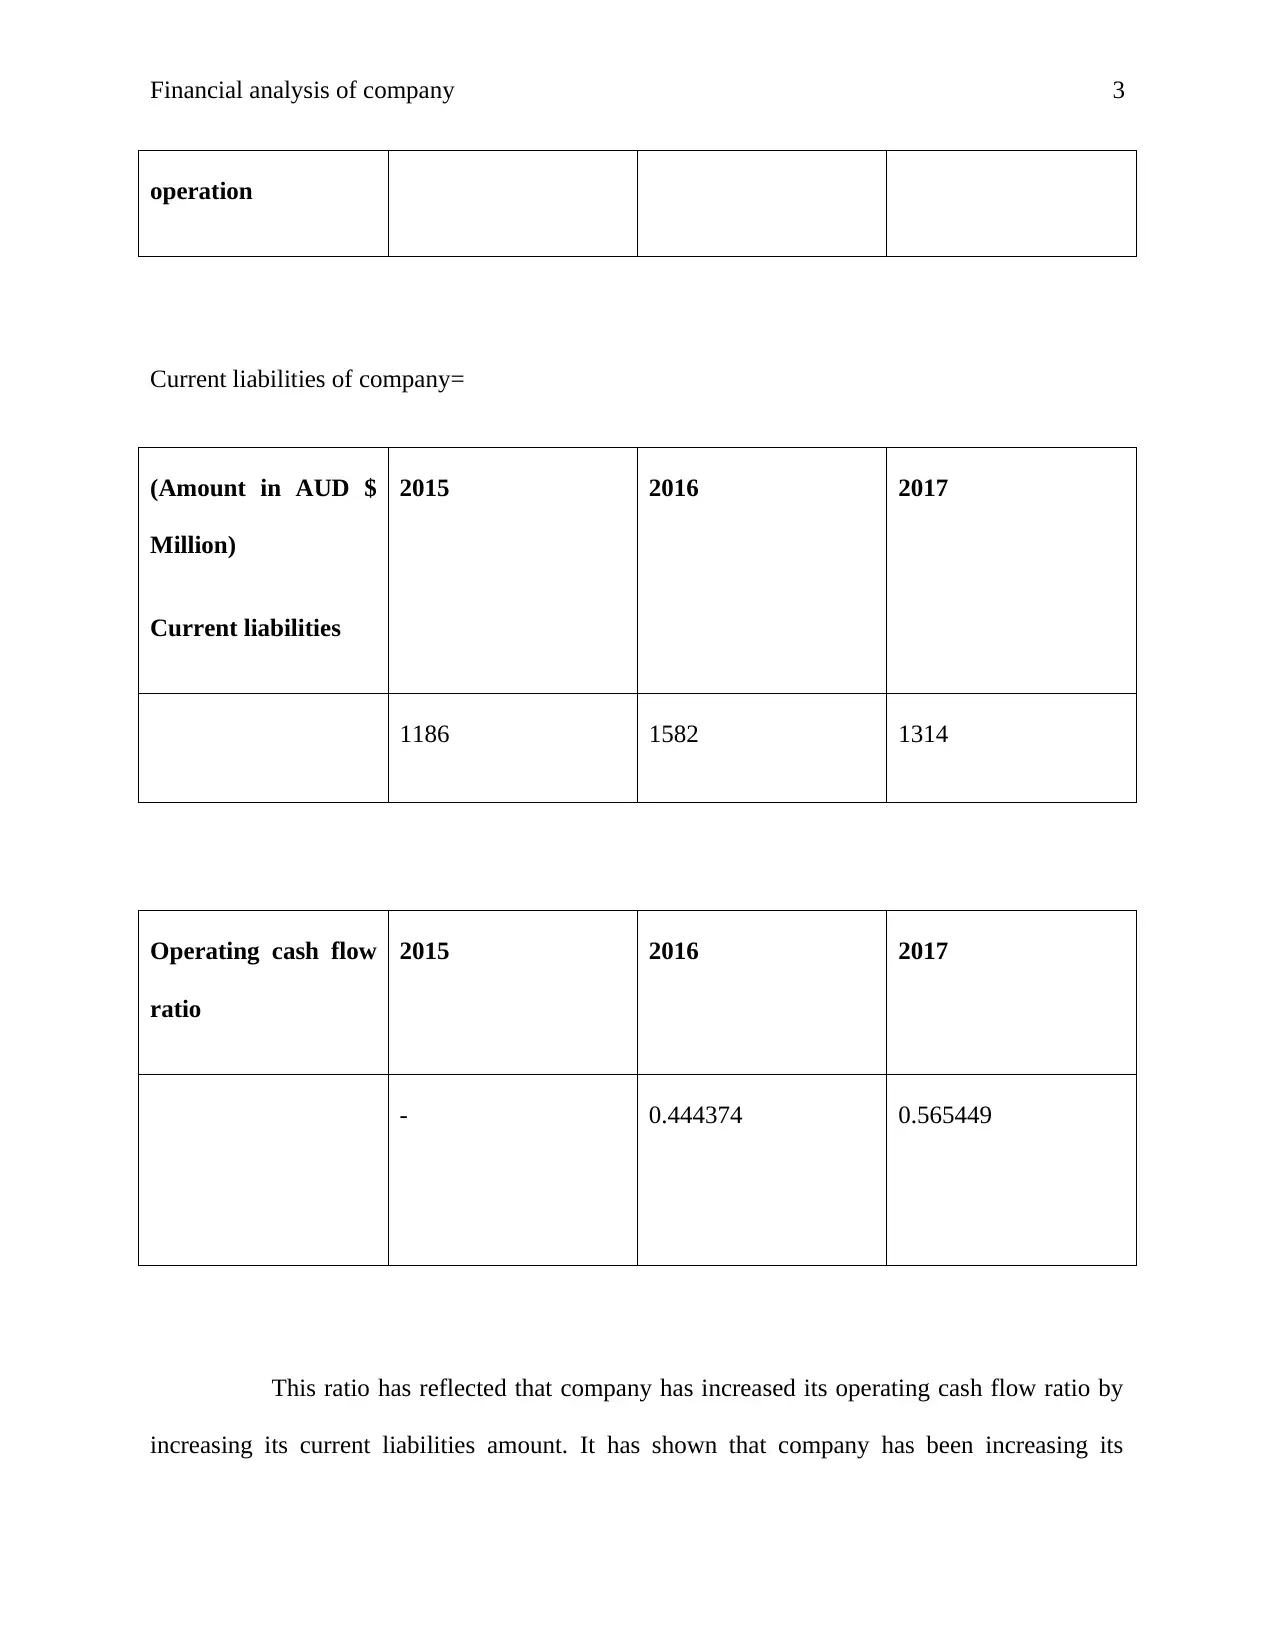
This report provides a financial analysis of Aus Net Service, focusing on its operating cash flow ratio and current liabilities from 2015 to 2017. The analysis includes the calculation of the operating cash flow ratio and an interpretation of the company's performance based on the provided data, which includes cash flow from operations and current liabilities for the years 2015, 2016, and 2017. The report also references academic sources to support its findings. The analysis reflects how the company's operating cash flow ratio has changed due to fluctuations in current liabilities and business operations. The report aims to provide insights into the company's financial health and liquidity position during the specified period, and to assess the impact of increased business operations on its financial performance. The report also presents the financial data in a structured format to facilitate understanding.
tabler-icon-diamond-filled.svg

Contribute Materials

Your contribution can guide someone’s learning journey. Share your documents today.
Document Page
RUNNING HEAD: Financial analysis of company
1
Financial analysis of company
tabler-icon-diamond-filled.svg

Secure Best Marks with AI Grader

Need help grading? Try our AI Grader for instant feedback on your assignments.
Document Page
Financial analysis of company 2
With ramified economic changes, and increasing complexity of business, each and
every business has to maintain their liquidity in effective manner. In this report, Aus Net Service
Company has been taken into consideration. This company is energy producing company having
headquartered in Melbourne, Australia. This company has been facing tough business
functioning due to less demand of its products in market (Xu, et al. 2014).
Operating cash flow ratio- It is the ratio which measure how well current liabilities are covered
by the cash flow generated from company’s operations. It could help organization to gauge
company’s liquidity in the short term (Gritta & Adrangi, 2014).
Operating cash flow ratio of company could be computed by using the given formula
OCF ratio = cash flow from operation/current liabilities
Cash flow from
operation (Amount
in AUD $ Million)
2015 2016 2017
Inventory - - -
Other working capital - 7 0
Other non-cash 0 703 743
Total cash flow from 703 743
Document Page
Financial analysis of company 3
operation
Current liabilities of company=
(Amount in AUD $
Million)
Current liabilities
2015 2016 2017
1186 1582 1314
Operating cash flow
ratio
2015 2016 2017
- 0.444374 0.565449
This ratio has reflected that company has increased its operating cash flow ratio by
increasing its current liabilities amount. It has shown that company has been increasing its
Document Page
Financial analysis of company 4
business operation which has also increased its investment in the business operation of company.
company has increased its cash flow from the business operation (Ak, et al. 2013).
tabler-icon-diamond-filled.svg

Secure Best Marks with AI Grader

Need help grading? Try our AI Grader for instant feedback on your assignments.
Document Page
Financial analysis of company 5
References
Ak, B. K., Dechow, P. M., Sun, Y., & Wang, A. Y. (2013). The use of financial ratio models to
help investors predict and interpret significant corporate events. Australian journal of
management, 38(3), 553-598.
Gritta, R. D., & Adrangi, B. (2014). The Use of Bankruptcy Forecasting Models in Teaching
Applied Ratio Analysis in Investment and Financial Statement Analysis Courses.
Xu, W., Xiao, Z., Dang, X., Yang, D., & Yang, X. (2014). Financial ratio selection for business
failure prediction using soft set theory. Knowledge-Based Systems, 63, 59-67.
Appendix
chevron_up_icon
1 out of 5
circle_padding
hide_on_mobile
zoom_out_icon
logo.png

Your All-in-One AI-Powered Toolkit for Academic Success.

Available 24*7 on WhatsApp / Email

[object Object]