Financial Analysis and Investment Appraisal in Aviation Sector

Verified

Added on  2022/12/20

|22
|3279
|1
Report
AI Summary
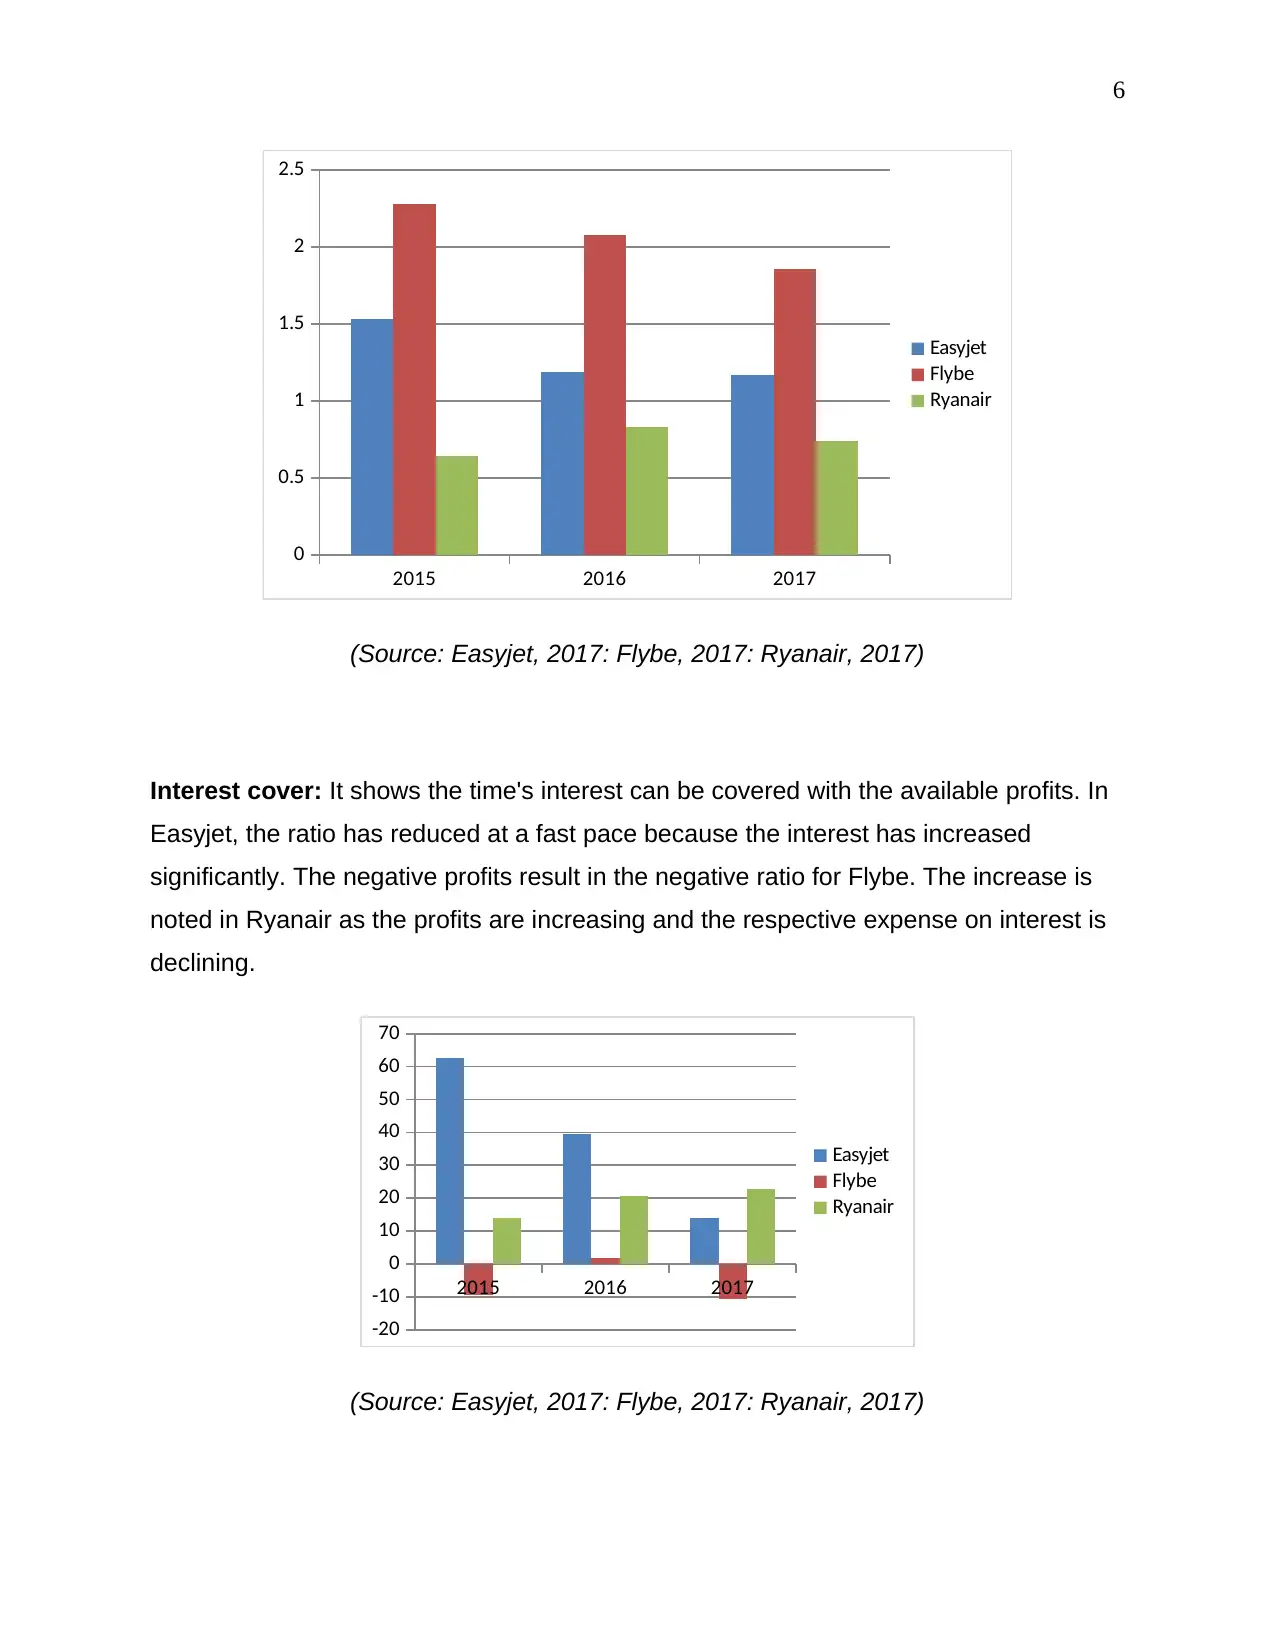
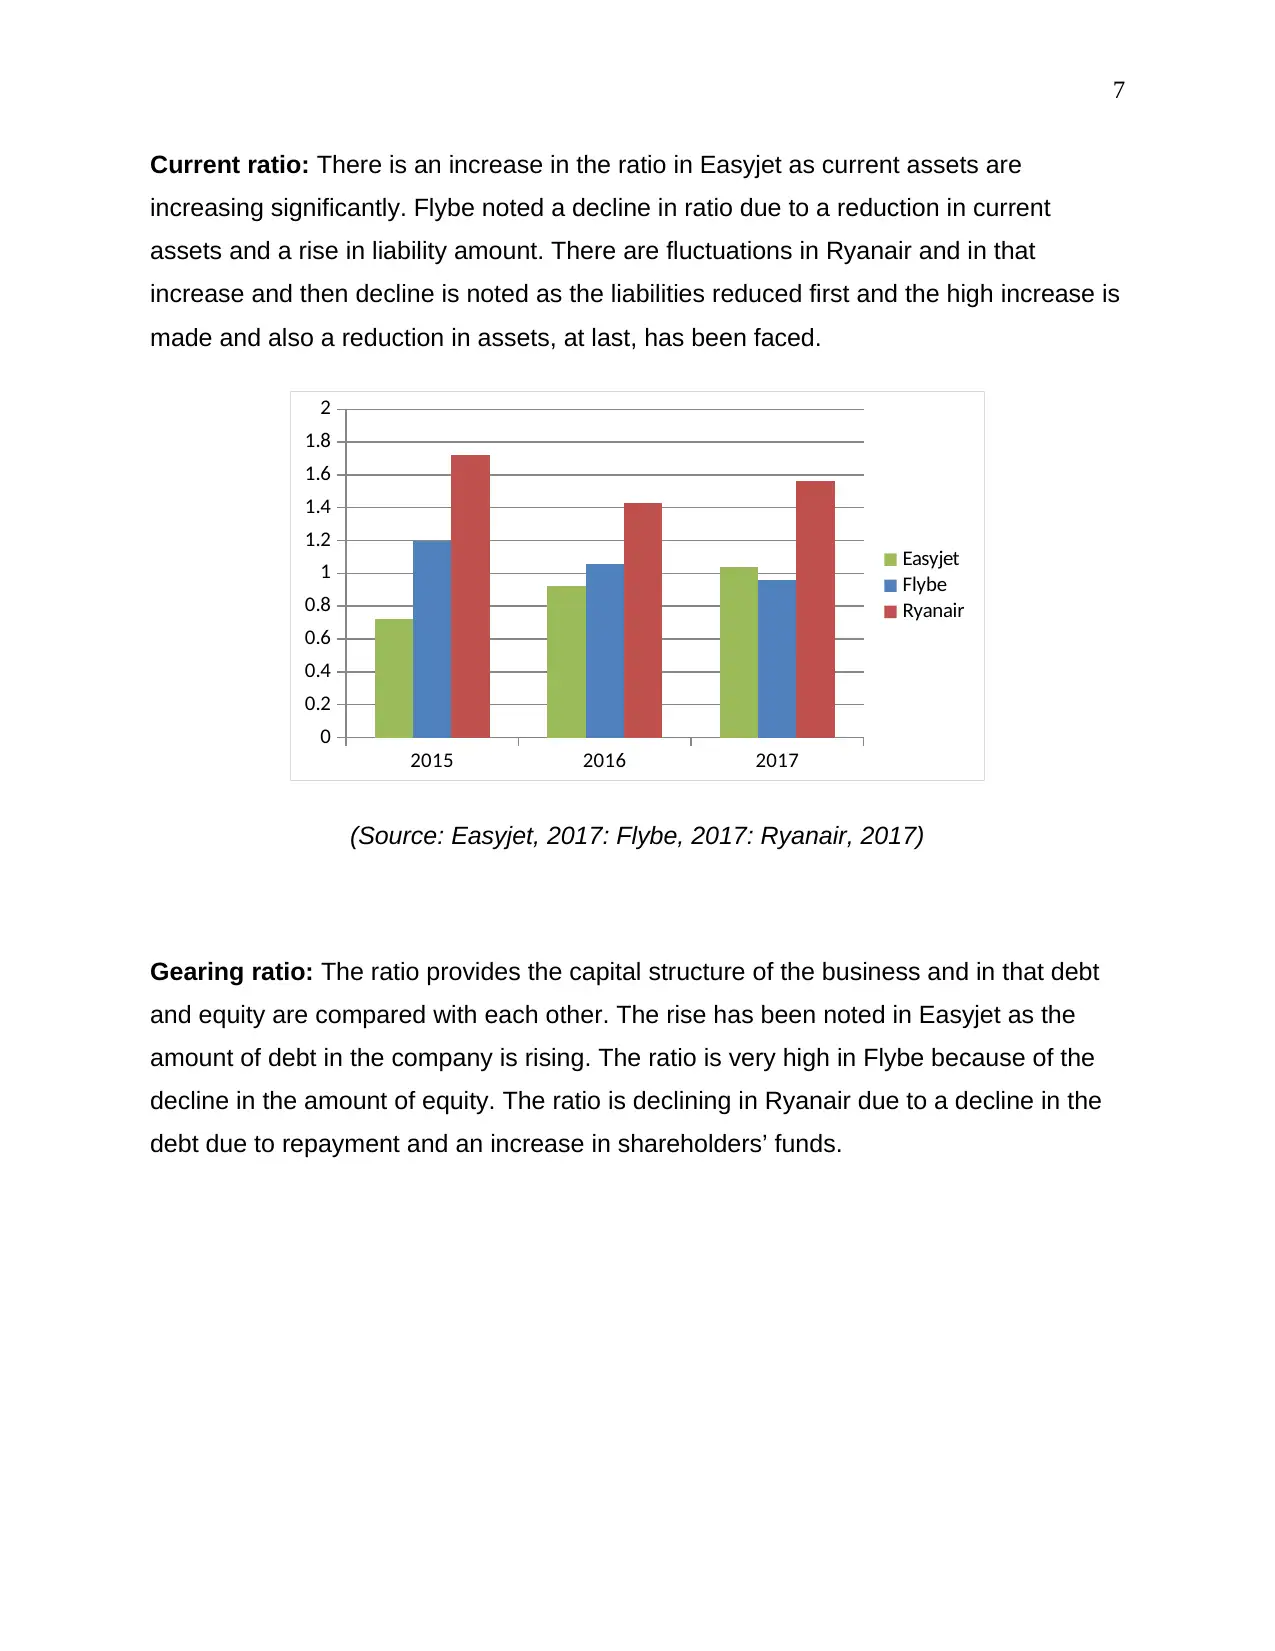
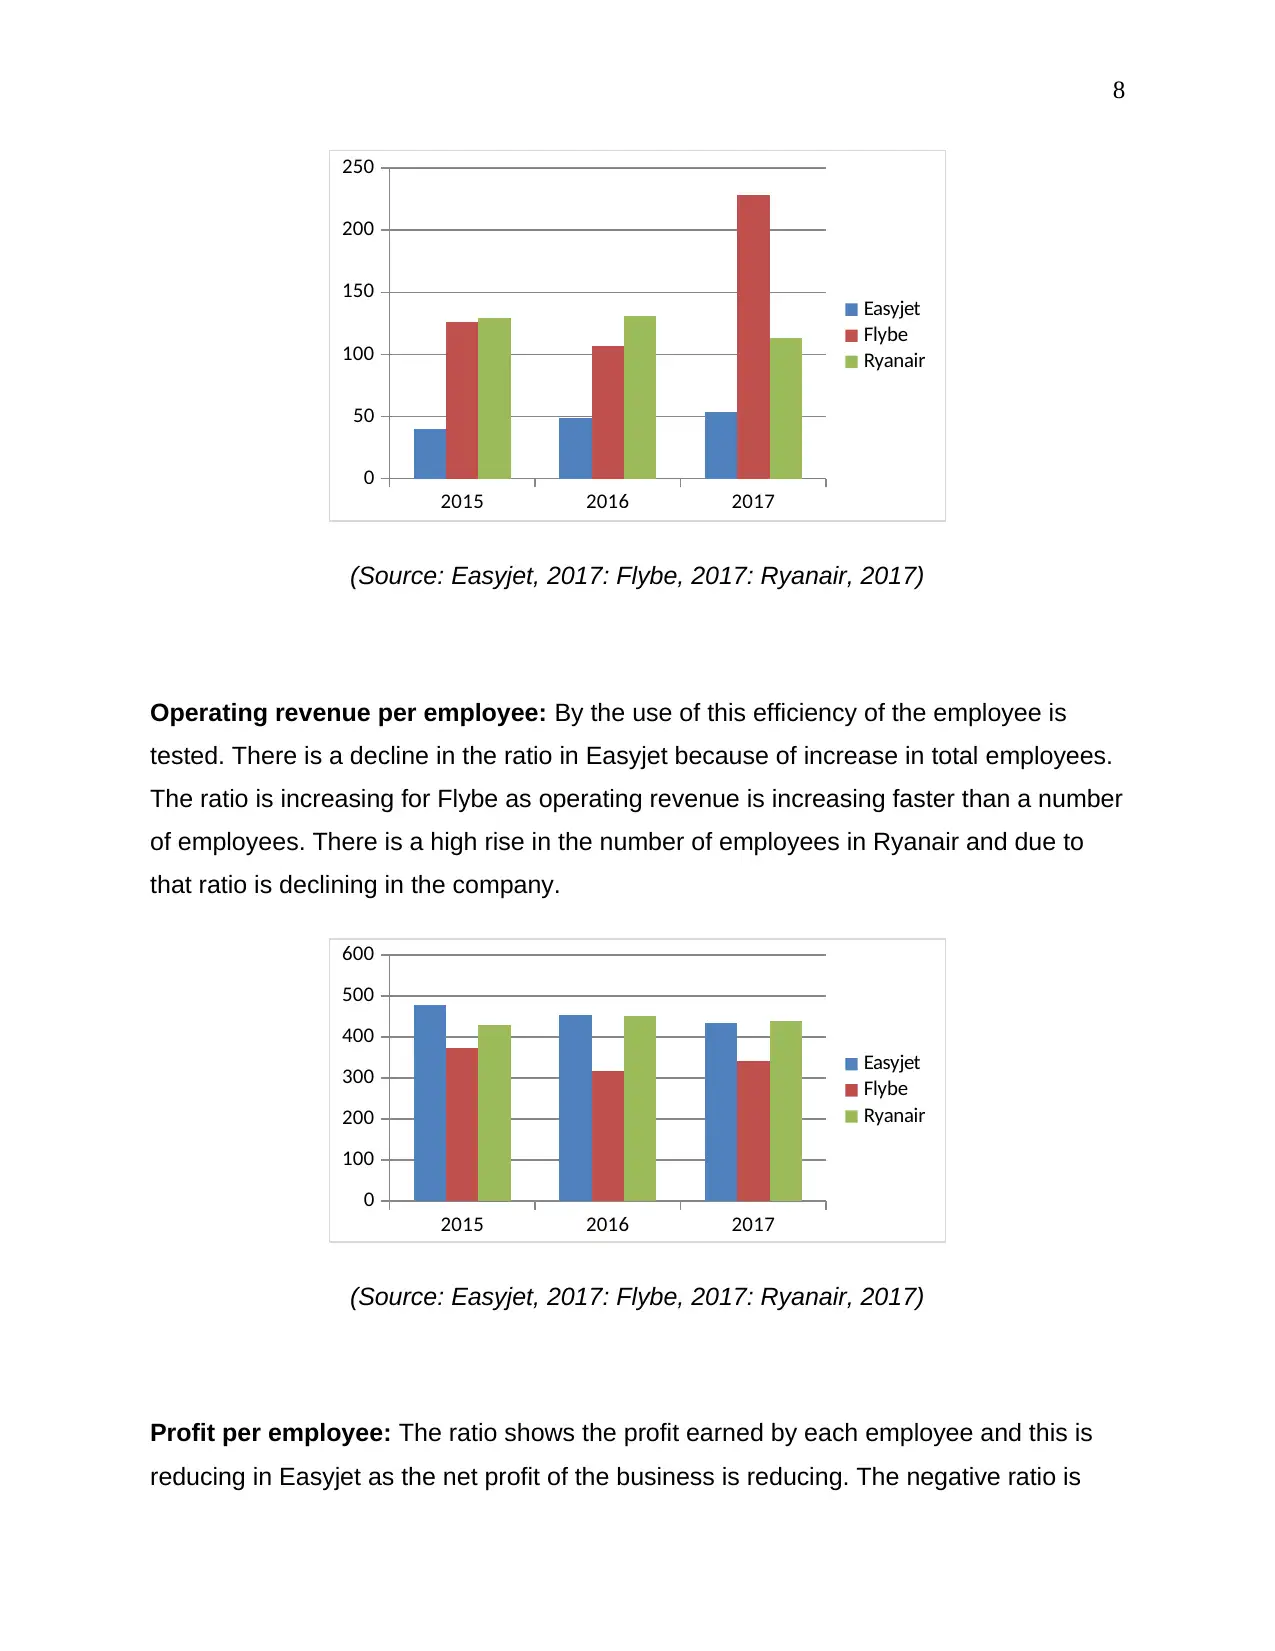
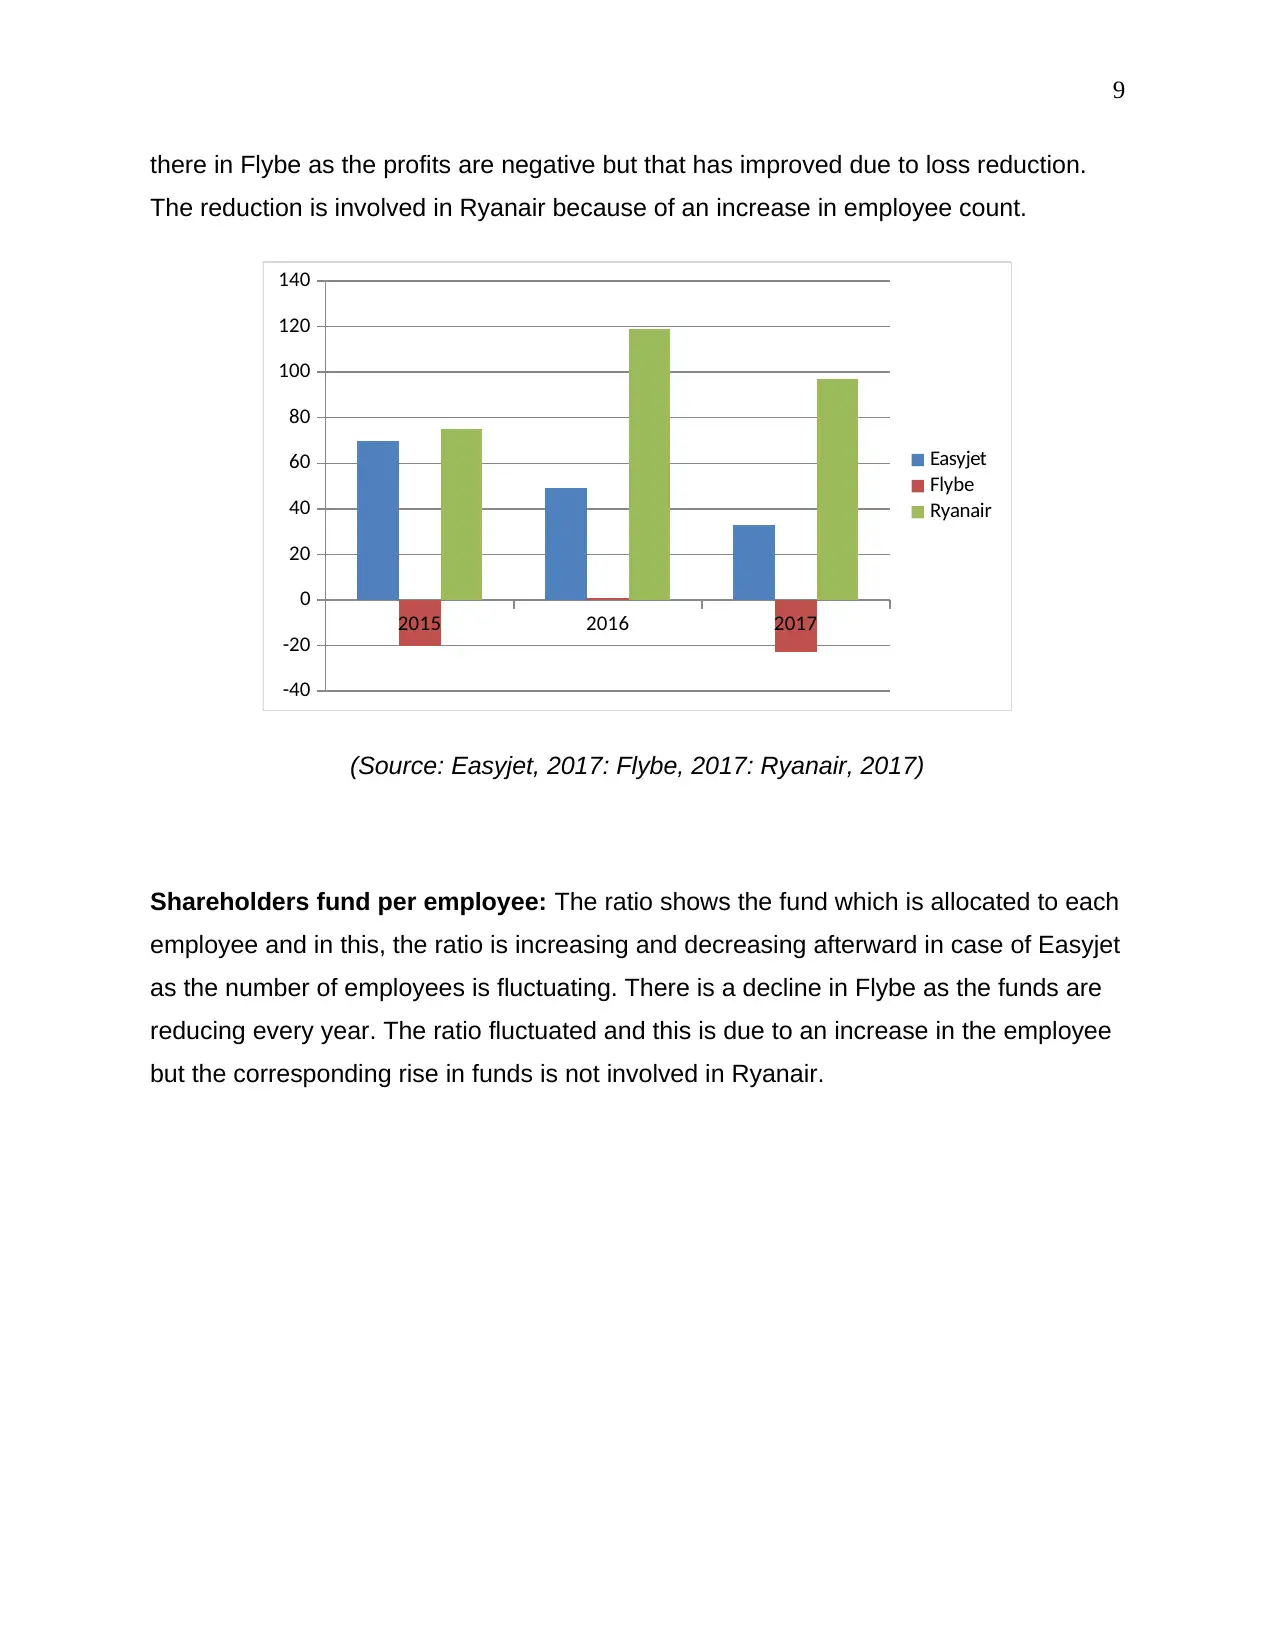
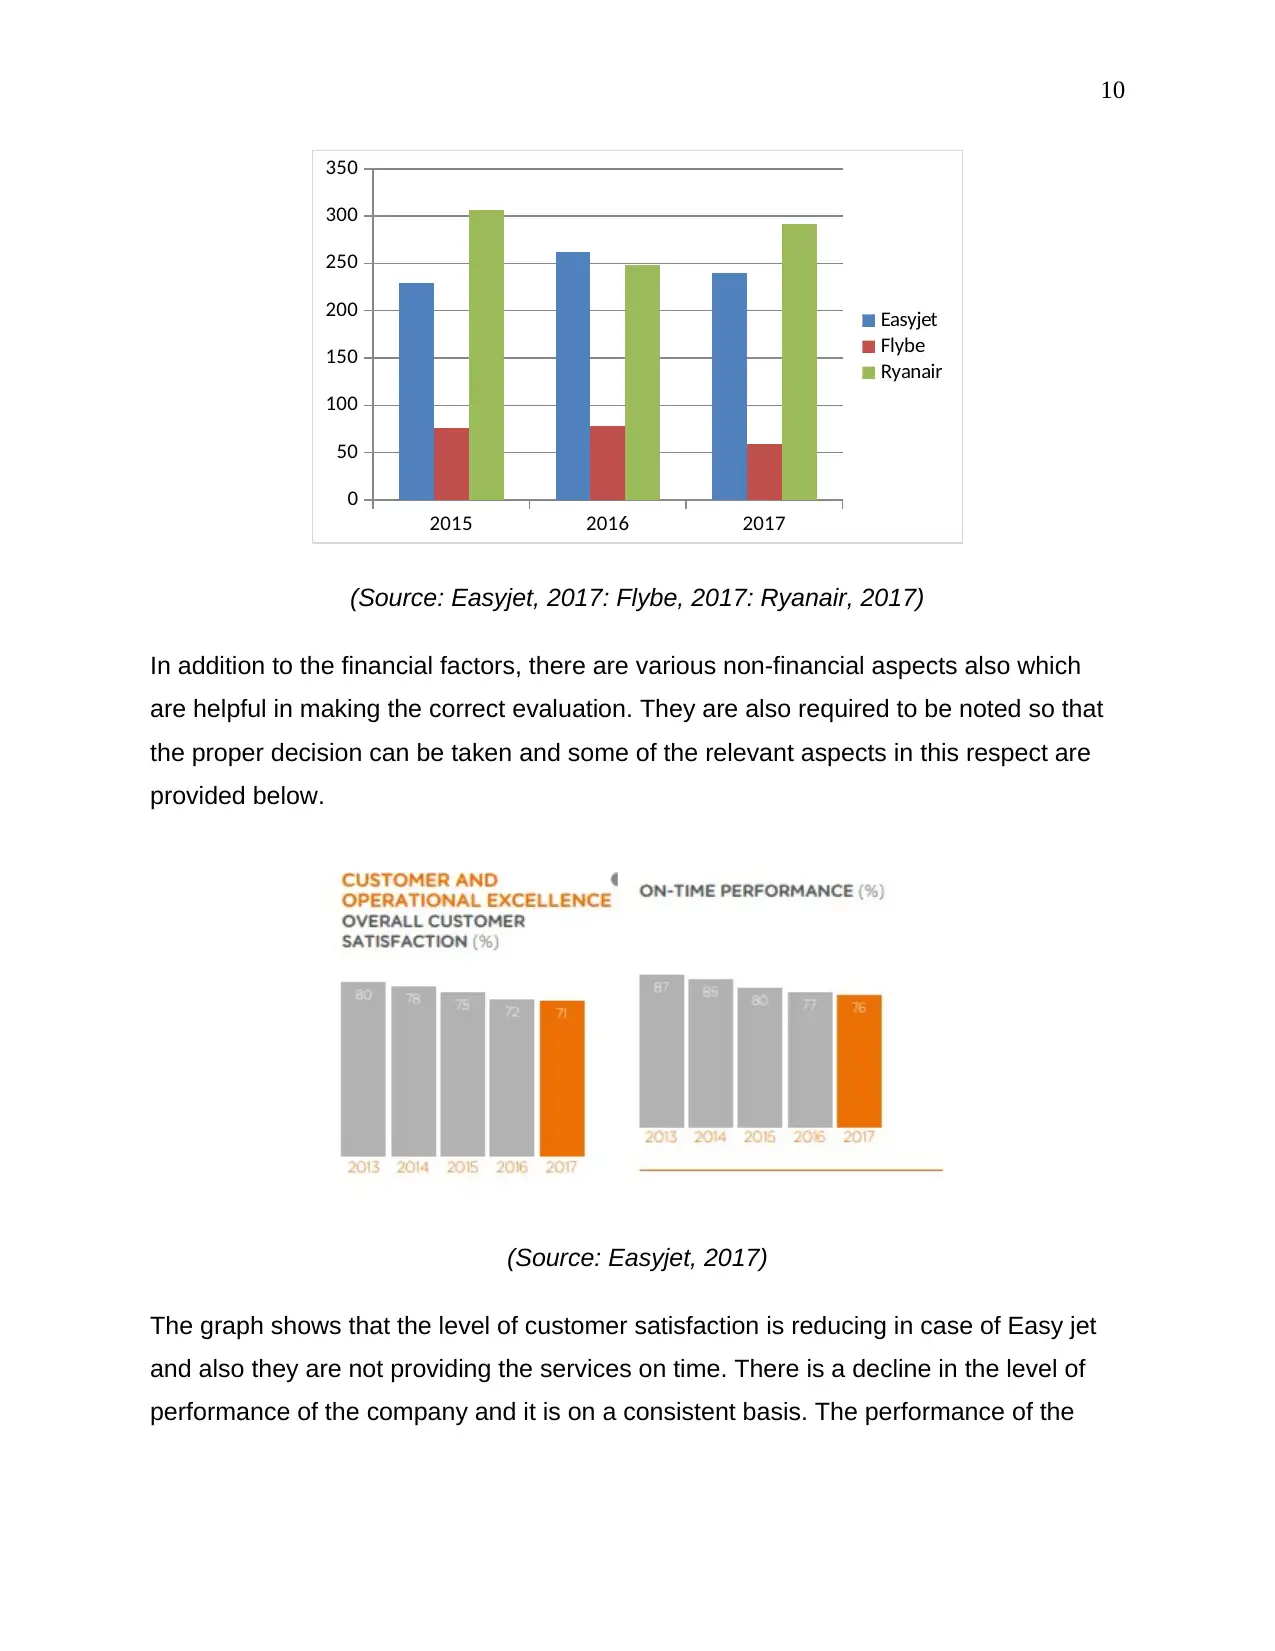
This report provides a detailed financial analysis of three aviation companies: Easyjet, Flybe, and Ryanair. The analysis includes the selection and calculation of various financial ratios, such as profit margin, return on equity, cash flow to operating revenue, net asset turnover, interest cover, current ratio, gearing ratio, operating revenue per employee, profit per employee, and shareholders fund per employee. The report also considers non-financial aspects like customer satisfaction and on-time performance. Furthermore, the assignment explores investment appraisal techniques, outlining the steps involved in capital investment decisions, including project identification, screening, analysis, implementation, and monitoring. The findings highlight the financial performance of each company, with a comparative analysis to identify the best-performing company and provide recommendations for improvement, particularly for the underperforming company.
Document Page
1
Accounting
tabler-icon-diamond-filled.svg

Paraphrase This Document

Need a fresh take? Get an instant paraphrase of this document with our AI Paraphraser
Document Page
2
Table of Contents
Introduction....................................................................................................................................3
Question 1......................................................................................................................................3
a)..................................................................................................................................................3
b)................................................................................................................................................12
c)................................................................................................................................................13
Question 2....................................................................................................................................14
a)................................................................................................................................................14
b)................................................................................................................................................15
Conclusion....................................................................................................................................18
References...................................................................................................................................19
Document Page
3
Introduction
The report will be covering the analysis about the ratios which will be describing the
financial position of three aviation companies. There will be consideration of various
ratios and in that non-financial aspects will also be covered. Aviation industry faced
various challenges such as change in the number of passengers and it depends on
various environmental factors. The companies which will be used include Easyjet, Flybe
and Ryanair. There will also be inclusion of the investment appraisal techniques and
they will be explained with the help of examples.
Question 1
a)
The aviation sector is growing and in that it is needed that proper evaluation shall be
made of the information which is provided in the financial statements. It is conducted in
respect of three aviation companies which are Easy Jet, Flybe, and Ryanair.
Profit margin ratio: There is decline in profits of easyjet due to the increase in
operating cost which leads to decline in profits earned. Flybe is having negative profits
and this is because the expenses which are incurred are more than revenue. Ryanair
faced fluctuations due to change in the financial expenses which are borne by company.
Document Page
4
2015 2016 2017
-10
-5
0
5
10
15
20
25
30
Easyjet
Flybe
Ryanair
(Source: Easyjet, 2017: Flybe, 2017: Ryanair, 2017)
Return on equity: The ratio shows the return which is made on the equity. The decline
is faced by Easyjet and that is because of the decline in profits. There is a negative
result for the in Flybe and that is due to the negative earnings of the company. For
Ryanair, there is the rise and then the decline in the ratio due to the fluctuations of the
income.
2015 2016 2017
-50
-40
-30
-20
-10
0
10
20
30
40
50
Easyjet
Flybe
Ryanair
(Source: Easyjet, 2017: Flybe, 2017: Ryanair, 2017)
tabler-icon-diamond-filled.svg

Paraphrase This Document

Need a fresh take? Get an instant paraphrase of this document with our AI Paraphraser
Document Page
5
Cash flow to operating revenue: The ratio is declining for Easyjet and this is due to an
increase in the operating revenue as the cash balance has increased in all the years. In
Flybe, there is increase in financial expense and by that cash balance has reduced
thereby reducing the ratio. Ryanair showed an increase and then decrease in this ratio
because of the change in the interest which is paid by it.
2015 2016 2017
-5
0
5
10
15
20
25
30
35
Easyjet
Flybe
Ryanair
(Source: Easyjet, 2017: Flybe, 2017: Ryanair, 2017)
Net asset turnover: The Turnover which is made with the help of net assets is shown
in this. The decline in the same is noted in Easyjet as the assets are not being utilized in
effective manner. The ratio is rising due to effective utilization of assets. Ryanair has
efficient employees who are able to use assets appropriately leading to rise in ratio.
Document Page
6
2015 2016 2017
0
0.5
1
1.5
2
2.5
Easyjet
Flybe
Ryanair
(Source: Easyjet, 2017: Flybe, 2017: Ryanair, 2017)
Interest cover: It shows the time's interest can be covered with the available profits. In
Easyjet, the ratio has reduced at a fast pace because the interest has increased
significantly. The negative profits result in the negative ratio for Flybe. The increase is
noted in Ryanair as the profits are increasing and the respective expense on interest is
declining.
2015 2016 2017
-20
-10
0
10
20
30
40
50
60
70
Easyjet
Flybe
Ryanair
(Source: Easyjet, 2017: Flybe, 2017: Ryanair, 2017)
Document Page
7
Current ratio: There is an increase in the ratio in Easyjet as current assets are
increasing significantly. Flybe noted a decline in ratio due to a reduction in current
assets and a rise in liability amount. There are fluctuations in Ryanair and in that
increase and then decline is noted as the liabilities reduced first and the high increase is
made and also a reduction in assets, at last, has been faced.
2015 2016 2017
0
0.2
0.4
0.6
0.8
1
1.2
1.4
1.6
1.8
2
Easyjet
Flybe
Ryanair
(Source: Easyjet, 2017: Flybe, 2017: Ryanair, 2017)
Gearing ratio: The ratio provides the capital structure of the business and in that debt
and equity are compared with each other. The rise has been noted in Easyjet as the
amount of debt in the company is rising. The ratio is very high in Flybe because of the
decline in the amount of equity. The ratio is declining in Ryanair due to a decline in the
debt due to repayment and an increase in shareholders’ funds.
tabler-icon-diamond-filled.svg

Paraphrase This Document

Need a fresh take? Get an instant paraphrase of this document with our AI Paraphraser
Document Page
8
2015 2016 2017
0
50
100
150
200
250
Easyjet
Flybe
Ryanair
(Source: Easyjet, 2017: Flybe, 2017: Ryanair, 2017)
Operating revenue per employee: By the use of this efficiency of the employee is
tested. There is a decline in the ratio in Easyjet because of increase in total employees.
The ratio is increasing for Flybe as operating revenue is increasing faster than a number
of employees. There is a high rise in the number of employees in Ryanair and due to
that ratio is declining in the company.
2015 2016 2017
0
100
200
300
400
500
600
Easyjet
Flybe
Ryanair
(Source: Easyjet, 2017: Flybe, 2017: Ryanair, 2017)
Profit per employee: The ratio shows the profit earned by each employee and this is
reducing in Easyjet as the net profit of the business is reducing. The negative ratio is
Document Page
9
there in Flybe as the profits are negative but that has improved due to loss reduction.
The reduction is involved in Ryanair because of an increase in employee count.
2015 2016 2017
-40
-20
0
20
40
60
80
100
120
140
Easyjet
Flybe
Ryanair
(Source: Easyjet, 2017: Flybe, 2017: Ryanair, 2017)
Shareholders fund per employee: The ratio shows the fund which is allocated to each
employee and in this, the ratio is increasing and decreasing afterward in case of Easyjet
as the number of employees is fluctuating. There is a decline in Flybe as the funds are
reducing every year. The ratio fluctuated and this is due to an increase in the employee
but the corresponding rise in funds is not involved in Ryanair.
Document Page
10
2015 2016 2017
0
50
100
150
200
250
300
350
Easyjet
Flybe
Ryanair
(Source: Easyjet, 2017: Flybe, 2017: Ryanair, 2017)
In addition to the financial factors, there are various non-financial aspects also which
are helpful in making the correct evaluation. They are also required to be noted so that
the proper decision can be taken and some of the relevant aspects in this respect are
provided below.
(Source: Easyjet, 2017)
The graph shows that the level of customer satisfaction is reducing in case of Easy jet
and also they are not providing the services on time. There is a decline in the level of
performance of the company and it is on a consistent basis. The performance of the
tabler-icon-diamond-filled.svg

Paraphrase This Document

Need a fresh take? Get an instant paraphrase of this document with our AI Paraphraser
Document Page
11
company is not considered to be appropriate as the decline in all the aspects is on a
continuous basis.
(Source: Flybe, 2017)
The On-time performance ratio has reduced for Flybe which shows that it is not able to
provide the customers with the proper performance. The overall performance of the
company is negative.
Document Page
12
(Source: Ryanair, 2017)
The fleet is increasing in Ryanair and there is a rise in other factors also such as
customer satisfaction and frequent point to point flights.
Particulars Easyje
t
Flybe Ryanai
r
Profit Margin 2 3 1
Return on equity 2 3 1
Cash flow to operating
revenue
2 3 1
Net asset turnover 2 1 3
Interest cover 2 3 1
Current ratio 2 3 1
Gearing ratio 1 3 2
Operating revenue per
employee
2 3 1
Profit per employee 2 3 1
Shareholders fund per 2 3 1
chevron_up_icon
1 out of 22
circle_padding
hide_on_mobile
zoom_out_icon
[object Object]