Australian Real Estate Industry Analysis: Avjennings and Aveo Group
VerifiedAdded on 2019/11/19
|23
|4924
|371
Report
AI Summary
This report presents a comprehensive financial analysis of the Australian real estate industry, focusing on two key market leaders: Avjennings Limited and Aveo Group. Employing both top-down and bottom-up approaches, the analysis begins with an overview of the economic and industry landscape, including economic indicators like GDP, interest rates, and industry-specific factors such as competitive rivalries, supplier power, and the threat of new entrants. The report then delves into a comparative financial analysis of Avjennings and Aveo, evaluating their liquidity, profitability, efficiency, capital structure, and market performance ratios. The analysis highlights the financial strengths and weaknesses of each company, providing insights that are crucial for investors and stakeholders. The report concludes with recommendations to improve market share within the Australian real estate sector.

Fundamental Analysis 1
Principles of Financial Market
Principles of Financial Market
Paraphrase This Document
Need a fresh take? Get an instant paraphrase of this document with our AI Paraphraser
Fundamental Analysis 2
Executive summary
Top down and bottom down approach play crucial role to manage the project. Whereas, top
down analyses the project by its bigger level and bottom up approach directly focuses on the
financial performance of a particular organization. This report confers the analysis of Australian
real estate industry comparing two market leader Avjennings limited and Aveo group. From the
top down method evaluates the market growth of the business. In addition to this, Avjennings
and Aveo group contains the small market segment in Australian economy. In this analysis,
Australian real estate market is analyzed through comparing the Avjennings and Aveo group. At
the market situation is favorable for the property business leader.
Apart from this, bottom up analysis includes the financial analysis of Avjennings and Aveo
group. Financial position of Aveo group is better than the Avjennings in concern to profit for the
year. In addition to this, liquidity ratio profitability ratio, efficiency ratio, capital structure ratio
and market performance ratio has calculated to find out the capacity of both organization through
which investors can take a beneficial decision. At the end recommendation is proposed to
improve the market share of organization in Australian real estate business.
Fundamental Analysis 3
Table of Contents
Introduction......................................................................................................................................3
Industry profile................................................................................................................................4
Company profile:.............................................................................................................................4
Avjennings Limited......................................................................................................................4
Aveo group...................................................................................................................................5
Top down analysis of Avjennings Limited and Aveo group...........................................................6
Economic analysis........................................................................................................................6
Industry analysis..........................................................................................................................7
Company Analysis:......................................................................................................................9
Bottom-up analysis for Avjennings and Aveo group....................................................................10
Liquidity ratio of Avjennings and Aveo group..........................................................................10
Profitability ratio:.......................................................................................................................11
Efficiency ratio:..........................................................................................................................13
Capital structure ratio:................................................................................................................14
Market performance ratio:.........................................................................................................15
Conclusions:..................................................................................................................................17
Recommendations:.....................................................................................................................18
Reference:......................................................................................................................................19
⊘ This is a preview!⊘
Do you want full access?
Subscribe today to unlock all pages.
Trusted by 1+ million students worldwide
Fundamental Analysis 4
Introduction
This report includes the top down and bottom down analysis for Avjennings limited and Aveo
group in real estate industry. On the basis of top down model, economic analysis, industry
analysis and company analysis has been discussed. It also focuses on the Australian real estate
market. On the other hand, financial performance of Avjennings and Aveo group is analyzed to
draw an effective decision. Both the organizations are compared on the basis of ratios calculation
such as liquidity, profitability and market performance.
Paraphrase This Document
Need a fresh take? Get an instant paraphrase of this document with our AI Paraphraser
Fundamental Analysis 5
Industry profile
Real estate industry of Australia is increasing very rapidly and it is the most attracting
investment sector in the country. It is a major contributor in the Australian economic growth as
compare to the other sectors. On the basis of market research it is reviewed that real estate
market has doubled in last 10 years. In addition to this, this industry contains 8% of market in
Australia. At the same time, this industry came out as the largest sector in the market to take over
the mining and financial industry. Further, it contributed with 11.5 % in Australian GDP which is
around $182.5 billion of national economy (Report Linker, 2017). It is a positive indication
because of the development of economy and it has created more job opportunities in the market.
Moreover, this industry is paying highest tax to the Australian government.
Company profile:
Avjennings Limited
Avjennings is leading real estate organization which deals in residential property development in
Australia. In addition to this, it offers land, towns, apartment and property investment to the
community. It is providing housing development service to the Australian market since last 80
years. At the same time, the financial position of the company is strong as per the performance in
last decade. Avjennings generated sales of A$421.88 million for the year 2016 and it is the
double growth rate as compare to year 2015 (Su, R2015). It captured the market cap as 226.81
million and net income as 40.91 million in year 2016. Moreover, it is operated in diverse range
of products in real estate such as buying, selling and construction but its major income source is
housing development. Avjennings ltd employed 457 people in this organization to deliver the
Fundamental Analysis 6
unique service to the community. Many institutional shareholders hold the share in company like
colonial first state asset management, dimensional fund advisors and perennial investment
partners with 12.97%, 1.95% and 9.22% respectively (financial times, 2017).
Aveo group
Aveo group is an organization which deals in property investment, asset management property
development and in construction of apartment in Australia. Headquarter of this group is located
in Sydney, Australia under the supervision of CEO Geoffrey Earl Grady. Further, it is operated
in two different segment of as per the nature of people such as retirement and non- retirement.
The market cap of this company is underlined as $1.92 billion in fiscal year 2016 (Aveo, 2016).
At the same time it employed 1640 people in organization to care the retired people for village
community and for development of residential commercial and retail property. Many substantial
shareholders invested in FKP group such as Mulpha international group, perpetual limited and
vinva investment with the holding as 22.60%, 10.30% and 5.06% respectively. Aveo group
earned the profit of 89.0 million in year 2016.
⊘ This is a preview!⊘
Do you want full access?
Subscribe today to unlock all pages.
Trusted by 1+ million students worldwide
Fundamental Analysis 7
Top down analysis of Avjennings Limited and Aveo group
Top down is a famous method which seeks to analyze the economy, industry and then
organization for the purpose of investment (Hopkinson, 2012). This approach assists an investor
to evaluate the specific industry to capitalize the fund for gain better return. Top down analysis
of Avjennings limited Aveo group is as follows:
Economic analysis
Economic analysis is a marginal analysis of economic factors that influence the growth of a
particular economy. Economic analysis comprises the different economic aspects like GDP,
inflation, interest rate, monetary policy, fiscal policy, and economic recession in an economy.
Australian economy is the mixed market economy on the globe. Australian economy is
performing as stable growth rate. Australian GDP is growing consistently with the growth rate of
2.4% in year 2016. At the same time, employment in this economy has increased as compare to
the OECD countries. On the other hand, unemployment rate has decreased from 5.7% to 5.6% in
year 2016. Australia is considered as the largest private sector business economy. Recently,
Australian economy experienced the better growth in the market due to the booming in property
investment and exports (Habc, 2017). In addition to this, Australia’s interest rate is very low
which influence the investors or exporters to deal with the economy, whereas it is measured as
1.5% and it is stable from the last quarter of 2016. It is stated that Avjennings and Aveo group
can invest in this country because of the high market growth from last five years. Further,
Australia is an attractive place to explore the business lines and it is best performing industrial
country since last decade. Service sector and agriculture industry are contributing in the
Australian economy with 68.8% and 27.3% respectively. Further, it is the best place to do
Paraphrase This Document
Need a fresh take? Get an instant paraphrase of this document with our AI Paraphraser
Fundamental Analysis 8
business because of the stability in political era, rich natural resource. Along with this, Australian
economy is not influenced by financial crisis in 2008 and 2012 (habc, 2017). In this economy,
lowest government debt is measured. Population of Australia is increasing slowly but it is the
sixth populated country on the globe. Population of Australia is measured as 24.1 million in year
2016 and it was the 1.4 increment from last year (Trading Economics, 2017). Moreover,
Australian currency has devaluated by 0.38% in starting of year 2017, it occurs due to the
fluctuation in various economic transactions. Foreign investment is a key growth factor in
Australian economy and it is increasing gradually (Dixon, 2016). In addition to this, foreign
investment is calculated as $38.4bn in 2015. Low interest rate for capital borrowing in market
attracts the investors to seed fund in various business segment.
Industry analysis
Real estate industry is evaluated on the basis of porter’s five forces model. Australian real estate
industry analysis is as follow:
Competitive rivalries: Real estate industry is considered as the highest revenue generator
industry as compare to the other industries in Australian market. Real estate industry of Australia
is growing steady but the overall performance of this industry is attractive because the other
geographic state boomed in last 3 years (CBRE, 2016). Competition level in property industry is
very high. Avjennings and Aveo group are the prominent leader in Australian real estate
industry.
Bargaining power of the buyer: Bargaining power of Australia people is high. Australian real
estate industry is affected by the increment in property price, interest rate, economic growth and
employment growth. Further, increment in housing price can affects the buying behavior of the
property purchaser and customer can switch the property agent as per the market price
Fundamental Analysis 9
(Dalmendo, 2016). Further, there are many property and housing development leaders in the
market which also influence buying intensity of people.
Bargaining power of suppliers: Bargaining power of suppliers of suppliers is high in Australia.
Price of supplied items that are used as raw material in real estate industry has increased. At the
same time, demand for the housing development has increased so it affects the decision of
buyers. Property agent wants to purchase the raw material at low price in highly demanded
market but the suppliers also wants to gain the more profit out of market, it can affects the supply
side of property market.
Threats of new entrants: Australian industry is not influenced by the new entrants. In real
estate industry new property investors are entering in the market steadily because it requires
large investment in this sector to tap the new customer. In real estate sector many high revenue
generator business leaders existing, along with this, Avjennings and Aveo group are the leading
housing development agents in the market and they are meeting the demand of retired or non
retired people in the country.
Threats of substitutes: Threats of substitute is moderate as the level of demand increases in the
economy. Real estate industry may be affected by the various economic aspects in the economic
downturn. Further, substitutes of real industry cannot be beneficial for long time such as buying
with other, off the plan and reinvesting (Cahill, 2017). On the other hand, competitor’s policy
like affordable housing, low interest rate, and low material price can affects the market
movement in real estate industry.
⊘ This is a preview!⊘
Do you want full access?
Subscribe today to unlock all pages.
Trusted by 1+ million students worldwide
Fundamental Analysis 10
Company Analysis:
Avjennings and Aveo groups are the real estate market participant in Australian economy.
Avjennings is committed to offer affordable housing property such as town, rental, community
development and residential property (Avjennings, 2016). At the same time, Aveo group
provides the housing development facilities to retires and non- retires people in the country
(Aveo, 2017). Further, Avjennings focus on the development of community and it deals in
diverse range of property business which is competitive advantage for the business. On the other
hand, promotional strategy of Aveo group is strong in the market.
Apart from this, financial movement of both the organization has been increased. Aveo group
gained more profit as compare to the Avjennings as $89m which is approx double than
Avjennings in year 2016. Australian property market dubbed in last two years but the businesses
are going to grab the market share. Further, the market value of Avjennings has increased from
last 5 years. Aveo group employed more human resource as compare to the Avjennings.
Avjennings and Aveo group are gaining the market share through its competitive strategy to
attract the different group of people from community. Aveo group is older property developer
than Aveo group.
Paraphrase This Document
Need a fresh take? Get an instant paraphrase of this document with our AI Paraphraser
Fundamental Analysis 11
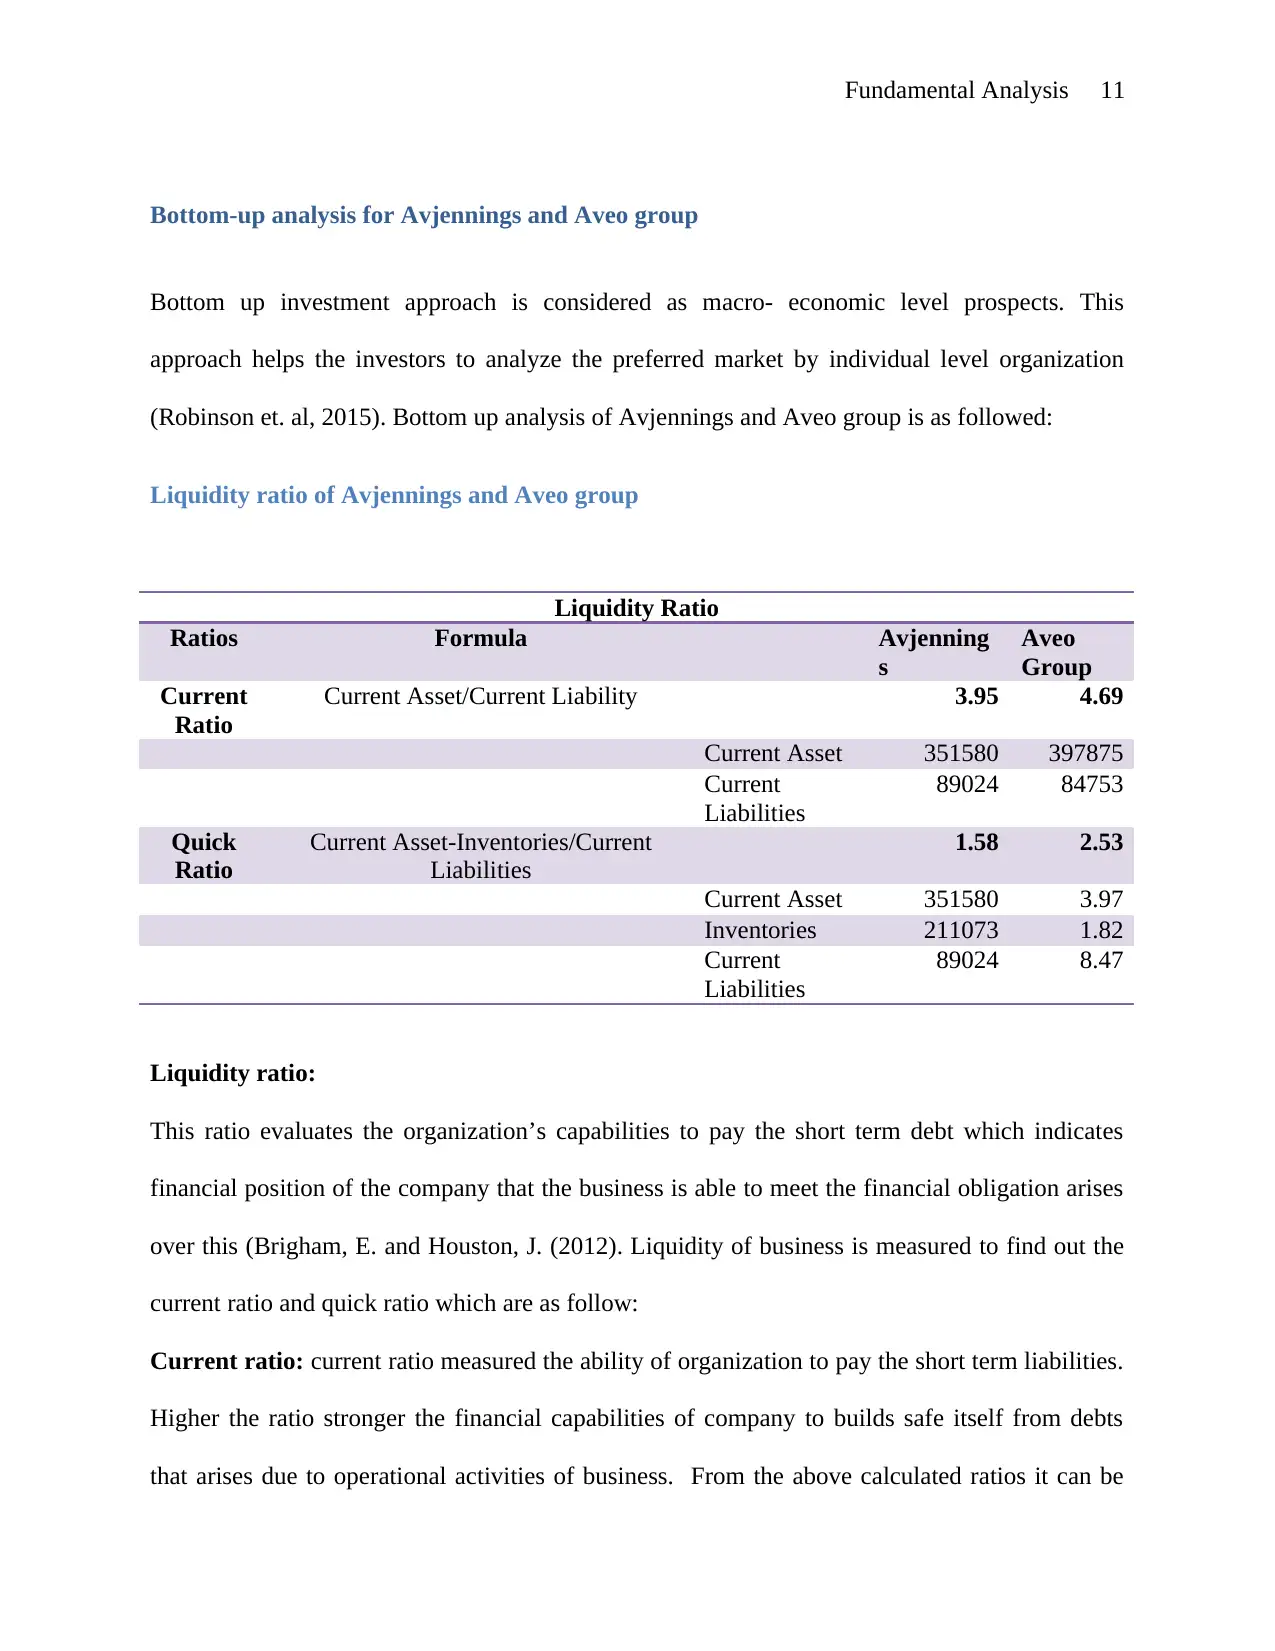
Bottom-up analysis for Avjennings and Aveo group
Bottom up investment approach is considered as macro- economic level prospects. This
approach helps the investors to analyze the preferred market by individual level organization
(Robinson et. al, 2015). Bottom up analysis of Avjennings and Aveo group is as followed:
Liquidity ratio of Avjennings and Aveo group
Liquidity Ratio
Ratios Formula Avjenning
s
Aveo
Group
Current
Ratio
Current Asset/Current Liability 3.95 4.69
Current Asset 351580 397875
Current
Liabilities
89024 84753
Quick
Ratio
Current Asset-Inventories/Current
Liabilities
1.58 2.53
Current Asset 351580 3.97
Inventories 211073 1.82
Current
Liabilities
89024 8.47
Liquidity ratio:
This ratio evaluates the organization’s capabilities to pay the short term debt which indicates
financial position of the company that the business is able to meet the financial obligation arises
over this (Brigham, E. and Houston, J. (2012). Liquidity of business is measured to find out the
current ratio and quick ratio which are as follow:
Current ratio: current ratio measured the ability of organization to pay the short term liabilities.
Higher the ratio stronger the financial capabilities of company to builds safe itself from debts
that arises due to operational activities of business. From the above calculated ratios it can be
Fundamental Analysis 12
said that the current ratio for Aveo group better than Avjennings as it depicted by 3.95% and
4.69%is calculated as 2.45 and 0.17 which indicates that the Aveo group has much capacity to
meet the short term debt over the company.
Quick ratio: Quick ratio is also known as acid test ratio which point out the ability of company
to pay the debt with the assets capacity (Magad, 2013). Along with this, quick ratio also indicates
the enhanced financial ability of Aveo group rather than Avjennings and it is differentiated by
0.95% which derives good value for the company among shareholders and external investors to
pay the quick liability over the company by asset proportion.
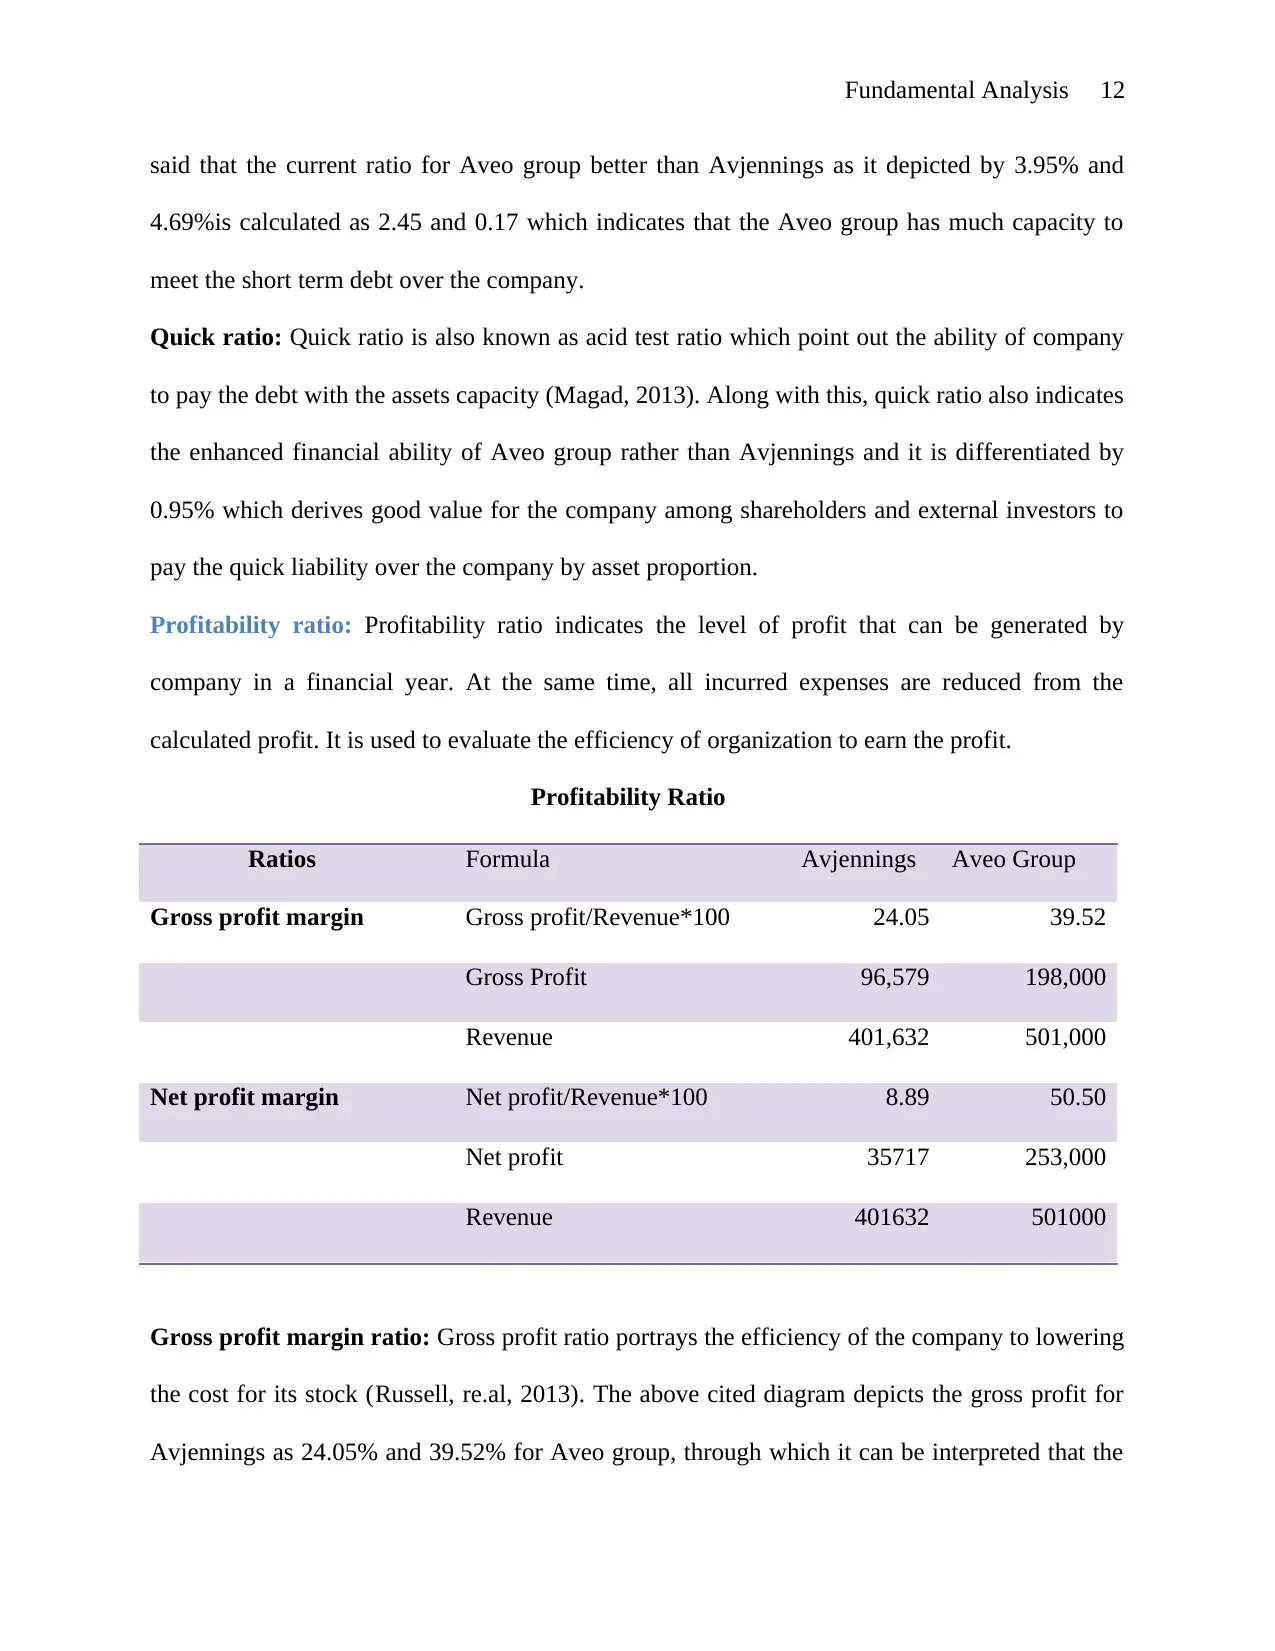
Profitability ratio: Profitability ratio indicates the level of profit that can be generated by
company in a financial year. At the same time, all incurred expenses are reduced from the
calculated profit. It is used to evaluate the efficiency of organization to earn the profit.
Profitability Ratio
Ratios Formula Avjennings Aveo Group
Gross profit margin Gross profit/Revenue*100 24.05 39.52
Gross Profit 96,579 198,000
Revenue 401,632 501,000
Net profit margin Net profit/Revenue*100 8.89 50.50
Net profit 35717 253,000
Revenue 401632 501000
Gross profit margin ratio: Gross profit ratio portrays the efficiency of the company to lowering
the cost for its stock (Russell, re.al, 2013). The above cited diagram depicts the gross profit for
Avjennings as 24.05% and 39.52% for Aveo group, through which it can be interpreted that the
said that the current ratio for Aveo group better than Avjennings as it depicted by 3.95% and
4.69%is calculated as 2.45 and 0.17 which indicates that the Aveo group has much capacity to
meet the short term debt over the company.
Quick ratio: Quick ratio is also known as acid test ratio which point out the ability of company
to pay the debt with the assets capacity (Magad, 2013). Along with this, quick ratio also indicates
the enhanced financial ability of Aveo group rather than Avjennings and it is differentiated by
0.95% which derives good value for the company among shareholders and external investors to
pay the quick liability over the company by asset proportion.
Profitability ratio: Profitability ratio indicates the level of profit that can be generated by
company in a financial year. At the same time, all incurred expenses are reduced from the
calculated profit. It is used to evaluate the efficiency of organization to earn the profit.
Profitability Ratio
Ratios Formula Avjennings Aveo Group
Gross profit margin Gross profit/Revenue*100 24.05 39.52
Gross Profit 96,579 198,000
Revenue 401,632 501,000
Net profit margin Net profit/Revenue*100 8.89 50.50
Net profit 35717 253,000
Revenue 401632 501000
Gross profit margin ratio: Gross profit ratio portrays the efficiency of the company to lowering
the cost for its stock (Russell, re.al, 2013). The above cited diagram depicts the gross profit for
Avjennings as 24.05% and 39.52% for Aveo group, through which it can be interpreted that the
⊘ This is a preview!⊘
Do you want full access?
Subscribe today to unlock all pages.
Trusted by 1+ million students worldwide
1 out of 23
Related Documents


Your All-in-One AI-Powered Toolkit for Academic Success.
+13062052269
info@desklib.com
Available 24*7 on WhatsApp / Email
![[object Object]](/_next/static/media/star-bottom.7253800d.svg)
Unlock your academic potential
Copyright © 2020–2026 A2Z Services. All Rights Reserved. Developed and managed by ZUCOL.