Comparative Financial Analysis of Axiata Group Berhad and Digi.Com
VerifiedAdded on 2022/09/09
|27
|5822
|22
Report
AI Summary
This report presents a detailed financial analysis of Axiata Group Berhad and Digi.Com Berhad, two prominent telecommunication companies in Malaysia. The analysis begins with an introduction to the companies, followed by a comparison of their financial performance using ratio analysis across profitability, liquidity, efficiency, capital structure, and investor ratios. The report employs graphs and charts to visually represent the data, highlighting key trends and differences between the two companies over a five-year period. Strategic and operational issues are identified for each company, drawing conclusions based on the financial data. The analysis reveals that Digi generally outperforms Axiata in terms of profitability and efficiency, while Axiata demonstrates a stronger capital structure. The report also discusses the implications of these findings for investors and stakeholders. This report is a comprehensive comparative study of the financial health and strategic challenges faced by Axiata and Digi, providing valuable insights into the telecommunications industry in Malaysia.

Running head: FINANCIAL ANALYSIS AND MANAGEMENT
Financial Analysis and Management
Name of the Student
Name of the University
Author’s Note
Financial Analysis and Management
Name of the Student
Name of the University
Author’s Note
Paraphrase This Document
Need a fresh take? Get an instant paraphrase of this document with our AI Paraphraser
1FINANCIAL ANALYSIS AND MANAGEMENT
Table of Contents
Part 1..........................................................................................................................................2
Introduction............................................................................................................................2
Introduction on the Companies..............................................................................................2
Comparison and Analysis of the Financial Performance.......................................................3
Identification of Strategic and Operational Issues...............................................................13
Conclusion............................................................................................................................16
Part 2........................................................................................................................................17
Introduction..........................................................................................................................17
Five Difference Sources of External Finance......................................................................17
Weighted Average Cost of Capital......................................................................................19
Conclusion............................................................................................................................20
References................................................................................................................................22
2FINANCIAL ANALYSIS AND MANAGEMENT
Part 1
Introduction
Determination of the overall financial health of a company demands assessing and
evaluating both financial performance and position of the same company with the use of
different financial analysis techniques. This helps the investors, creditors and other
stakeholders to know the trend of financial performance of the companies. In this regard,
analysis of ratios is considered as a major technique for assessing and comparing the financial
performance of more than one companies (Fatihudin 2018). In addition, the use of graphs and
charts largely helps in the analysis. This report intends at analysing as well as evaluating the
financial performance and financial position of two companies operating in the
telecommunication industry of Malaysia. These two companies are Axiata Group Berhad
(Axiata) and Digi.Com Berhad (Digi) that is the competitor company; and both of these
companies are listed in Bursa Malaysia. This report also discusses about the strategic and
operational issues in these two companies.
Introduction on the Companies
Axiata is considered a major telecommunication companies in Asia. The
transformation of this companies can be seen from a holding business entity with a portfolio
of pure-play mobile assets into a Triple Core Strategy-driven business organization with a
focus on Digital Telco, Digital Businesses and communication infrastructure. The main
products of the company include mobile network operation, network infrustrurure and digital
internet (axiata.com 2019). Digi is a major Malaysian company involves in providing mobile
connectivity and internet services on its advanced G+ network. Digi is famous for providing
its customers with relevant, personalized and engaging digital products and services with the
aim to enhance their digital lifestyle. The key product line of the business include mobile
⊘ This is a preview!⊘
Do you want full access?
Subscribe today to unlock all pages.
Trusted by 1+ million students worldwide
3FINANCIAL ANALYSIS AND MANAGEMENT
services, telecommunication services and cable television (ocs.digi.com.my 2019). Both
Axiata and Digi operate in the telecommunication industry of Malaysia. In case of the market
share, Digi has the maximum share in the Malaysian telecommunication industry where
Axiata has less market share as compared to Digi (statista.com 2019). As per the chairman’s
statement of Axiata, the company had to face many business risks due to the presence of
volatile macroeconomic condition, market as well as technological disruption, shift in
demand and key regulatory uncertainties across the region (axiata.listedcompany.com 2019).
On the other hand, Digi has been able in providing a solid financial performance that
provided the shareholders with healthy returns. This has provided the company with major
confidence (digi.listedcompany.com 2019). In the presence of this reasons, Digi can be
considered as a major competitor of Axiata in case it want to become the market leader.
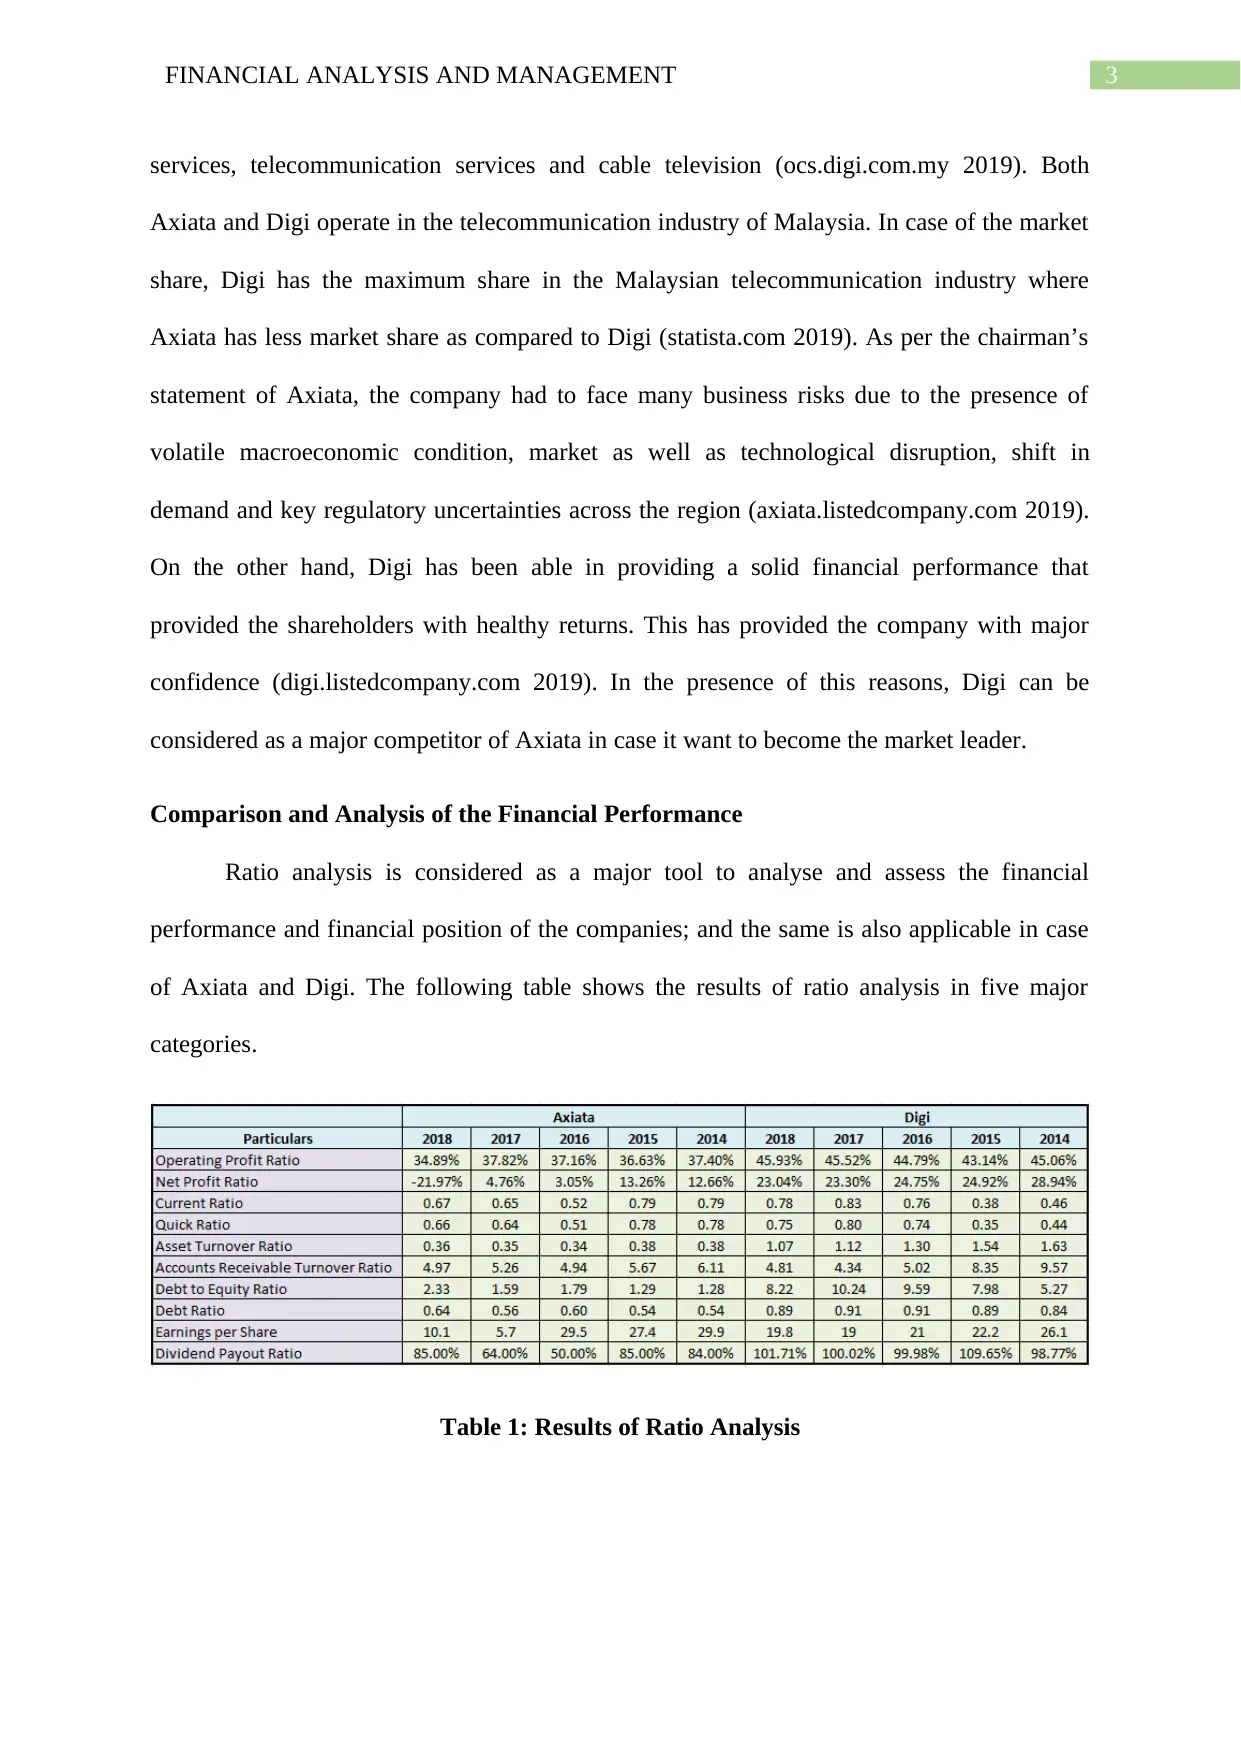
Comparison and Analysis of the Financial Performance
Ratio analysis is considered as a major tool to analyse and assess the financial
performance and financial position of the companies; and the same is also applicable in case
of Axiata and Digi. The following table shows the results of ratio analysis in five major
categories.
Table 1: Results of Ratio Analysis
services, telecommunication services and cable television (ocs.digi.com.my 2019). Both
Axiata and Digi operate in the telecommunication industry of Malaysia. In case of the market
share, Digi has the maximum share in the Malaysian telecommunication industry where
Axiata has less market share as compared to Digi (statista.com 2019). As per the chairman’s
statement of Axiata, the company had to face many business risks due to the presence of
volatile macroeconomic condition, market as well as technological disruption, shift in
demand and key regulatory uncertainties across the region (axiata.listedcompany.com 2019).
On the other hand, Digi has been able in providing a solid financial performance that
provided the shareholders with healthy returns. This has provided the company with major
confidence (digi.listedcompany.com 2019). In the presence of this reasons, Digi can be
considered as a major competitor of Axiata in case it want to become the market leader.
Comparison and Analysis of the Financial Performance
Ratio analysis is considered as a major tool to analyse and assess the financial
performance and financial position of the companies; and the same is also applicable in case
of Axiata and Digi. The following table shows the results of ratio analysis in five major
categories.
Table 1: Results of Ratio Analysis
Paraphrase This Document
Need a fresh take? Get an instant paraphrase of this document with our AI Paraphraser
4FINANCIAL ANALYSIS AND MANAGEMENT
It can be seen from the above table that both the companies have performed
differently under the ratios. The following discussion shows the use of graphs with the aim to
compare the financial performance and position of these two selected companies.
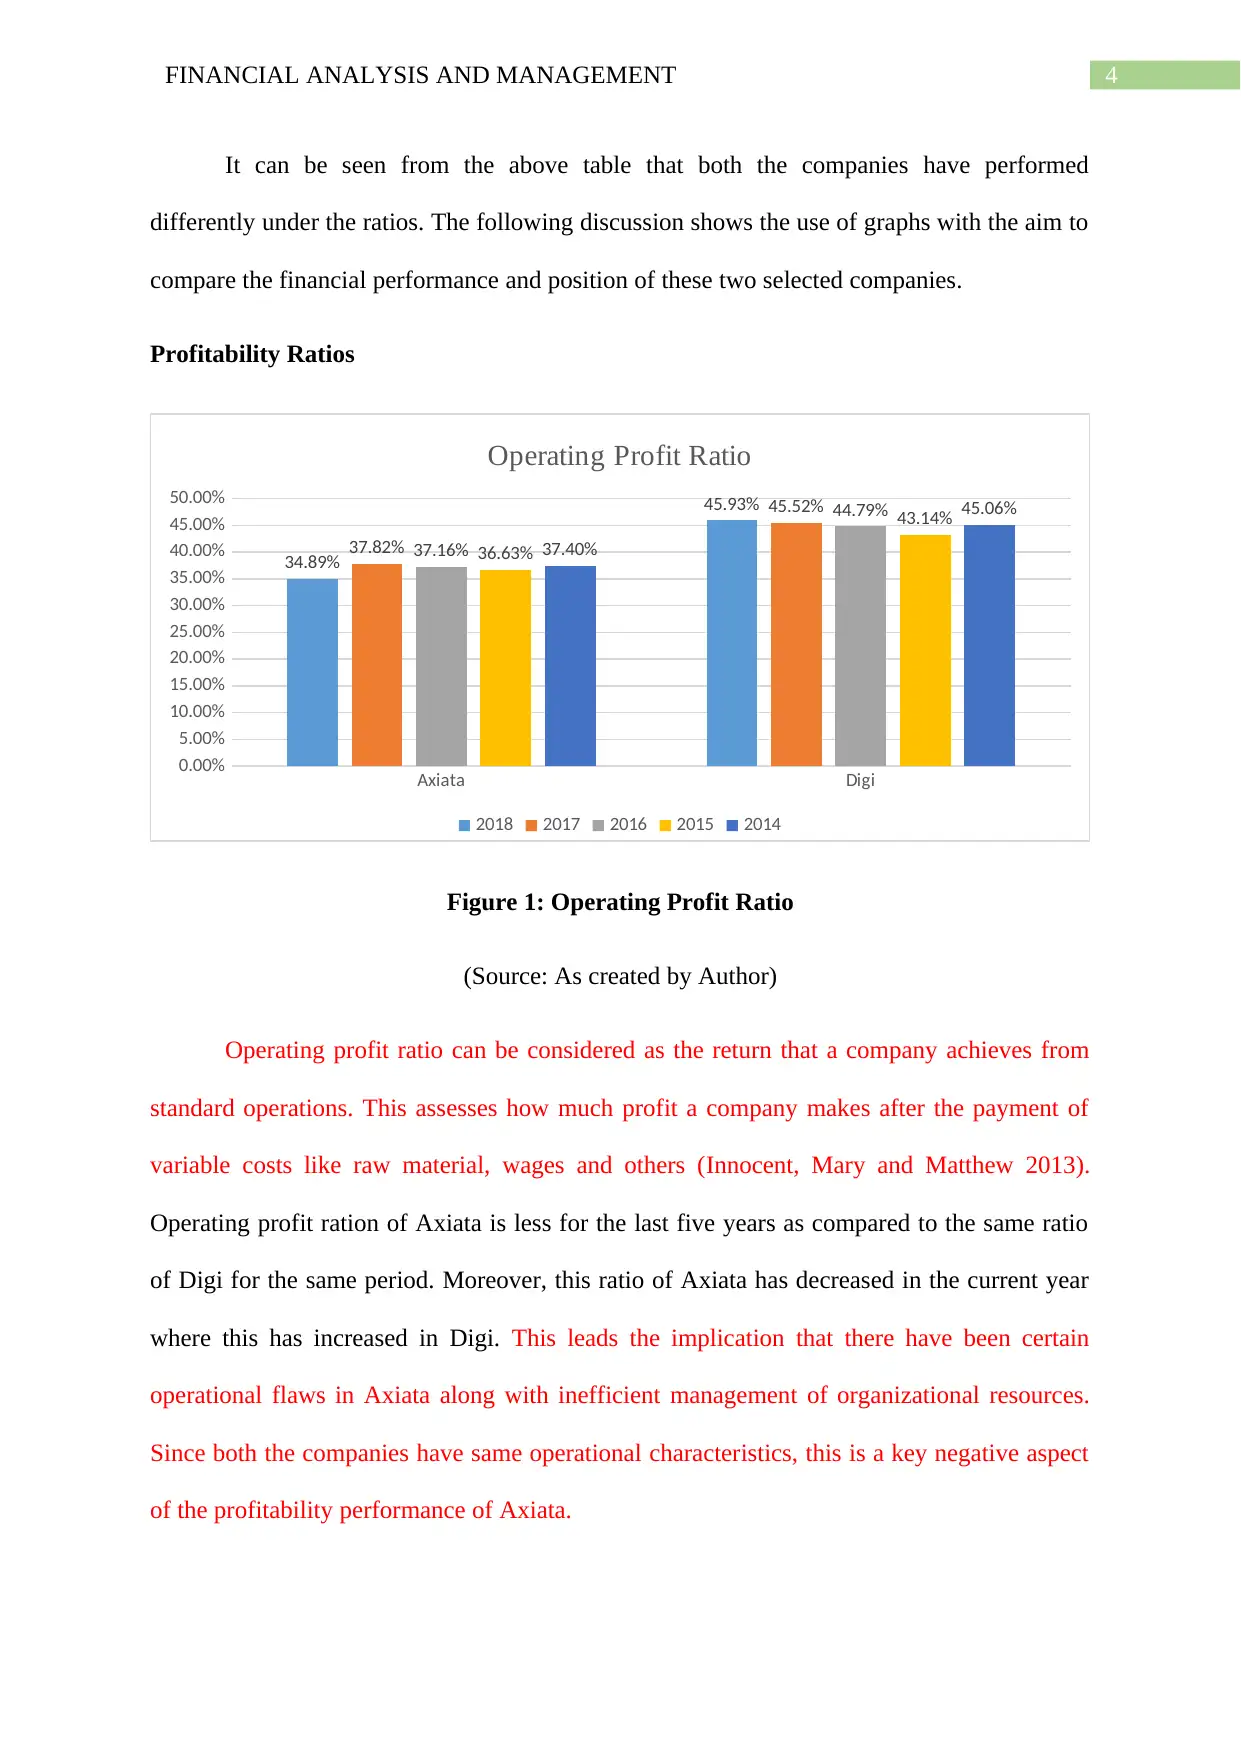
Profitability Ratios
Axiata Digi
0.00%
5.00%
10.00%
15.00%
20.00%
25.00%
30.00%
35.00%
40.00%
45.00%
50.00%
34.89%
45.93%
37.82%
45.52%
37.16%
44.79%
36.63%
43.14%
37.40%
45.06%
Operating Profit Ratio
2018 2017 2016 2015 2014
Figure 1: Operating Profit Ratio
(Source: As created by Author)
Operating profit ratio can be considered as the return that a company achieves from
standard operations. This assesses how much profit a company makes after the payment of
variable costs like raw material, wages and others (Innocent, Mary and Matthew 2013).
Operating profit ration of Axiata is less for the last five years as compared to the same ratio
of Digi for the same period. Moreover, this ratio of Axiata has decreased in the current year
where this has increased in Digi. This leads the implication that there have been certain
operational flaws in Axiata along with inefficient management of organizational resources.
Since both the companies have same operational characteristics, this is a key negative aspect
of the profitability performance of Axiata.
It can be seen from the above table that both the companies have performed
differently under the ratios. The following discussion shows the use of graphs with the aim to
compare the financial performance and position of these two selected companies.
Profitability Ratios
Axiata Digi
0.00%
5.00%
10.00%
15.00%
20.00%
25.00%
30.00%
35.00%
40.00%
45.00%
50.00%
34.89%
45.93%
37.82%
45.52%
37.16%
44.79%
36.63%
43.14%
37.40%
45.06%
Operating Profit Ratio
2018 2017 2016 2015 2014
Figure 1: Operating Profit Ratio
(Source: As created by Author)
Operating profit ratio can be considered as the return that a company achieves from
standard operations. This assesses how much profit a company makes after the payment of
variable costs like raw material, wages and others (Innocent, Mary and Matthew 2013).
Operating profit ration of Axiata is less for the last five years as compared to the same ratio
of Digi for the same period. Moreover, this ratio of Axiata has decreased in the current year
where this has increased in Digi. This leads the implication that there have been certain
operational flaws in Axiata along with inefficient management of organizational resources.
Since both the companies have same operational characteristics, this is a key negative aspect
of the profitability performance of Axiata.
5FINANCIAL ANALYSIS AND MANAGEMENT
Axiata Digi
-30.00%
-20.00%
-10.00%
0.00%
10.00%
20.00%
30.00%
40.00%
-21.97%
23.04%
4.76%
23.30%
3.05%
24.75%
13.26%
24.92%
12.66%
28.94%
Net Profit Ratio
2018 2017 2016 2015 2014
Figure 2: Net Profit Ratio
(Source: As created by Author)
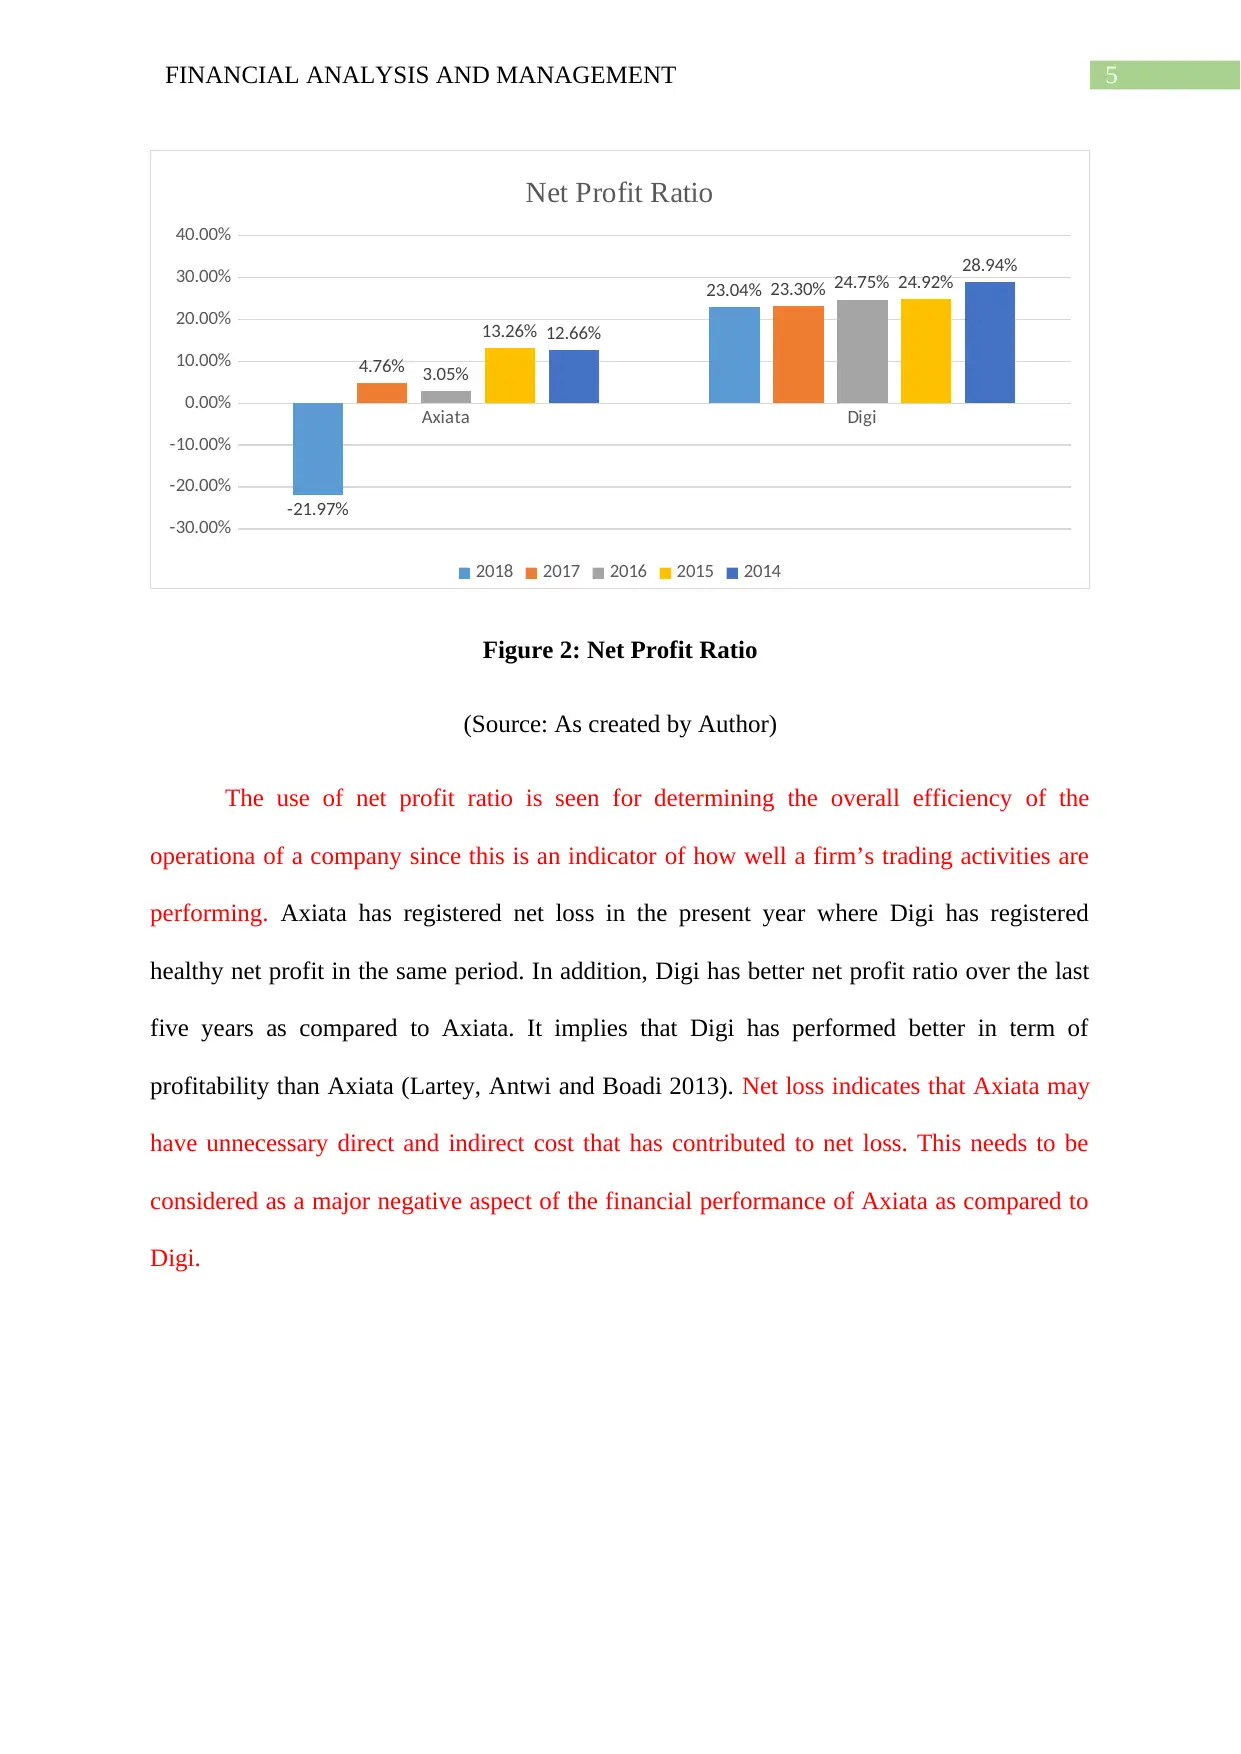
The use of net profit ratio is seen for determining the overall efficiency of the
operationa of a company since this is an indicator of how well a firm’s trading activities are
performing. Axiata has registered net loss in the present year where Digi has registered
healthy net profit in the same period. In addition, Digi has better net profit ratio over the last
five years as compared to Axiata. It implies that Digi has performed better in term of
profitability than Axiata (Lartey, Antwi and Boadi 2013). Net loss indicates that Axiata may
have unnecessary direct and indirect cost that has contributed to net loss. This needs to be
considered as a major negative aspect of the financial performance of Axiata as compared to
Digi.
Axiata Digi
-30.00%
-20.00%
-10.00%
0.00%
10.00%
20.00%
30.00%
40.00%
-21.97%
23.04%
4.76%
23.30%
3.05%
24.75%
13.26%
24.92%
12.66%
28.94%
Net Profit Ratio
2018 2017 2016 2015 2014
Figure 2: Net Profit Ratio
(Source: As created by Author)
The use of net profit ratio is seen for determining the overall efficiency of the
operationa of a company since this is an indicator of how well a firm’s trading activities are
performing. Axiata has registered net loss in the present year where Digi has registered
healthy net profit in the same period. In addition, Digi has better net profit ratio over the last
five years as compared to Axiata. It implies that Digi has performed better in term of
profitability than Axiata (Lartey, Antwi and Boadi 2013). Net loss indicates that Axiata may
have unnecessary direct and indirect cost that has contributed to net loss. This needs to be
considered as a major negative aspect of the financial performance of Axiata as compared to
Digi.
⊘ This is a preview!⊘
Do you want full access?
Subscribe today to unlock all pages.
Trusted by 1+ million students worldwide
6FINANCIAL ANALYSIS AND MANAGEMENT
Liquidity Ratios
Axiata Digi
0.00
0.10
0.20
0.30
0.40
0.50
0.60
0.70
0.80
0.90
0.67
0.78
0.65
0.83
0.52
0.760.79
0.38
0.79
0.46
Current Ratio
2018 2017 2016 2015 2014
Figure 3: Current Ratio
(Source: As created by Author)
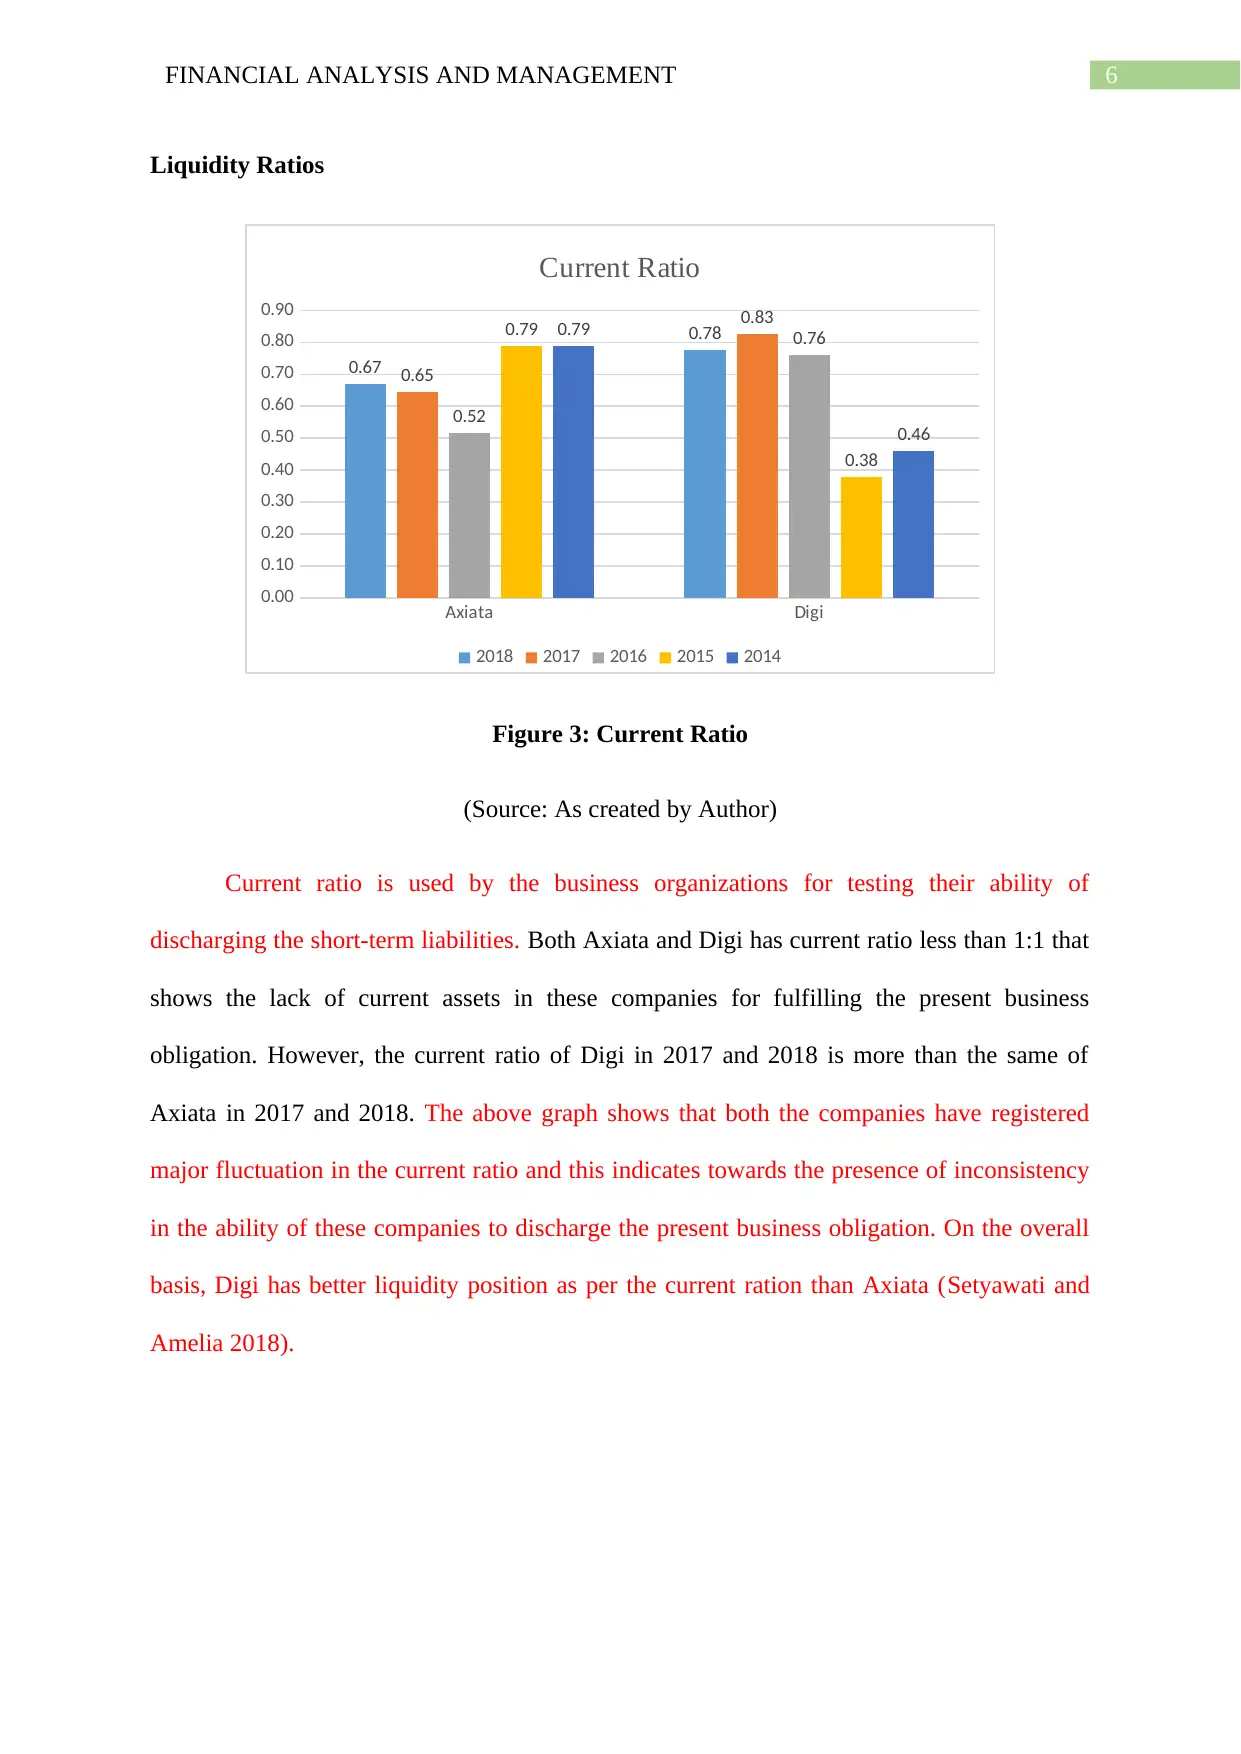
Current ratio is used by the business organizations for testing their ability of
discharging the short-term liabilities. Both Axiata and Digi has current ratio less than 1:1 that
shows the lack of current assets in these companies for fulfilling the present business
obligation. However, the current ratio of Digi in 2017 and 2018 is more than the same of
Axiata in 2017 and 2018. The above graph shows that both the companies have registered
major fluctuation in the current ratio and this indicates towards the presence of inconsistency
in the ability of these companies to discharge the present business obligation. On the overall
basis, Digi has better liquidity position as per the current ration than Axiata (Setyawati and
Amelia 2018).
Liquidity Ratios
Axiata Digi
0.00
0.10
0.20
0.30
0.40
0.50
0.60
0.70
0.80
0.90
0.67
0.78
0.65
0.83
0.52
0.760.79
0.38
0.79
0.46
Current Ratio
2018 2017 2016 2015 2014
Figure 3: Current Ratio
(Source: As created by Author)
Current ratio is used by the business organizations for testing their ability of
discharging the short-term liabilities. Both Axiata and Digi has current ratio less than 1:1 that
shows the lack of current assets in these companies for fulfilling the present business
obligation. However, the current ratio of Digi in 2017 and 2018 is more than the same of
Axiata in 2017 and 2018. The above graph shows that both the companies have registered
major fluctuation in the current ratio and this indicates towards the presence of inconsistency
in the ability of these companies to discharge the present business obligation. On the overall
basis, Digi has better liquidity position as per the current ration than Axiata (Setyawati and
Amelia 2018).
Paraphrase This Document
Need a fresh take? Get an instant paraphrase of this document with our AI Paraphraser
7FINANCIAL ANALYSIS AND MANAGEMENT
Axiata Digi
0.00
0.10
0.20
0.30
0.40
0.50
0.60
0.70
0.80
0.90
0.66
0.75
0.64
0.80
0.51
0.74
0.78
0.35
0.78
0.44
Quick Ratio
2018 2017 2016 2015 2014
Figure 4: Quick Ratio
(Source: As created by Author)
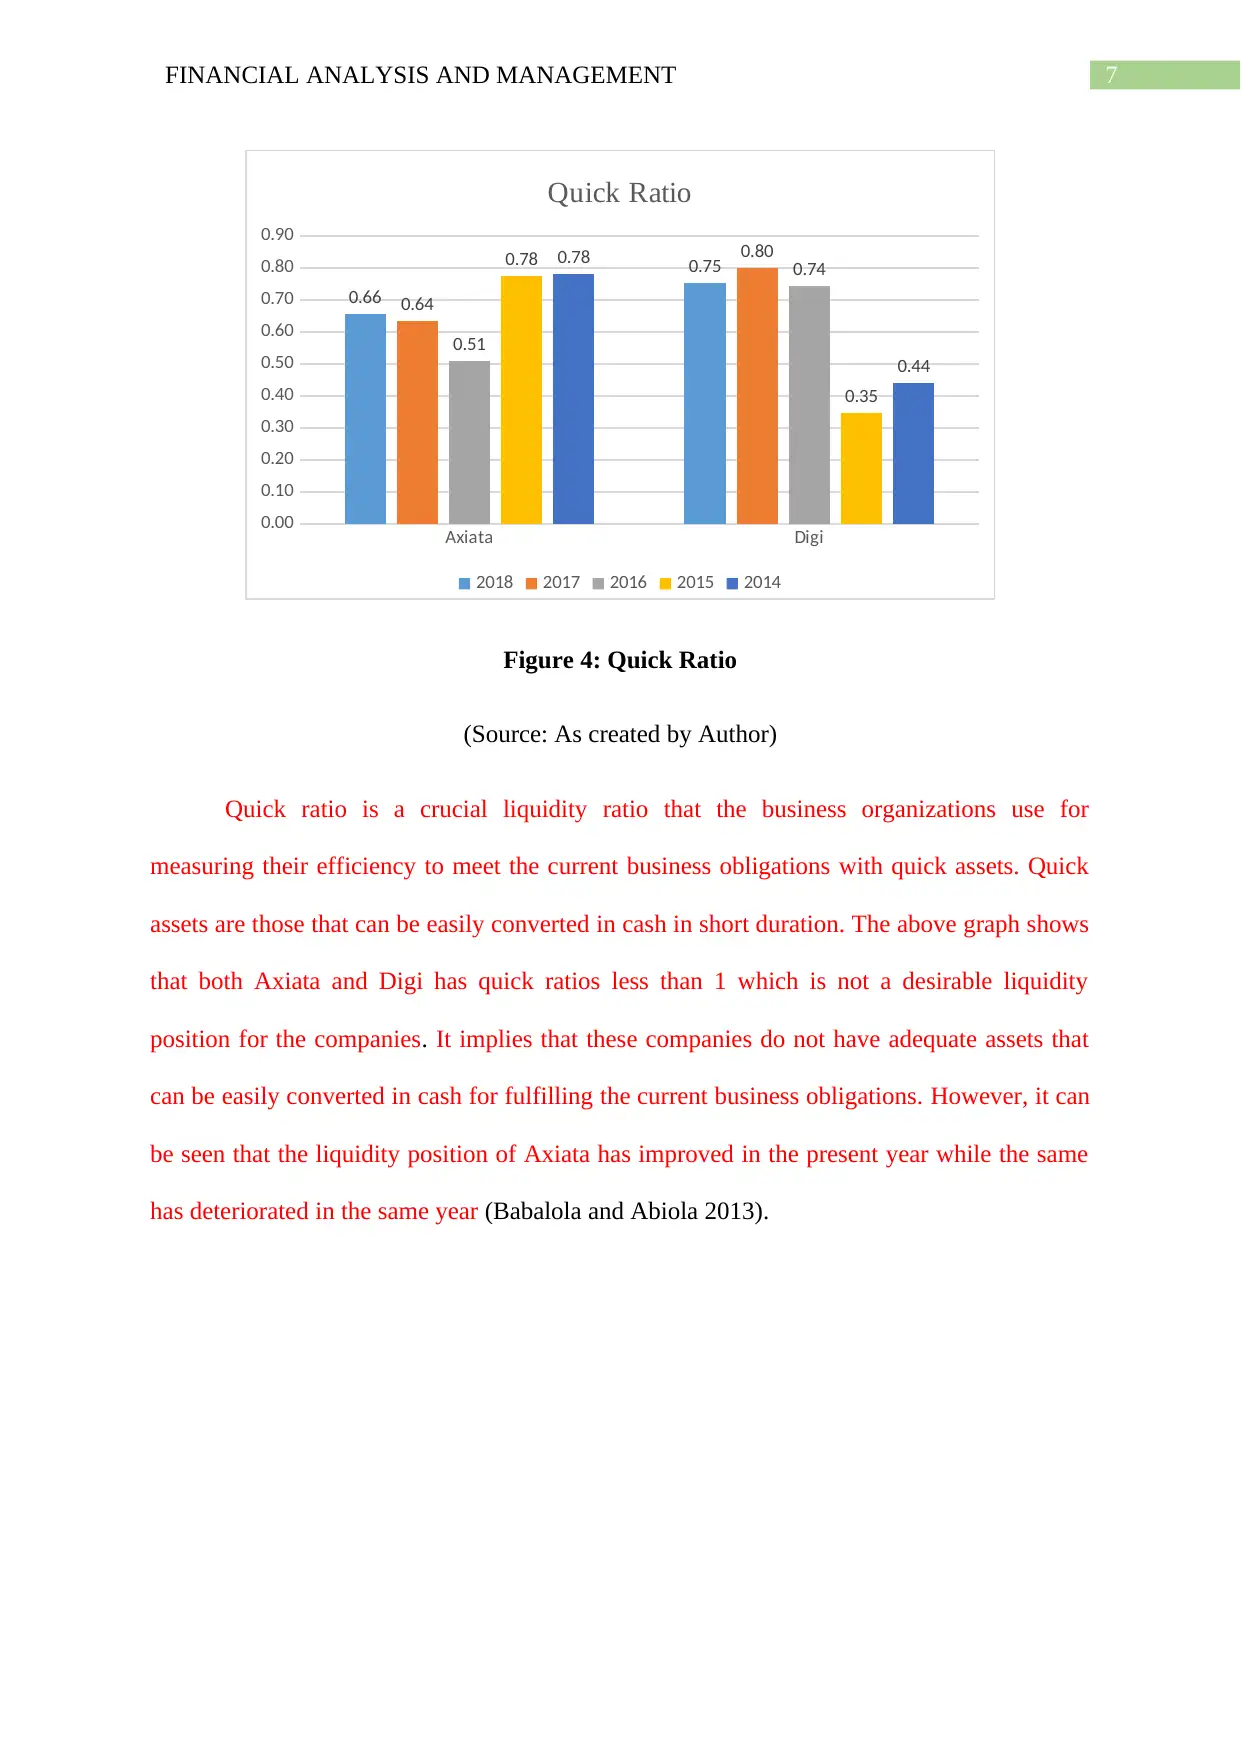
Quick ratio is a crucial liquidity ratio that the business organizations use for
measuring their efficiency to meet the current business obligations with quick assets. Quick
assets are those that can be easily converted in cash in short duration. The above graph shows
that both Axiata and Digi has quick ratios less than 1 which is not a desirable liquidity
position for the companies. It implies that these companies do not have adequate assets that
can be easily converted in cash for fulfilling the current business obligations. However, it can
be seen that the liquidity position of Axiata has improved in the present year while the same
has deteriorated in the same year (Babalola and Abiola 2013).
Axiata Digi
0.00
0.10
0.20
0.30
0.40
0.50
0.60
0.70
0.80
0.90
0.66
0.75
0.64
0.80
0.51
0.74
0.78
0.35
0.78
0.44
Quick Ratio
2018 2017 2016 2015 2014
Figure 4: Quick Ratio
(Source: As created by Author)
Quick ratio is a crucial liquidity ratio that the business organizations use for
measuring their efficiency to meet the current business obligations with quick assets. Quick
assets are those that can be easily converted in cash in short duration. The above graph shows
that both Axiata and Digi has quick ratios less than 1 which is not a desirable liquidity
position for the companies. It implies that these companies do not have adequate assets that
can be easily converted in cash for fulfilling the current business obligations. However, it can
be seen that the liquidity position of Axiata has improved in the present year while the same
has deteriorated in the same year (Babalola and Abiola 2013).
8FINANCIAL ANALYSIS AND MANAGEMENT
Efficiency Ratios
Axiata Digi
0.00
0.20
0.40
0.60
0.80
1.00
1.20
1.40
1.60
1.80
0.36
1.07
0.35
1.12
0.34
1.30
0.38
1.54
0.38
1.63
Asset Turnover Ratio
2018 2017 2016 2015 2014
Figure 5: Asset Turnover Ratio
(Source: As created by Author)
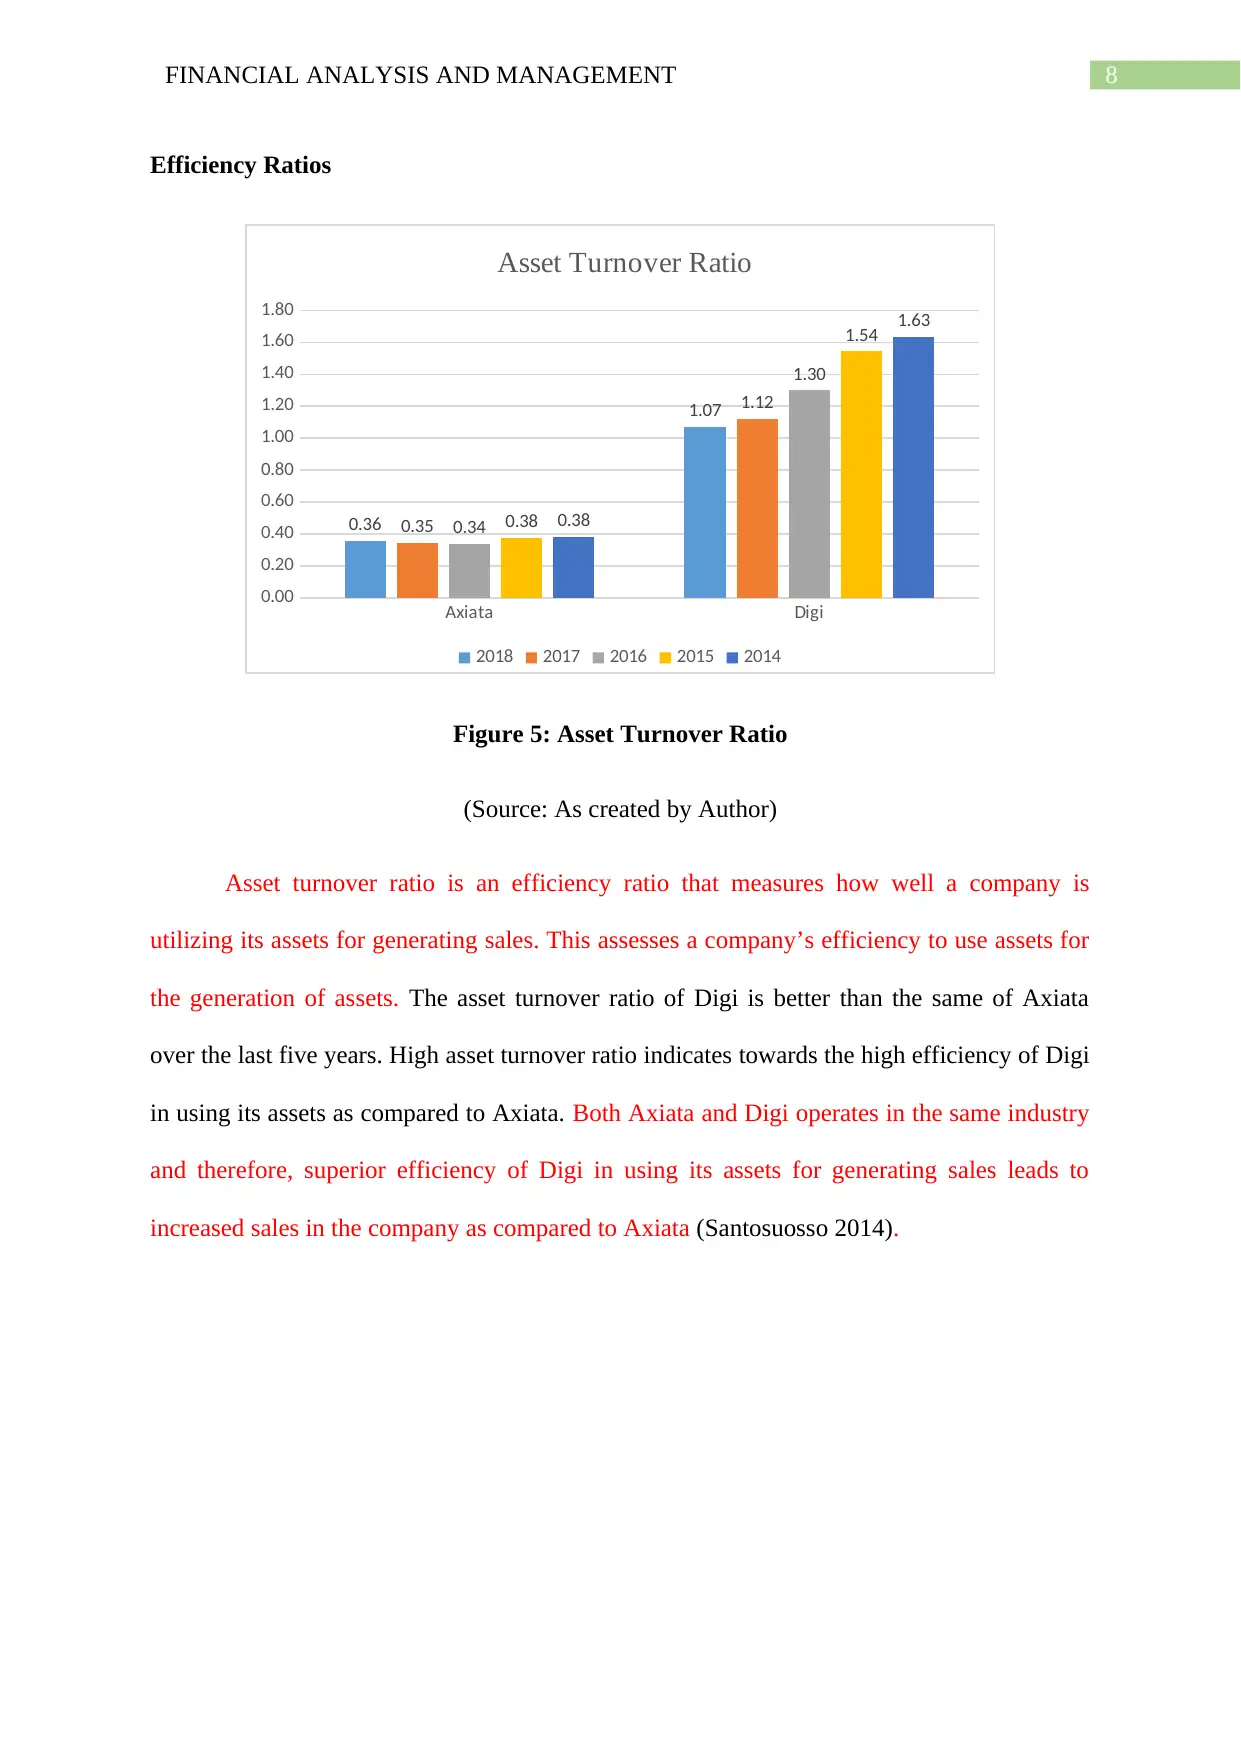
Asset turnover ratio is an efficiency ratio that measures how well a company is
utilizing its assets for generating sales. This assesses a company’s efficiency to use assets for
the generation of assets. The asset turnover ratio of Digi is better than the same of Axiata
over the last five years. High asset turnover ratio indicates towards the high efficiency of Digi
in using its assets as compared to Axiata. Both Axiata and Digi operates in the same industry
and therefore, superior efficiency of Digi in using its assets for generating sales leads to
increased sales in the company as compared to Axiata (Santosuosso 2014).
Efficiency Ratios
Axiata Digi
0.00
0.20
0.40
0.60
0.80
1.00
1.20
1.40
1.60
1.80
0.36
1.07
0.35
1.12
0.34
1.30
0.38
1.54
0.38
1.63
Asset Turnover Ratio
2018 2017 2016 2015 2014
Figure 5: Asset Turnover Ratio
(Source: As created by Author)
Asset turnover ratio is an efficiency ratio that measures how well a company is
utilizing its assets for generating sales. This assesses a company’s efficiency to use assets for
the generation of assets. The asset turnover ratio of Digi is better than the same of Axiata
over the last five years. High asset turnover ratio indicates towards the high efficiency of Digi
in using its assets as compared to Axiata. Both Axiata and Digi operates in the same industry
and therefore, superior efficiency of Digi in using its assets for generating sales leads to
increased sales in the company as compared to Axiata (Santosuosso 2014).
⊘ This is a preview!⊘
Do you want full access?
Subscribe today to unlock all pages.
Trusted by 1+ million students worldwide
9FINANCIAL ANALYSIS AND MANAGEMENT
Axiata Digi
0.00
2.00
4.00
6.00
8.00
10.00
12.00
4.97 4.81
5.26
4.34
4.94 5.02
5.67
8.35
6.11
9.57
Accounts Receivable Turnover Ratio
2018 2017 2016 2015 2014
Figure 6: Accounts Receivable Turnover Ratio
(Source: As created by Author)
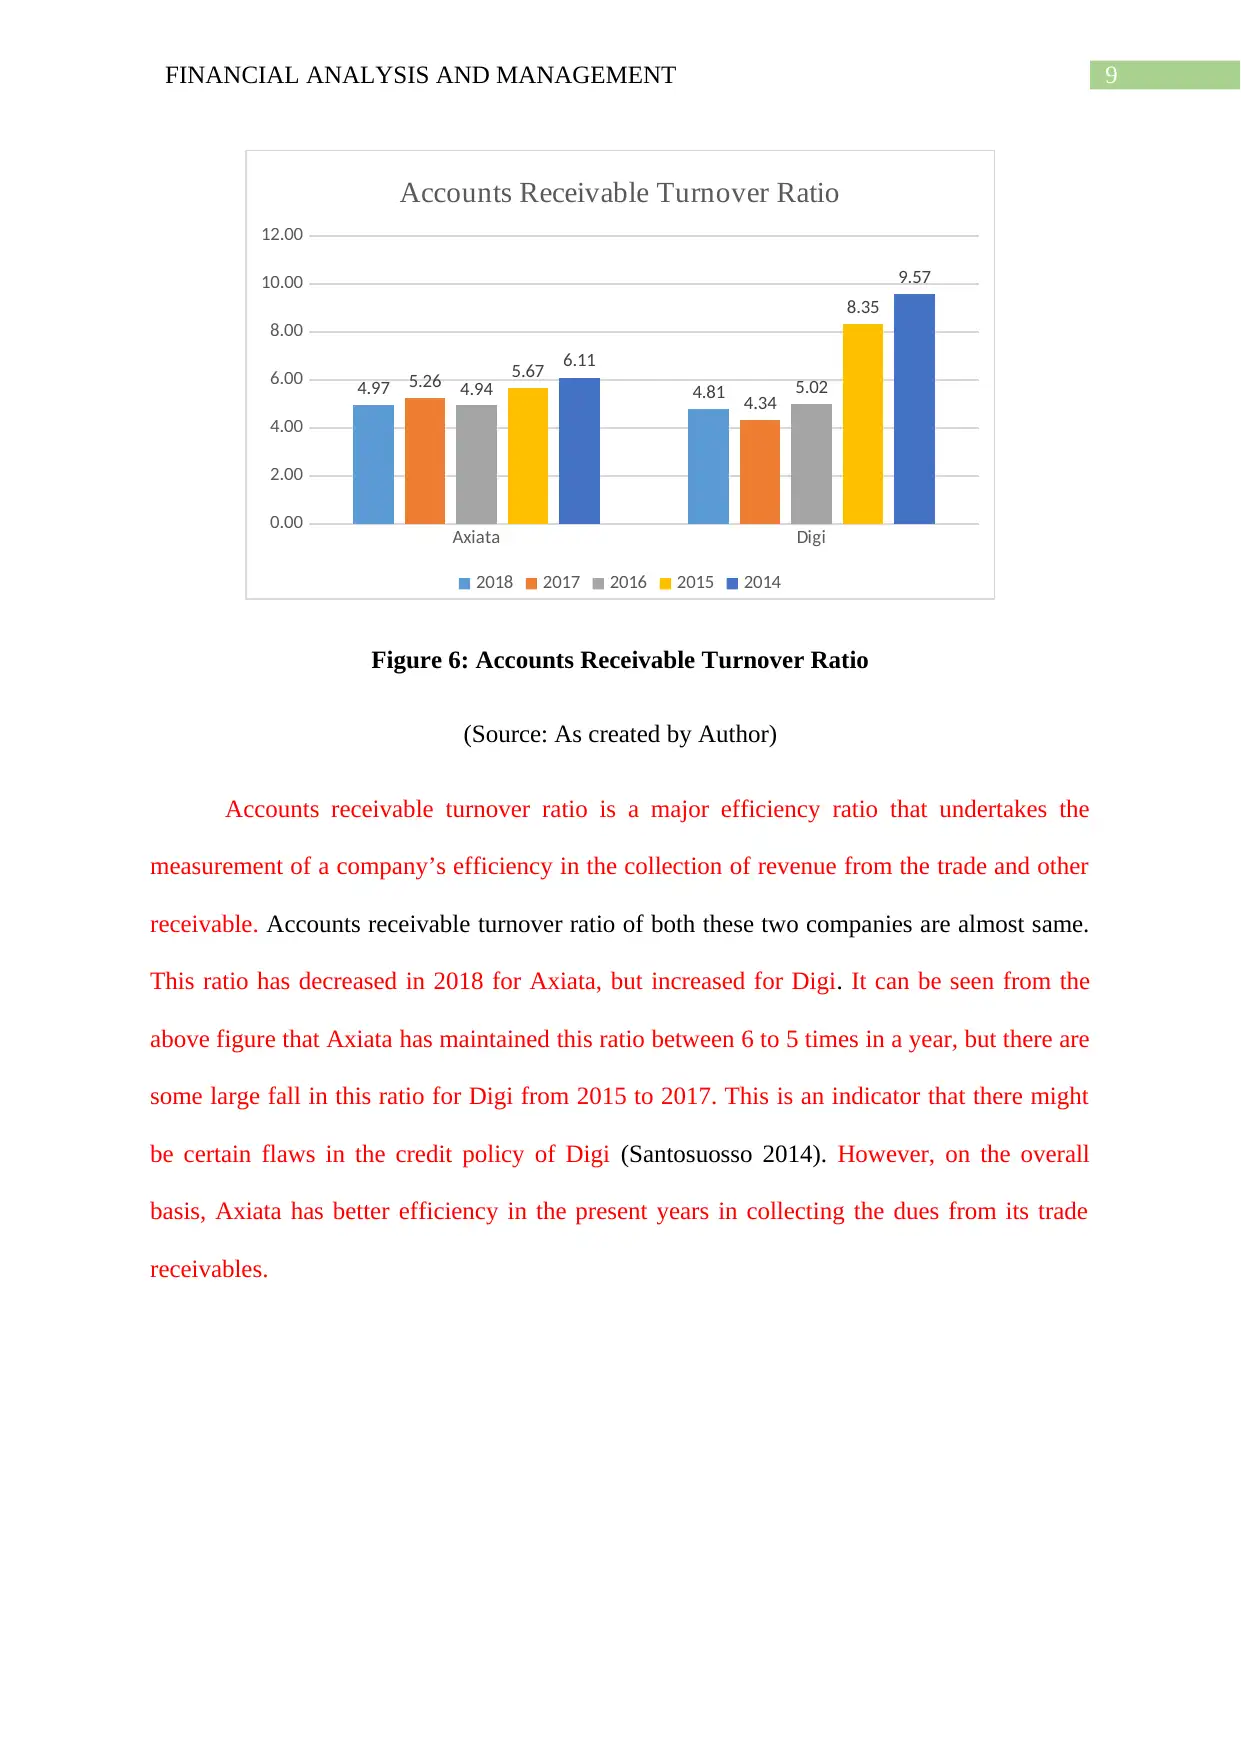
Accounts receivable turnover ratio is a major efficiency ratio that undertakes the
measurement of a company’s efficiency in the collection of revenue from the trade and other
receivable. Accounts receivable turnover ratio of both these two companies are almost same.
This ratio has decreased in 2018 for Axiata, but increased for Digi. It can be seen from the
above figure that Axiata has maintained this ratio between 6 to 5 times in a year, but there are
some large fall in this ratio for Digi from 2015 to 2017. This is an indicator that there might
be certain flaws in the credit policy of Digi (Santosuosso 2014). However, on the overall
basis, Axiata has better efficiency in the present years in collecting the dues from its trade
receivables.
Axiata Digi
0.00
2.00
4.00
6.00
8.00
10.00
12.00
4.97 4.81
5.26
4.34
4.94 5.02
5.67
8.35
6.11
9.57
Accounts Receivable Turnover Ratio
2018 2017 2016 2015 2014
Figure 6: Accounts Receivable Turnover Ratio
(Source: As created by Author)
Accounts receivable turnover ratio is a major efficiency ratio that undertakes the
measurement of a company’s efficiency in the collection of revenue from the trade and other
receivable. Accounts receivable turnover ratio of both these two companies are almost same.
This ratio has decreased in 2018 for Axiata, but increased for Digi. It can be seen from the
above figure that Axiata has maintained this ratio between 6 to 5 times in a year, but there are
some large fall in this ratio for Digi from 2015 to 2017. This is an indicator that there might
be certain flaws in the credit policy of Digi (Santosuosso 2014). However, on the overall
basis, Axiata has better efficiency in the present years in collecting the dues from its trade
receivables.
Paraphrase This Document
Need a fresh take? Get an instant paraphrase of this document with our AI Paraphraser
10FINANCIAL ANALYSIS AND MANAGEMENT
Capital Structure Ratios
Axiata Digi
0.00
2.00
4.00
6.00
8.00
10.00
12.00
2.33
8.22
1.59
10.24
1.79
9.59
1.29
7.98
1.28
5.27
Debt to Equity Ratio
2018 2017 2016 2015 2014
Figure 7: Debt-to-Equity Ratio
(Source: As created by Author)
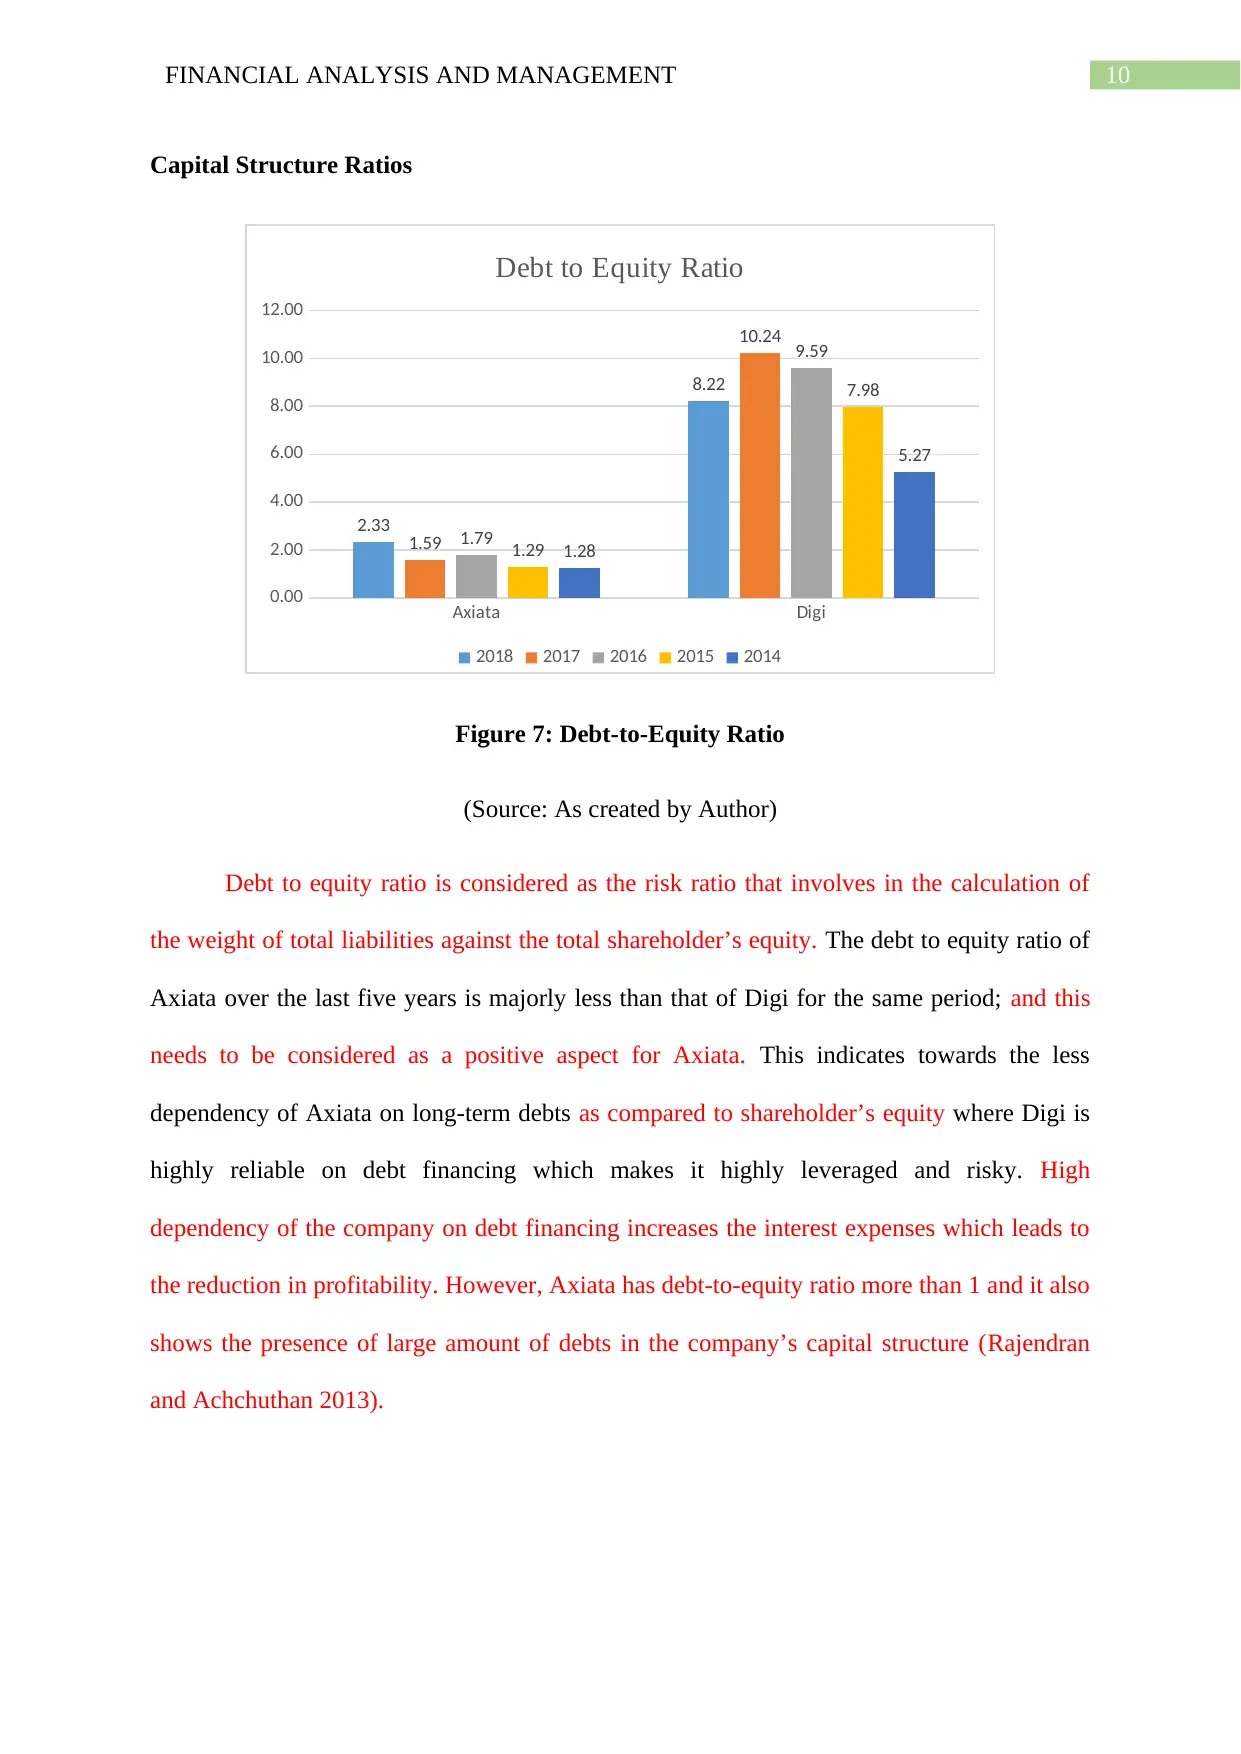
Debt to equity ratio is considered as the risk ratio that involves in the calculation of
the weight of total liabilities against the total shareholder’s equity. The debt to equity ratio of
Axiata over the last five years is majorly less than that of Digi for the same period; and this
needs to be considered as a positive aspect for Axiata. This indicates towards the less
dependency of Axiata on long-term debts as compared to shareholder’s equity where Digi is
highly reliable on debt financing which makes it highly leveraged and risky. High
dependency of the company on debt financing increases the interest expenses which leads to
the reduction in profitability. However, Axiata has debt-to-equity ratio more than 1 and it also
shows the presence of large amount of debts in the company’s capital structure (Rajendran
and Achchuthan 2013).
Capital Structure Ratios
Axiata Digi
0.00
2.00
4.00
6.00
8.00
10.00
12.00
2.33
8.22
1.59
10.24
1.79
9.59
1.29
7.98
1.28
5.27
Debt to Equity Ratio
2018 2017 2016 2015 2014
Figure 7: Debt-to-Equity Ratio
(Source: As created by Author)
Debt to equity ratio is considered as the risk ratio that involves in the calculation of
the weight of total liabilities against the total shareholder’s equity. The debt to equity ratio of
Axiata over the last five years is majorly less than that of Digi for the same period; and this
needs to be considered as a positive aspect for Axiata. This indicates towards the less
dependency of Axiata on long-term debts as compared to shareholder’s equity where Digi is
highly reliable on debt financing which makes it highly leveraged and risky. High
dependency of the company on debt financing increases the interest expenses which leads to
the reduction in profitability. However, Axiata has debt-to-equity ratio more than 1 and it also
shows the presence of large amount of debts in the company’s capital structure (Rajendran
and Achchuthan 2013).
11FINANCIAL ANALYSIS AND MANAGEMENT
Axiata Digi
0.00
0.10
0.20
0.30
0.40
0.50
0.60
0.70
0.80
0.90
1.00
0.64
0.89
0.56
0.91
0.60
0.91
0.54
0.89
0.54
0.84
Debt Ratio
2018 2017 2016 2015 2014
Figure 8: Debt Ratio
(Source: As created by Author)
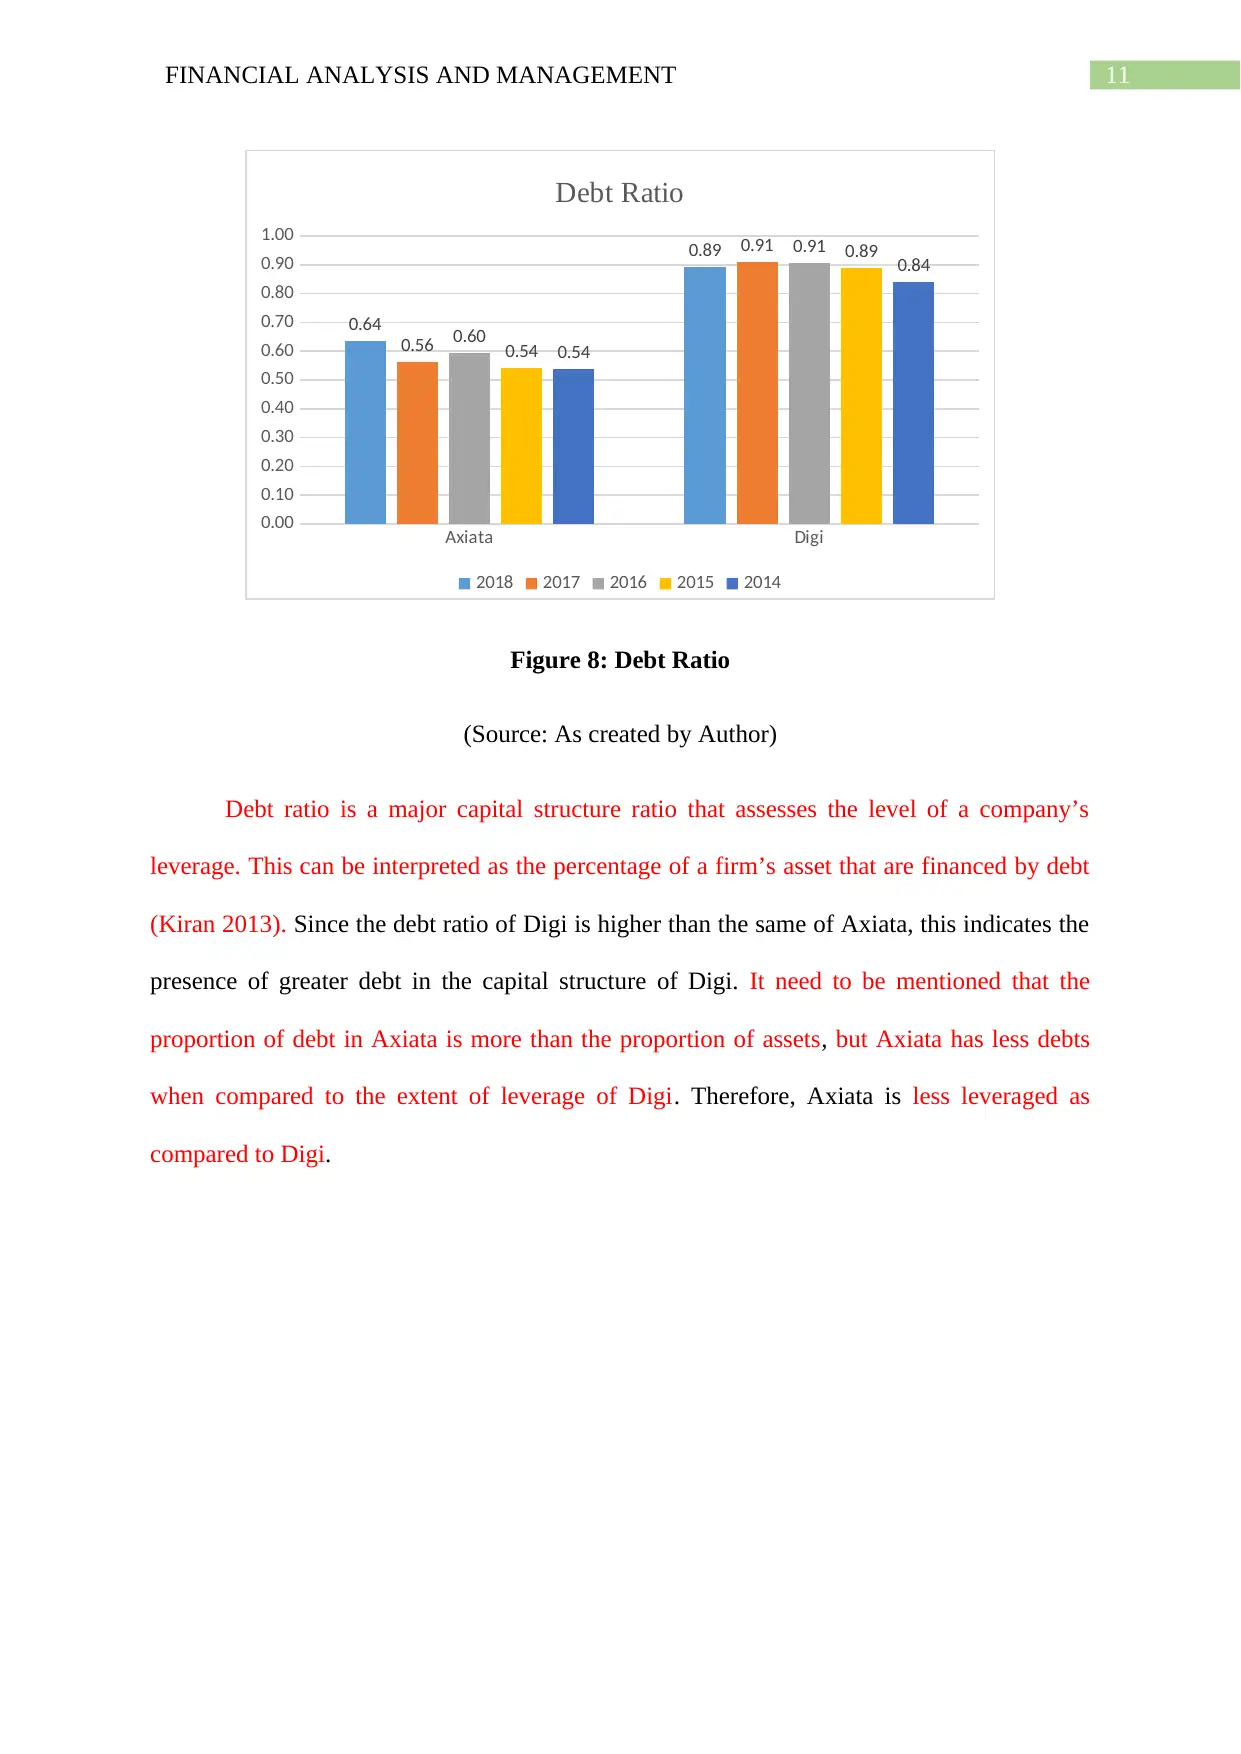
Debt ratio is a major capital structure ratio that assesses the level of a company’s
leverage. This can be interpreted as the percentage of a firm’s asset that are financed by debt
(Kiran 2013). Since the debt ratio of Digi is higher than the same of Axiata, this indicates the
presence of greater debt in the capital structure of Digi. It need to be mentioned that the
proportion of debt in Axiata is more than the proportion of assets, but Axiata has less debts
when compared to the extent of leverage of Digi. Therefore, Axiata is less leveraged as
compared to Digi.
Axiata Digi
0.00
0.10
0.20
0.30
0.40
0.50
0.60
0.70
0.80
0.90
1.00
0.64
0.89
0.56
0.91
0.60
0.91
0.54
0.89
0.54
0.84
Debt Ratio
2018 2017 2016 2015 2014
Figure 8: Debt Ratio
(Source: As created by Author)
Debt ratio is a major capital structure ratio that assesses the level of a company’s
leverage. This can be interpreted as the percentage of a firm’s asset that are financed by debt
(Kiran 2013). Since the debt ratio of Digi is higher than the same of Axiata, this indicates the
presence of greater debt in the capital structure of Digi. It need to be mentioned that the
proportion of debt in Axiata is more than the proportion of assets, but Axiata has less debts
when compared to the extent of leverage of Digi. Therefore, Axiata is less leveraged as
compared to Digi.
⊘ This is a preview!⊘
Do you want full access?
Subscribe today to unlock all pages.
Trusted by 1+ million students worldwide
1 out of 27
Related Documents


Your All-in-One AI-Powered Toolkit for Academic Success.
+13062052269
info@desklib.com
Available 24*7 on WhatsApp / Email
![[object Object]](/_next/static/media/star-bottom.7253800d.svg)
Unlock your academic potential
Copyright © 2020–2026 A2Z Services. All Rights Reserved. Developed and managed by ZUCOL.