Detailed Investment Project Evaluation Report for AYR Co. (Finance)
VerifiedAdded on 2023/04/23
|15
|4246
|205
Report
AI Summary
This report, prepared for the Board of Directors of AYR Co., evaluates two potential investment projects: Project Aspire and Project Wolf. The analysis employs capital budgeting techniques, including Net Present Value (NPV), Internal Rate of Return (IRR), and Payback Period, to determine the most viable option. The report also considers non-financial factors and discusses appropriate funding sources, analyzing the cost of capital and its impact on AYR Co.'s Weighted Average Cost of Capital (WACC). The findings suggest selecting Project Aspire based on its superior NPV and IRR compared to Project Wolf, while also acknowledging the limitations of each capital budgeting technique. Furthermore, the report delves into the aspects of debt and equity financing, detailing the costs associated with each and their implications on the company's financial structure. The report concludes with a recommendation for Project Aspire, supported by a thorough comparative analysis of the investment appraisal techniques used.
Prepared By
Student Name:
Date:
Executive Summary
This report is primarily drafted to cater the need of the Board
of Directors of the AYR Co. which is in the process of
making selection between two proposed investment options
named as Project Aspire and Project Wolf .In order to serve
this purpose both of the projects have been evaluated using
the various Capital budgeting techniques .Apart from
resorting to the capital budgeting techniques, an attempt has
been made to consider other factors while making our
suggestion to choose the specific project. As the investment
in the selected project demands the fund, hence making the
appropriate selection of fund and the consequent cost of such
fund and finally the impact on the WACC (cost of capital) of
the AYR co too have been analyzed in this report.
1
A Brief
Analysi
s of the
Evaluat
ion of
Investm
ent
options
Alongwi
th the
Sources
of
Funds
Paraphrase This Document
Need a fresh take? Get an instant paraphrase of this document with our AI Paraphraser
Table of Contents
Introduction...........................................................................................................................................4
Answer to Question No.1 [See Appendix 1]..........................................................................................5
Net Present Value..............................................................................................................................5
Internal rate of Return.......................................................................................................................5
Payback period..................................................................................................................................5
Discussion and Analysis of the investment project................................................................................7
Discussion on two factors of financing: AYR co.....................................................................................9
Conclusion...........................................................................................................................................12
Appendix -1.........................................................................................................................................12
References...........................................................................................................................................15
2
Introduction
The Board of AYR Co. is considering the option for the selection of the most suitable project
by making the evaluation of these investment proposals using three widely used capital
budgeting techniques like those of net present value, payback period and internal rate of
return. It further emphasizes on the fact that not only the financial but the non-financial
factors also play the major role in making such evaluation (Belton, 2017). The two project
options are the Project Aspire and the project Wolf with their distinct characteristics for
which our report also suggests the sources of the fund to be opted for making the investment
in the selected project. While making decision on the sources of funds the major
considerations kept in mind are the cost of the capital along with its overall impact on the
WACC of the selected Company. Our report covers both the practical as well as the
theoretical conceptual analysis of the Investment evaluation criteria. Further as it is often seen
that the financial factors play major role in making such investment decision, but non-
financial factors too have their own role to play in this regard, hence the detailed discussion
on the same has been made too (Bromwich & Scapens, 2016).
3
⊘ This is a preview!⊘
Do you want full access?
Subscribe today to unlock all pages.
Trusted by 1+ million students worldwide
Answer to Question No.1 [See Appendix 1]
In the following section an attempt has been made to have a brief inside about the concepts of
the Net Present value, internal rate of return and the payback period. Capital budgeting are
the long term precious decisions as they demand high volume of investment. Hence if the
decision taken is wrong then t might prove to be too costly for the company in terms of its
loss of time and money both (Alexander, 2016).
Net Present Value
In this technique the all the cash inflows generated by the project during its tenure are
discounted using a suitable discounting factor and then all the cash outflows are deducted
from the inflow streams. The same rate of discount is being applied uniformly throughout the
calculation. If this difference is either positive or zero then it is recommended for the
selection of the project otherwise the project is not considered worthy enough to be
undertaken (Choy, 2018). The present value of the future cash inflows are calculated using
appropriate discounting rate. Net present value method is easy to use provided the
discounting rate is chosen appropriately. Again it depends the correct estimation of the future
cash inflows too. But such estimation is not so easy too.
4
Paraphrase This Document
Need a fresh take? Get an instant paraphrase of this document with our AI Paraphraser
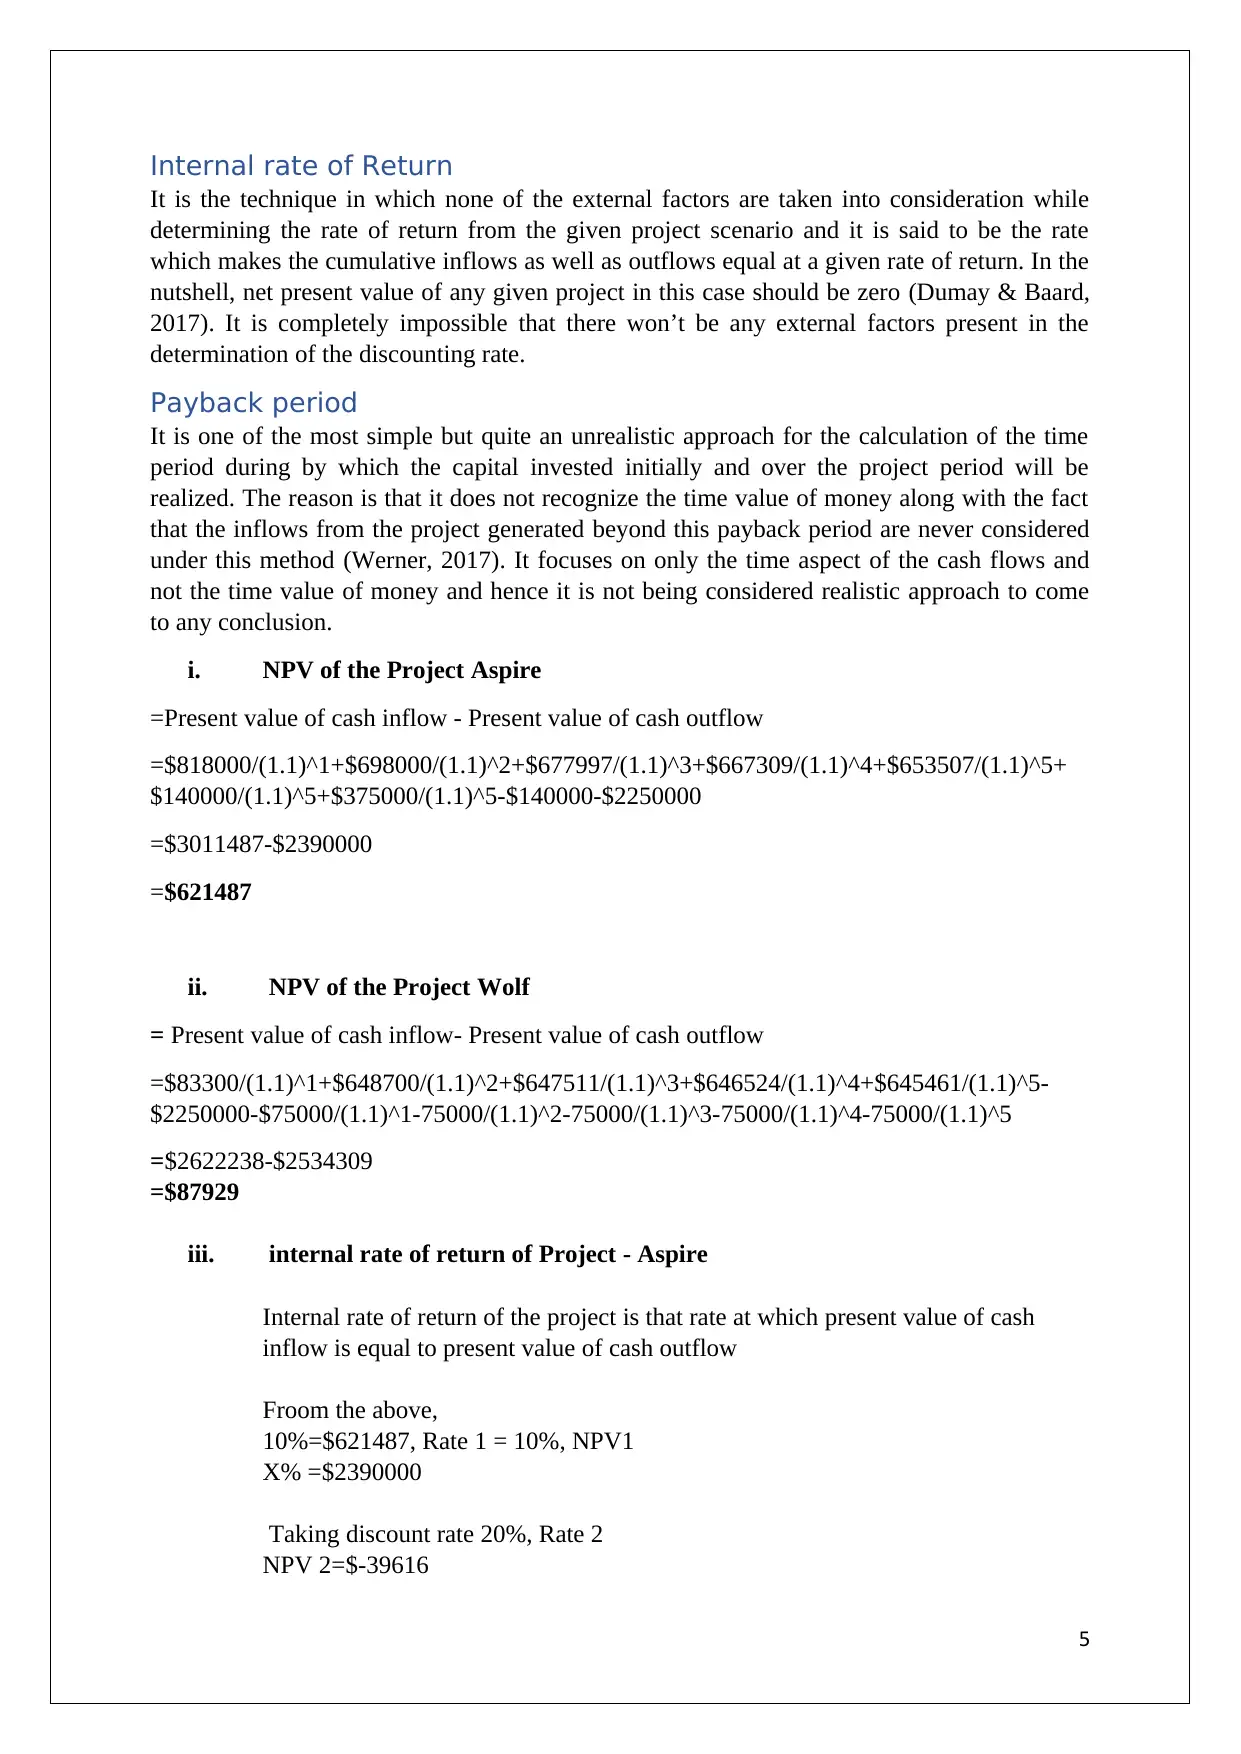
Internal rate of Return
It is the technique in which none of the external factors are taken into consideration while
determining the rate of return from the given project scenario and it is said to be the rate
which makes the cumulative inflows as well as outflows equal at a given rate of return. In the
nutshell, net present value of any given project in this case should be zero (Dumay & Baard,
2017). It is completely impossible that there won’t be any external factors present in the
determination of the discounting rate.
Payback period
It is one of the most simple but quite an unrealistic approach for the calculation of the time
period during by which the capital invested initially and over the project period will be
realized. The reason is that it does not recognize the time value of money along with the fact
that the inflows from the project generated beyond this payback period are never considered
under this method (Werner, 2017). It focuses on only the time aspect of the cash flows and
not the time value of money and hence it is not being considered realistic approach to come
to any conclusion.
i. NPV of the Project Aspire
=Present value of cash inflow - Present value of cash outflow
=$818000/(1.1)^1+$698000/(1.1)^2+$677997/(1.1)^3+$667309/(1.1)^4+$653507/(1.1)^5+
$140000/(1.1)^5+$375000/(1.1)^5-$140000-$2250000
=$3011487-$2390000
=$621487
ii. NPV of the Project Wolf
= Present value of cash inflow- Present value of cash outflow
=$83300/(1.1)^1+$648700/(1.1)^2+$647511/(1.1)^3+$646524/(1.1)^4+$645461/(1.1)^5-
$2250000-$75000/(1.1)^1-75000/(1.1)^2-75000/(1.1)^3-75000/(1.1)^4-75000/(1.1)^5
=$2622238-$2534309
=$87929
iii. internal rate of return of Project - Aspire
Internal rate of return of the project is that rate at which present value of cash
inflow is equal to present value of cash outflow
Froom the above,
10%=$621487, Rate 1 = 10%, NPV1
X% =$2390000
Taking discount rate 20%, Rate 2
NPV 2=$-39616
5
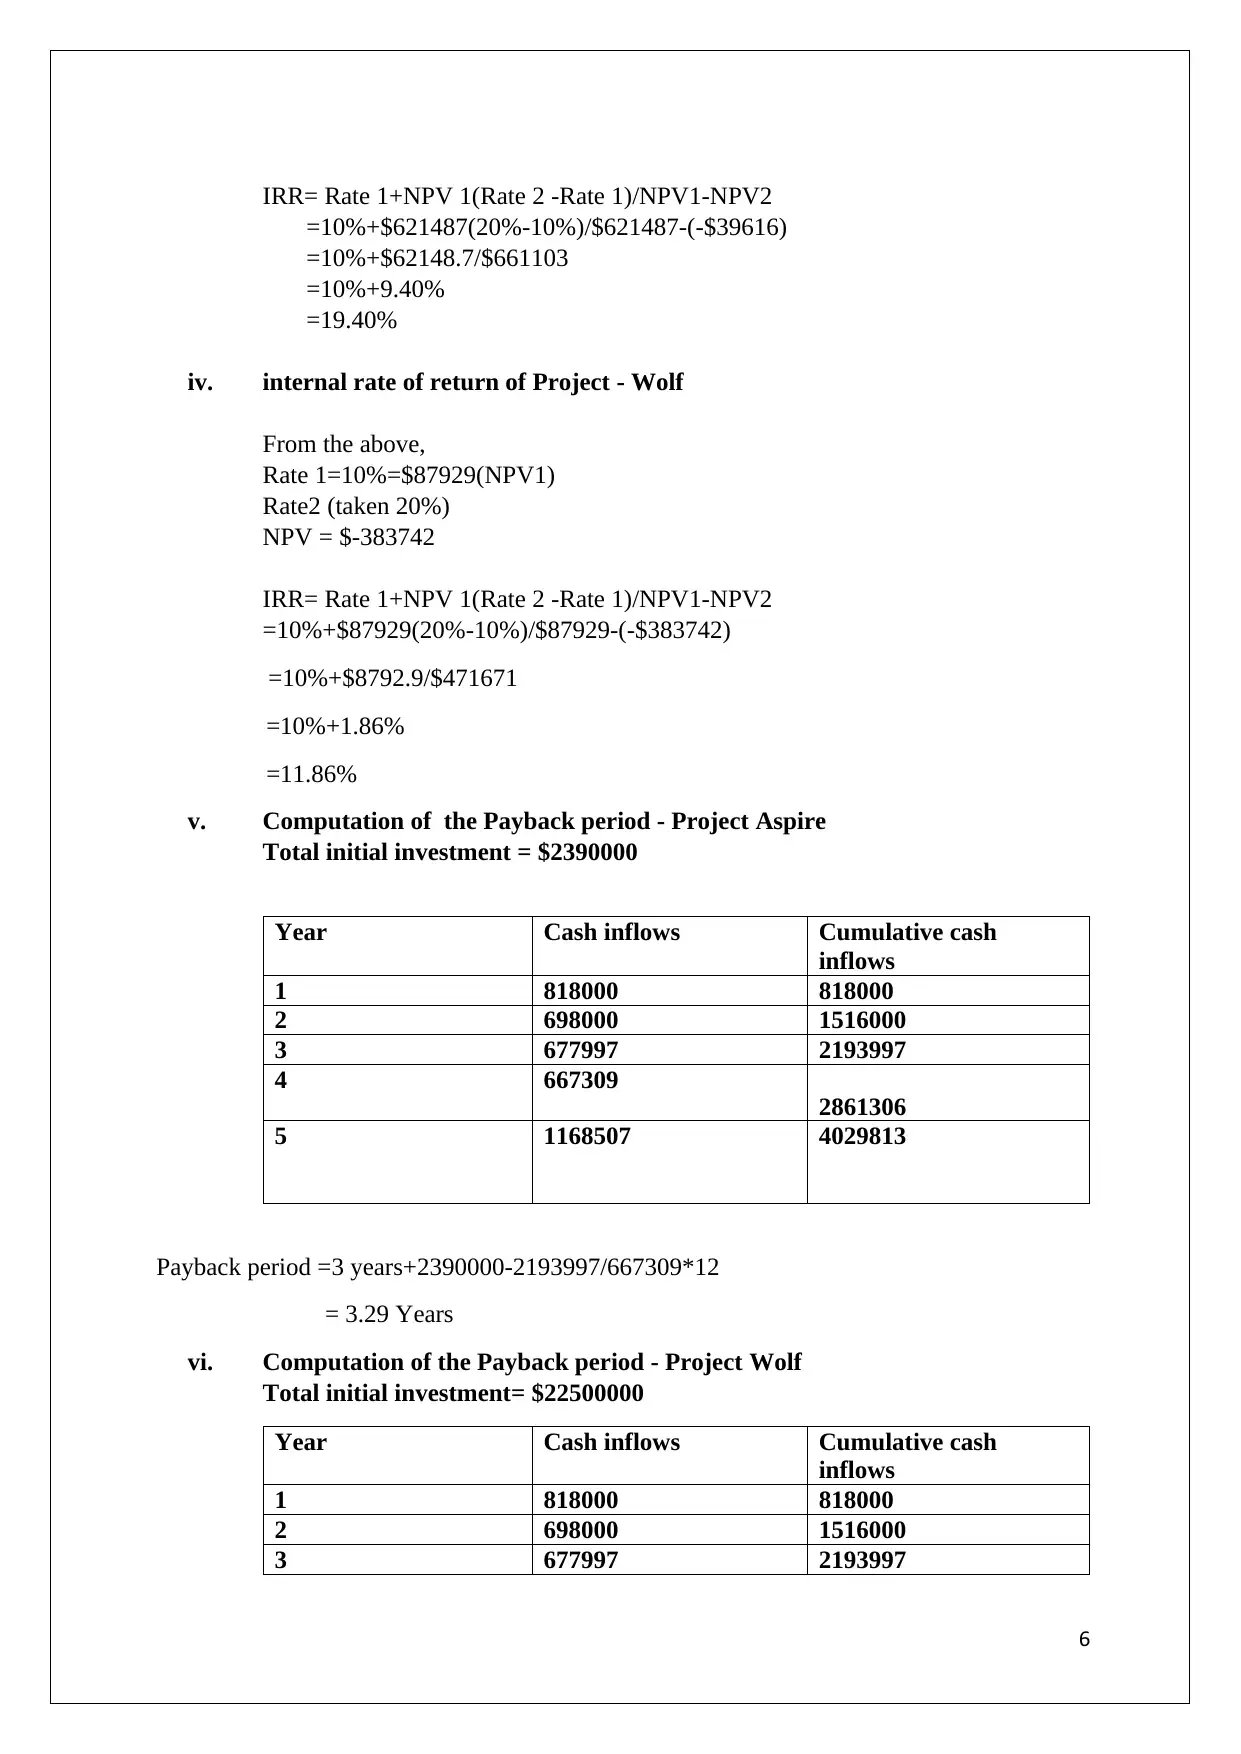
IRR= Rate 1+NPV 1(Rate 2 -Rate 1)/NPV1-NPV2
=10%+$621487(20%-10%)/$621487-(-$39616)
=10%+$62148.7/$661103
=10%+9.40%
=19.40%
iv. internal rate of return of Project - Wolf
From the above,
Rate 1=10%=$87929(NPV1)
Rate2 (taken 20%)
NPV = $-383742
IRR= Rate 1+NPV 1(Rate 2 -Rate 1)/NPV1-NPV2
=10%+$87929(20%-10%)/$87929-(-$383742)
=10%+$8792.9/$471671
=10%+1.86%
=11.86%
v. Computation of the Payback period - Project Aspire
Total initial investment = $2390000
Year Cash inflows Cumulative cash
inflows
1 818000 818000
2 698000 1516000
3 677997 2193997
4 667309
2861306
5 1168507 4029813
Payback period =3 years+2390000-2193997/667309*12
= 3.29 Years
vi. Computation of the Payback period - Project Wolf
Total initial investment= $22500000
Year Cash inflows Cumulative cash
inflows
1 818000 818000
2 698000 1516000
3 677997 2193997
6
⊘ This is a preview!⊘
Do you want full access?
Subscribe today to unlock all pages.
Trusted by 1+ million students worldwide
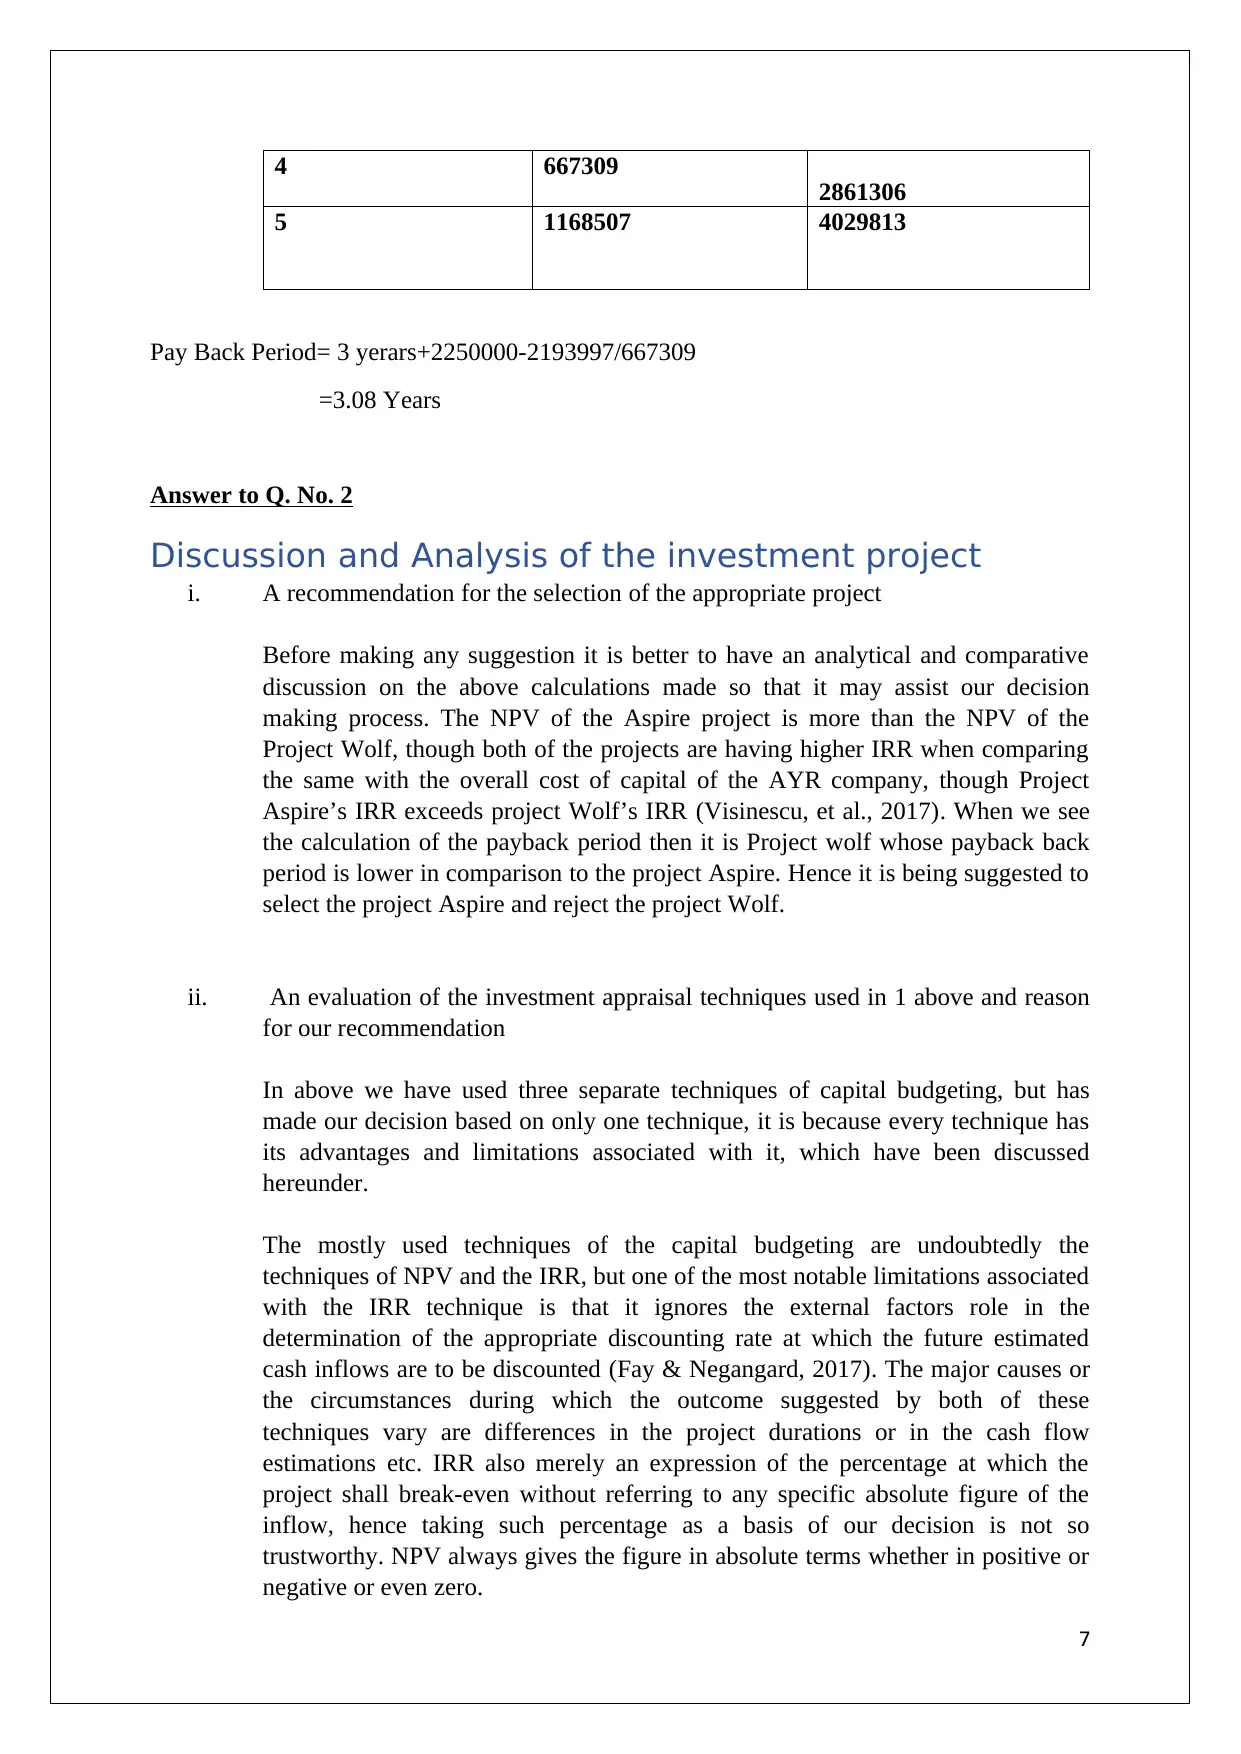
4 667309
2861306
5 1168507 4029813
Pay Back Period= 3 yerars+2250000-2193997/667309
=3.08 Years
Answer to Q. No. 2
Discussion and Analysis of the investment project
i. A recommendation for the selection of the appropriate project
Before making any suggestion it is better to have an analytical and comparative
discussion on the above calculations made so that it may assist our decision
making process. The NPV of the Aspire project is more than the NPV of the
Project Wolf, though both of the projects are having higher IRR when comparing
the same with the overall cost of capital of the AYR company, though Project
Aspire’s IRR exceeds project Wolf’s IRR (Visinescu, et al., 2017). When we see
the calculation of the payback period then it is Project wolf whose payback back
period is lower in comparison to the project Aspire. Hence it is being suggested to
select the project Aspire and reject the project Wolf.
ii. An evaluation of the investment appraisal techniques used in 1 above and reason
for our recommendation
In above we have used three separate techniques of capital budgeting, but has
made our decision based on only one technique, it is because every technique has
its advantages and limitations associated with it, which have been discussed
hereunder.
The mostly used techniques of the capital budgeting are undoubtedly the
techniques of NPV and the IRR, but one of the most notable limitations associated
with the IRR technique is that it ignores the external factors role in the
determination of the appropriate discounting rate at which the future estimated
cash inflows are to be discounted (Fay & Negangard, 2017). The major causes or
the circumstances during which the outcome suggested by both of these
techniques vary are differences in the project durations or in the cash flow
estimations etc. IRR also merely an expression of the percentage at which the
project shall break-even without referring to any specific absolute figure of the
inflow, hence taking such percentage as a basis of our decision is not so
trustworthy. NPV always gives the figure in absolute terms whether in positive or
negative or even zero.
7
Paraphrase This Document
Need a fresh take? Get an instant paraphrase of this document with our AI Paraphraser
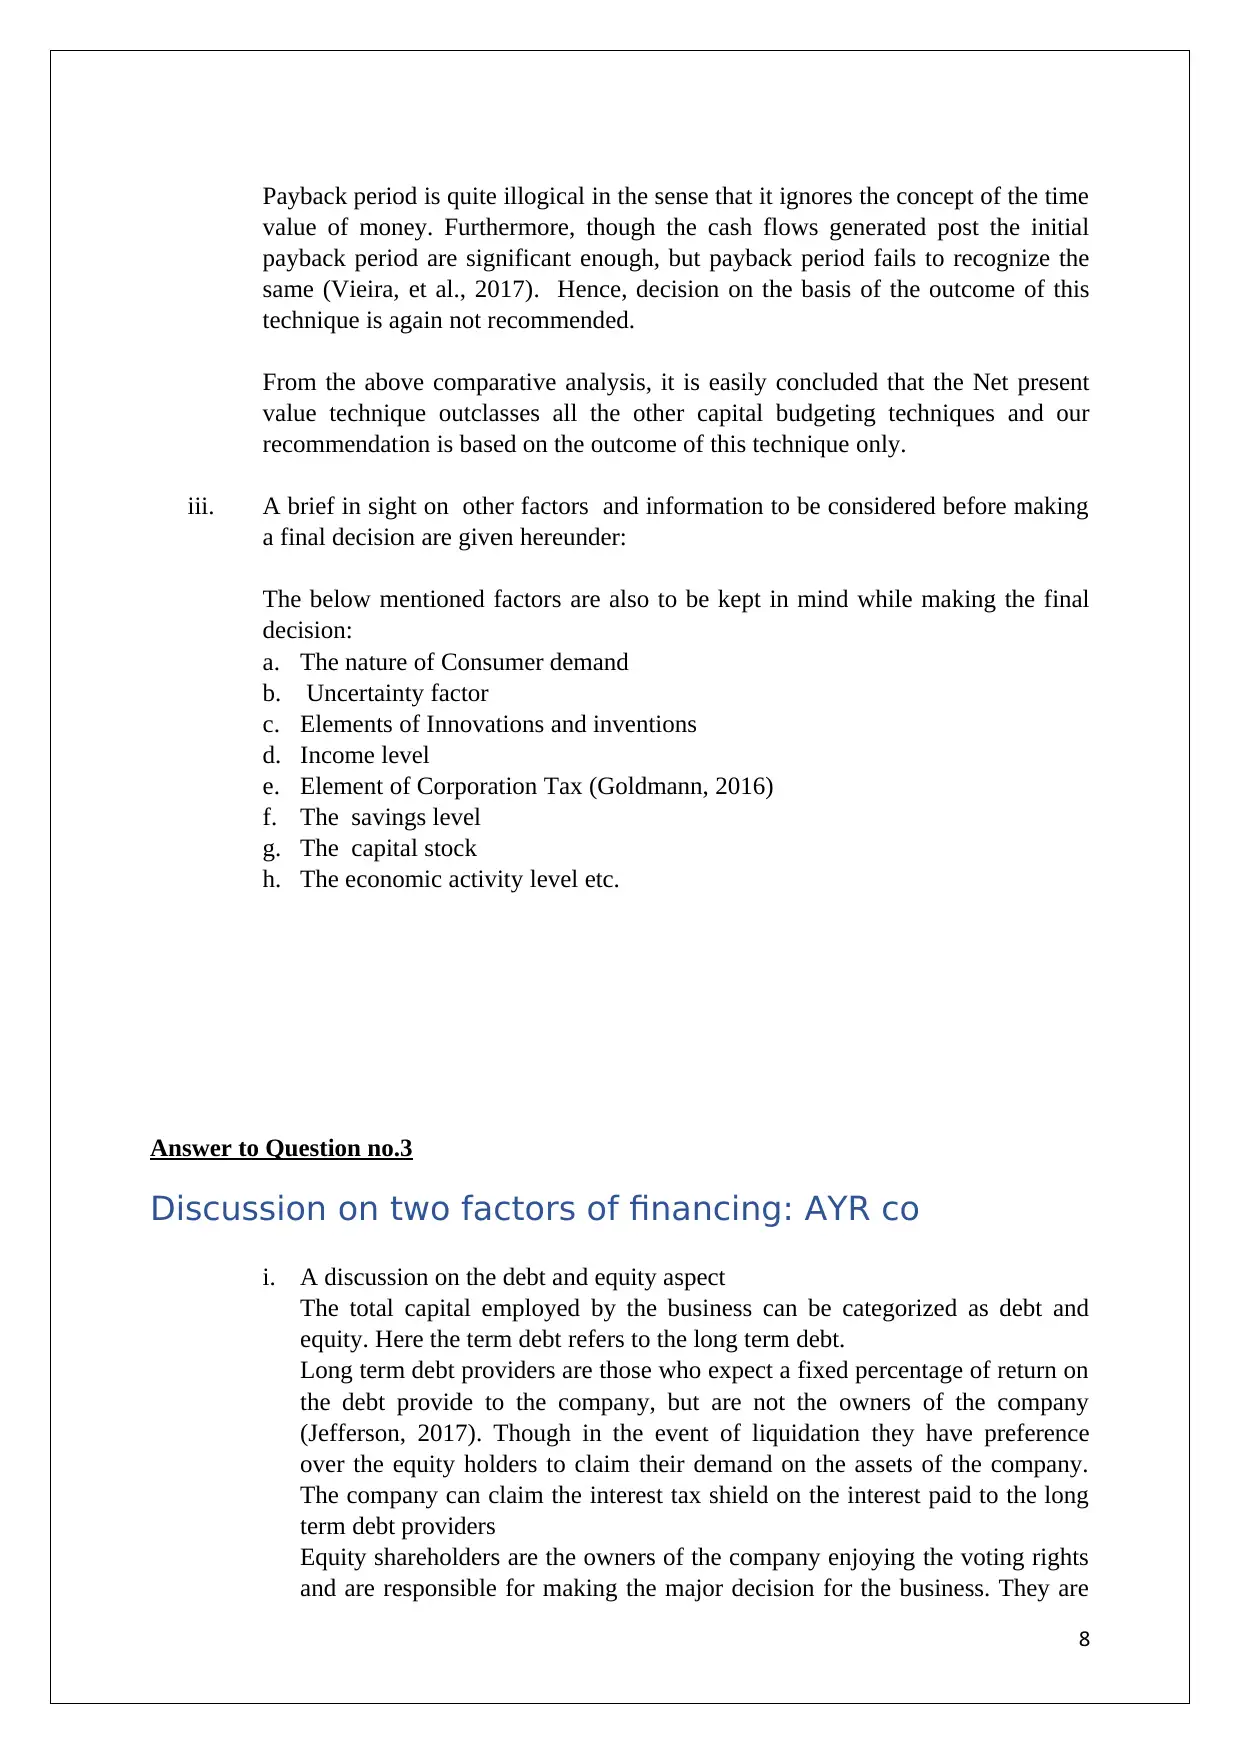
Payback period is quite illogical in the sense that it ignores the concept of the time
value of money. Furthermore, though the cash flows generated post the initial
payback period are significant enough, but payback period fails to recognize the
same (Vieira, et al., 2017). Hence, decision on the basis of the outcome of this
technique is again not recommended.
From the above comparative analysis, it is easily concluded that the Net present
value technique outclasses all the other capital budgeting techniques and our
recommendation is based on the outcome of this technique only.
iii. A brief in sight on other factors and information to be considered before making
a final decision are given hereunder:
The below mentioned factors are also to be kept in mind while making the final
decision:
a. The nature of Consumer demand
b. Uncertainty factor
c. Elements of Innovations and inventions
d. Income level
e. Element of Corporation Tax (Goldmann, 2016)
f. The savings level
g. The capital stock
h. The economic activity level etc.
Answer to Question no.3
Discussion on two factors of financing: AYR co
i. A discussion on the debt and equity aspect
The total capital employed by the business can be categorized as debt and
equity. Here the term debt refers to the long term debt.
Long term debt providers are those who expect a fixed percentage of return on
the debt provide to the company, but are not the owners of the company
(Jefferson, 2017). Though in the event of liquidation they have preference
over the equity holders to claim their demand on the assets of the company.
The company can claim the interest tax shield on the interest paid to the long
term debt providers
Equity shareholders are the owners of the company enjoying the voting rights
and are responsible for making the major decision for the business. They are
8
entitled to the share of the profit or loss earned by the company, hence can be
said that they are the highest risk takers. They get the dividend in terms of the
share of profit, but the same is not deductible expenses in terms of tax
provision.
Hence though the debts may seem to be cheaper source of fund than equity,
but there is always the risk associated with the company for being bankrupt if
the debt equity ratio exceeds the optimum level (Heminway, 2017).
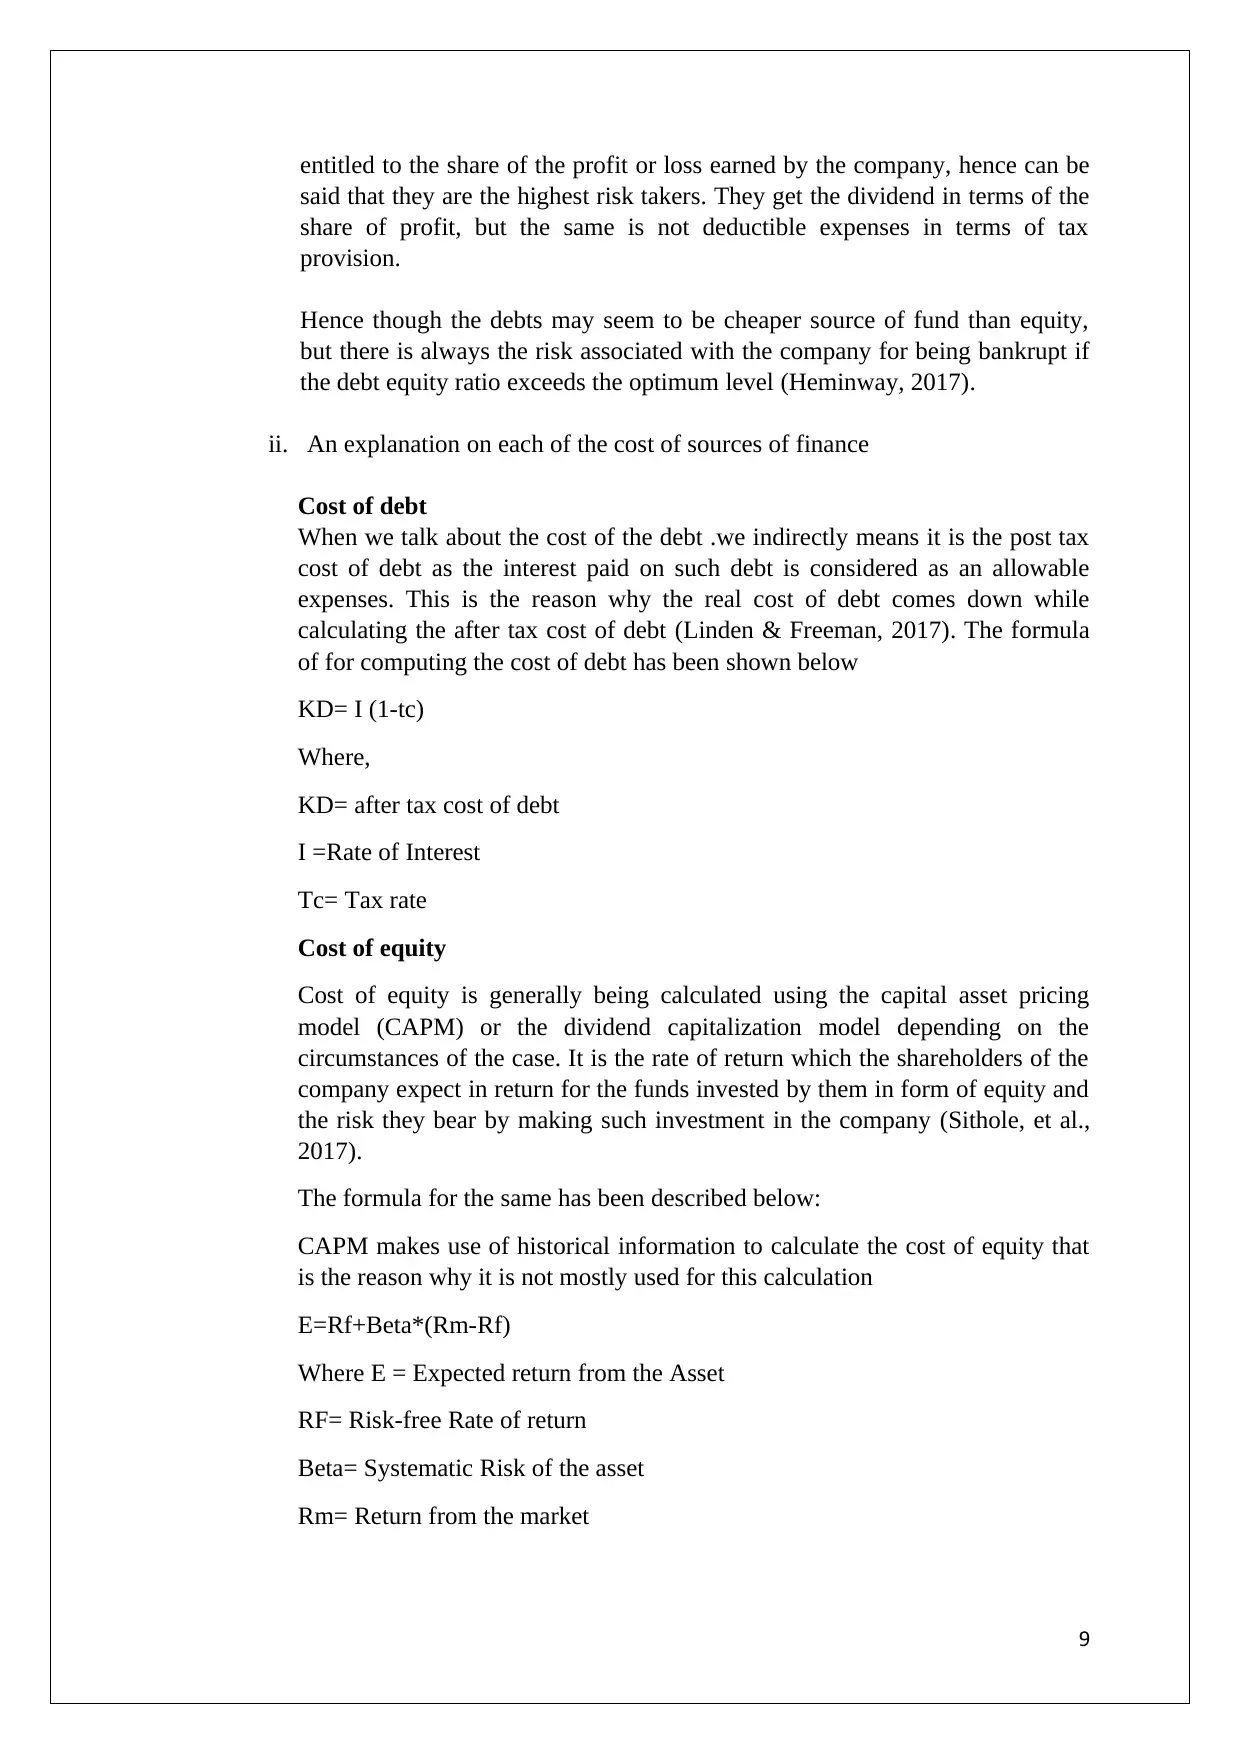
ii. An explanation on each of the cost of sources of finance
Cost of debt
When we talk about the cost of the debt .we indirectly means it is the post tax
cost of debt as the interest paid on such debt is considered as an allowable
expenses. This is the reason why the real cost of debt comes down while
calculating the after tax cost of debt (Linden & Freeman, 2017). The formula
of for computing the cost of debt has been shown below
KD= I (1-tc)
Where,
KD= after tax cost of debt
I =Rate of Interest
Tc= Tax rate
Cost of equity
Cost of equity is generally being calculated using the capital asset pricing
model (CAPM) or the dividend capitalization model depending on the
circumstances of the case. It is the rate of return which the shareholders of the
company expect in return for the funds invested by them in form of equity and
the risk they bear by making such investment in the company (Sithole, et al.,
2017).
The formula for the same has been described below:
CAPM makes use of historical information to calculate the cost of equity that
is the reason why it is not mostly used for this calculation
E=Rf+Beta*(Rm-Rf)
Where E = Expected return from the Asset
RF= Risk-free Rate of return
Beta= Systematic Risk of the asset
Rm= Return from the market
9
said that they are the highest risk takers. They get the dividend in terms of the
share of profit, but the same is not deductible expenses in terms of tax
provision.
Hence though the debts may seem to be cheaper source of fund than equity,
but there is always the risk associated with the company for being bankrupt if
the debt equity ratio exceeds the optimum level (Heminway, 2017).
ii. An explanation on each of the cost of sources of finance
Cost of debt
When we talk about the cost of the debt .we indirectly means it is the post tax
cost of debt as the interest paid on such debt is considered as an allowable
expenses. This is the reason why the real cost of debt comes down while
calculating the after tax cost of debt (Linden & Freeman, 2017). The formula
of for computing the cost of debt has been shown below
KD= I (1-tc)
Where,
KD= after tax cost of debt
I =Rate of Interest
Tc= Tax rate
Cost of equity
Cost of equity is generally being calculated using the capital asset pricing
model (CAPM) or the dividend capitalization model depending on the
circumstances of the case. It is the rate of return which the shareholders of the
company expect in return for the funds invested by them in form of equity and
the risk they bear by making such investment in the company (Sithole, et al.,
2017).
The formula for the same has been described below:
CAPM makes use of historical information to calculate the cost of equity that
is the reason why it is not mostly used for this calculation
E=Rf+Beta*(Rm-Rf)
Where E = Expected return from the Asset
RF= Risk-free Rate of return
Beta= Systematic Risk of the asset
Rm= Return from the market
9
⊘ This is a preview!⊘
Do you want full access?
Subscribe today to unlock all pages.
Trusted by 1+ million students worldwide
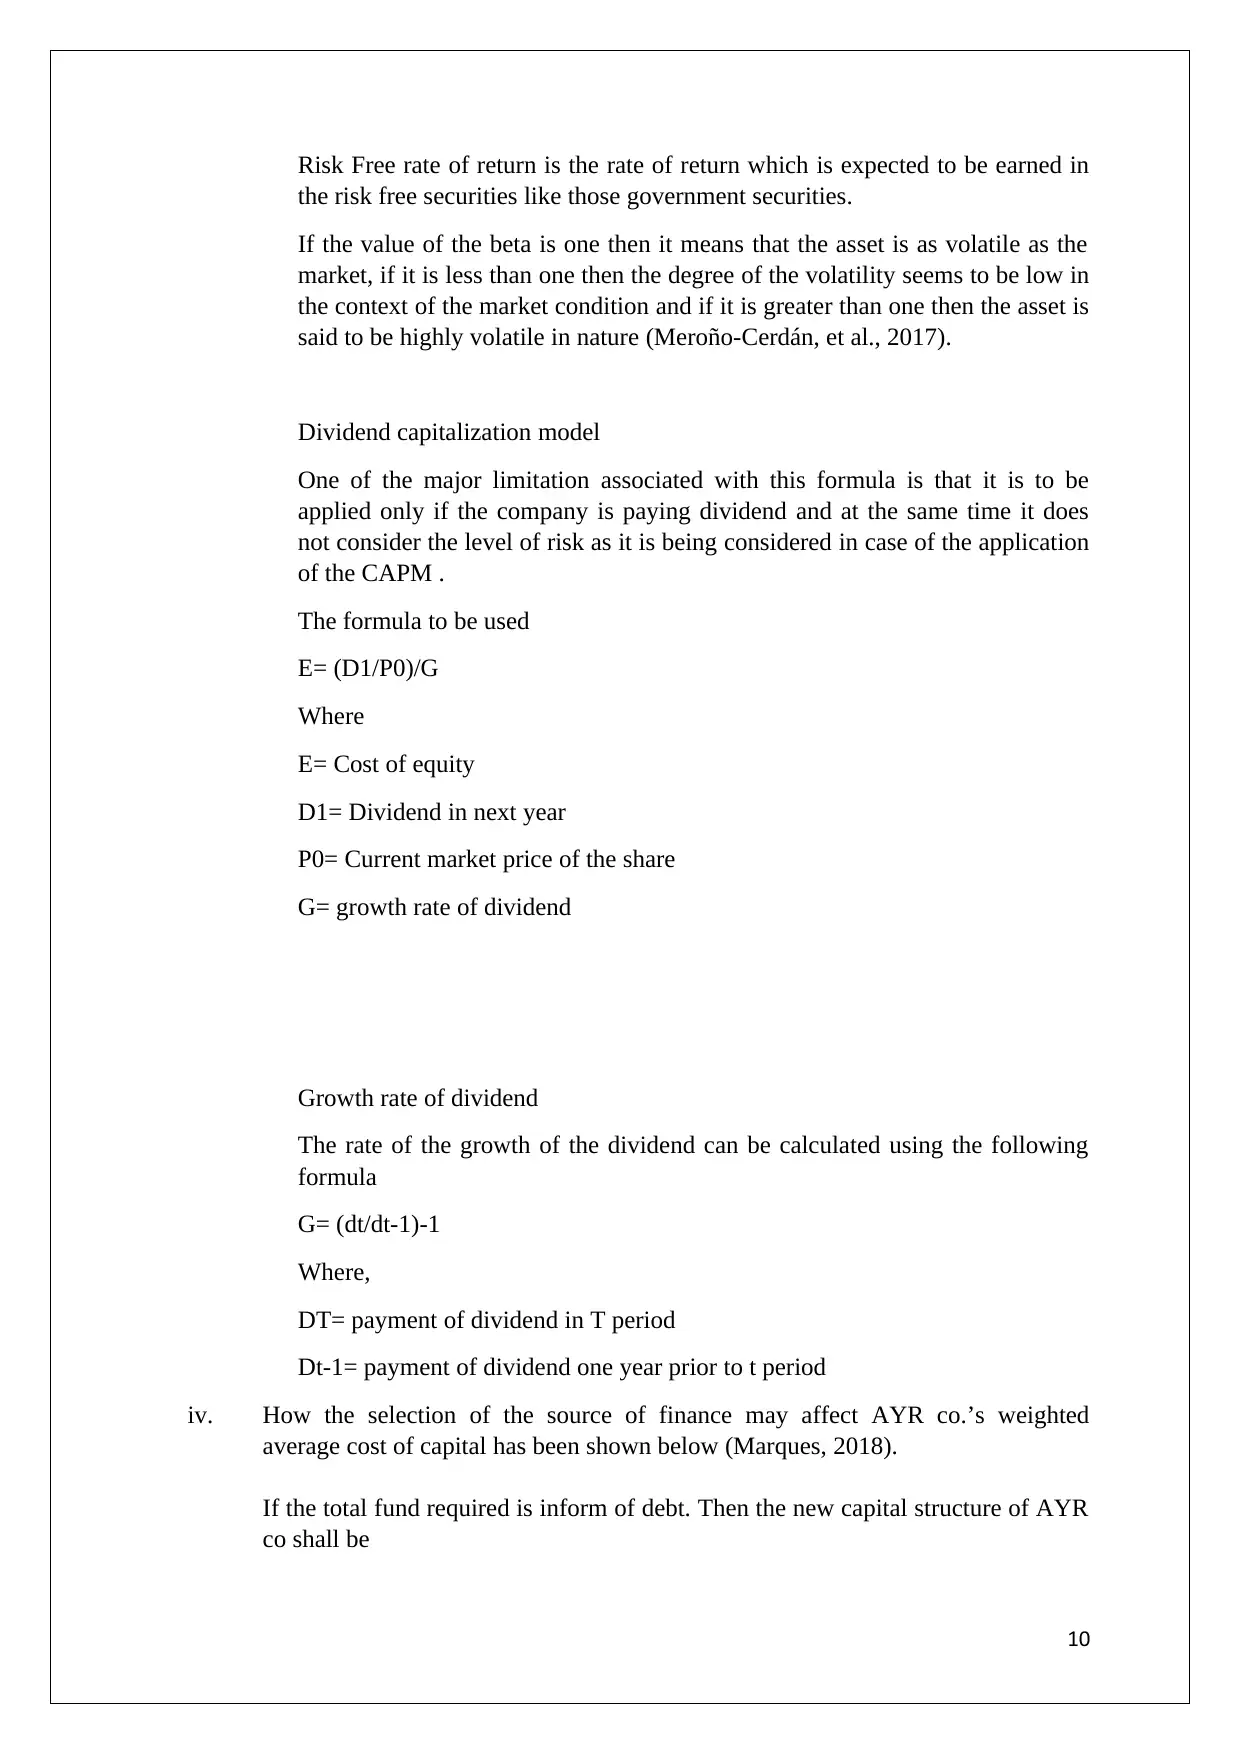
Risk Free rate of return is the rate of return which is expected to be earned in
the risk free securities like those government securities.
If the value of the beta is one then it means that the asset is as volatile as the
market, if it is less than one then the degree of the volatility seems to be low in
the context of the market condition and if it is greater than one then the asset is
said to be highly volatile in nature (Meroño-Cerdán, et al., 2017).
Dividend capitalization model
One of the major limitation associated with this formula is that it is to be
applied only if the company is paying dividend and at the same time it does
not consider the level of risk as it is being considered in case of the application
of the CAPM .
The formula to be used
E= (D1/P0)/G
Where
E= Cost of equity
D1= Dividend in next year
P0= Current market price of the share
G= growth rate of dividend
Growth rate of dividend
The rate of the growth of the dividend can be calculated using the following
formula
G= (dt/dt-1)-1
Where,
DT= payment of dividend in T period
Dt-1= payment of dividend one year prior to t period
iv. How the selection of the source of finance may affect AYR co.’s weighted
average cost of capital has been shown below (Marques, 2018).
If the total fund required is inform of debt. Then the new capital structure of AYR
co shall be
10
Paraphrase This Document
Need a fresh take? Get an instant paraphrase of this document with our AI Paraphraser
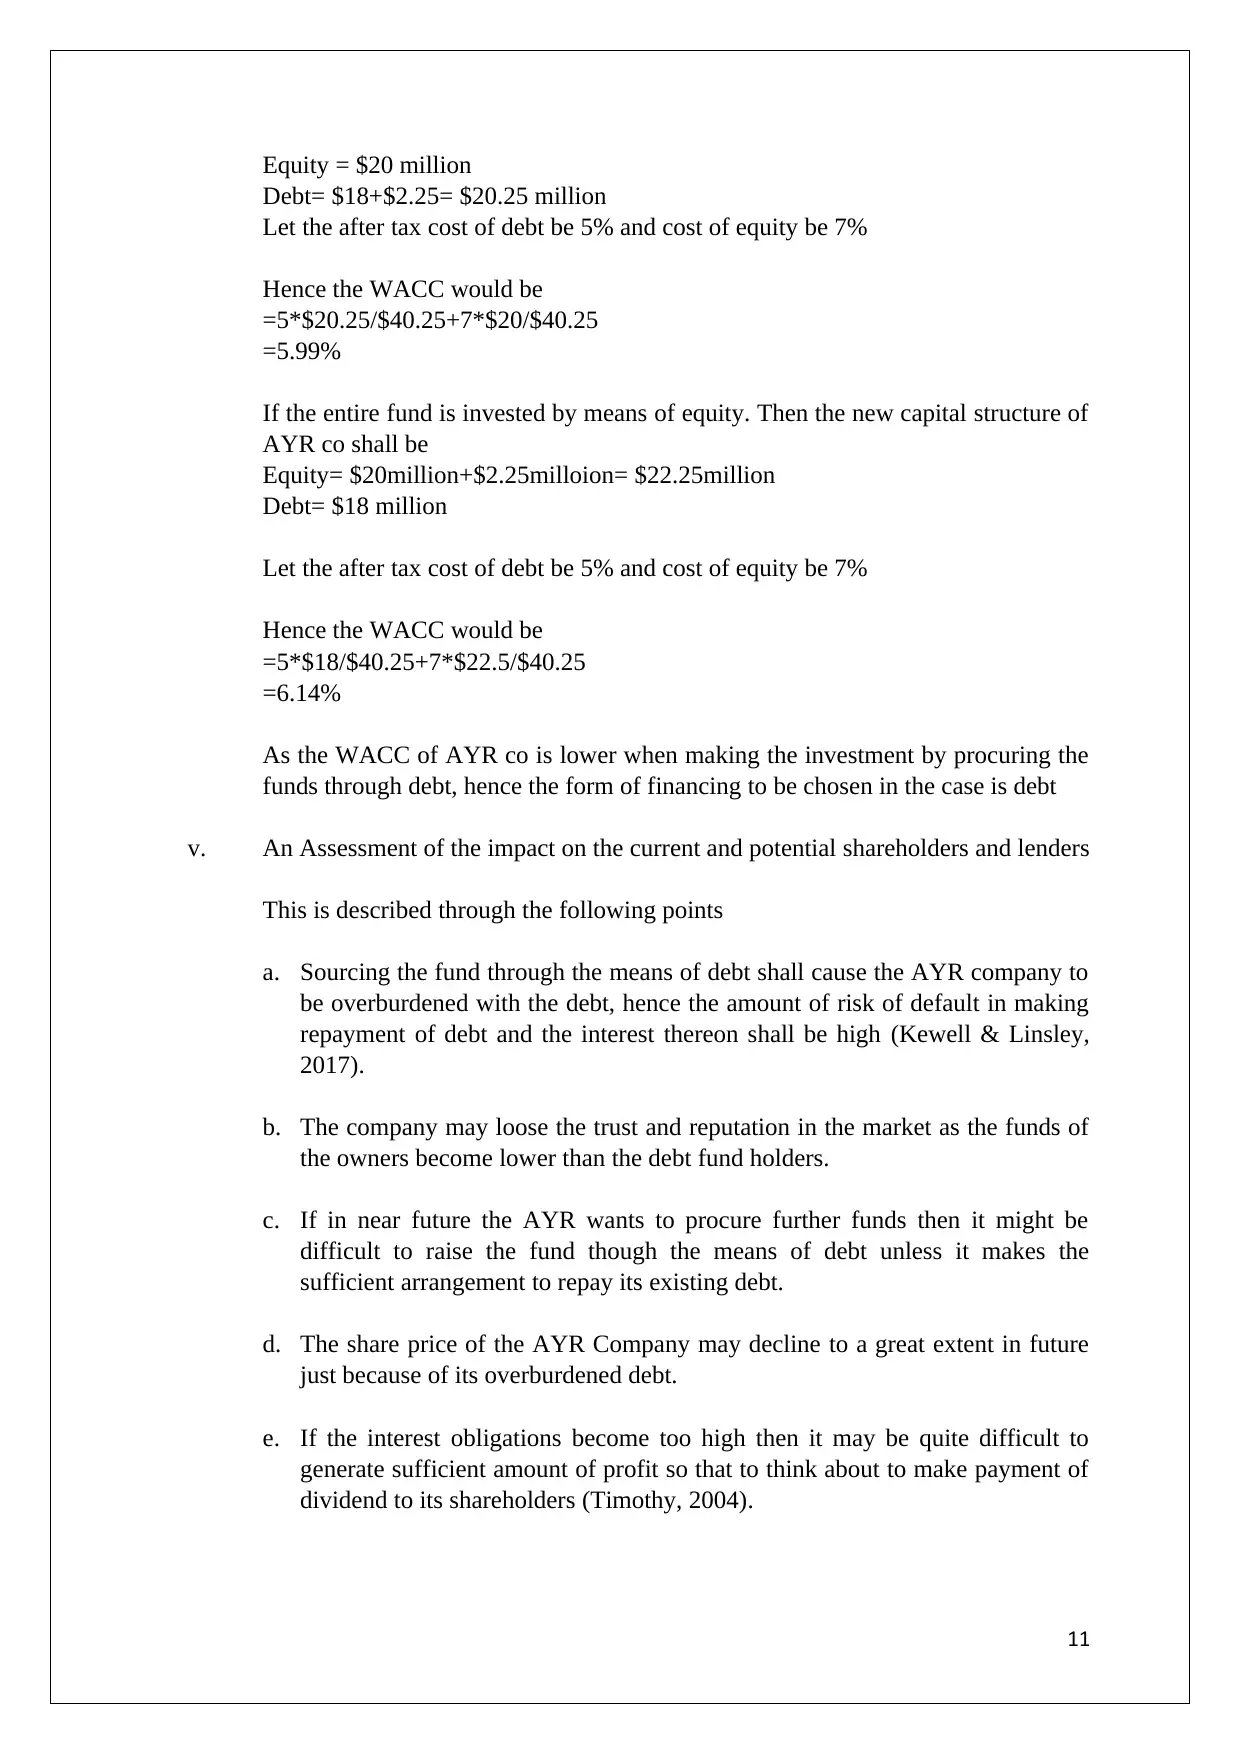
Equity = $20 million
Debt= $18+$2.25= $20.25 million
Let the after tax cost of debt be 5% and cost of equity be 7%
Hence the WACC would be
=5*$20.25/$40.25+7*$20/$40.25
=5.99%
If the entire fund is invested by means of equity. Then the new capital structure of
AYR co shall be
Equity= $20million+$2.25milloion= $22.25million
Debt= $18 million
Let the after tax cost of debt be 5% and cost of equity be 7%
Hence the WACC would be
=5*$18/$40.25+7*$22.5/$40.25
=6.14%
As the WACC of AYR co is lower when making the investment by procuring the
funds through debt, hence the form of financing to be chosen in the case is debt
v. An Assessment of the impact on the current and potential shareholders and lenders
This is described through the following points
a. Sourcing the fund through the means of debt shall cause the AYR company to
be overburdened with the debt, hence the amount of risk of default in making
repayment of debt and the interest thereon shall be high (Kewell & Linsley,
2017).
b. The company may loose the trust and reputation in the market as the funds of
the owners become lower than the debt fund holders.
c. If in near future the AYR wants to procure further funds then it might be
difficult to raise the fund though the means of debt unless it makes the
sufficient arrangement to repay its existing debt.
d. The share price of the AYR Company may decline to a great extent in future
just because of its overburdened debt.
e. If the interest obligations become too high then it may be quite difficult to
generate sufficient amount of profit so that to think about to make payment of
dividend to its shareholders (Timothy, 2004).
11
f. There shall be more pressure on the shareholders of the company in terms of
generating sufficient amount of revenue.
Conclusion
On the basis of the above critical discussion and analysis it can be concluded that the while
making the choice of the capital budgeting techniques it is to be kept in mind the specific
merits and demerits associated with each of the techniques. Further the technique of the Net
present value is always preferred than any other techniques as suggested.
Again none of the investment decisions can be made final only on the basis of financial
evaluations rather the non- financial factors are also as important as the financial one. Hence
they too demand equal merit.
The determination of the appropriate sources of funds is a critical judgement to be made and
it is the best strategy to have the optimum balance of the equity and the debt in the capital
structure of the company. As neither the total equity nor total debt funded company can best
utilize its resources? Debt is cheaper but may prove to be costly if not paid. Again debts
funds are not very easy to procure as it depends on the credibility of the company too.
Finally cost of equity is a major factor to be considered as at times if dividend is not paid by
the company in such a case if the capital asset pricing model is used then it may make
difference or even can lead to wrong decisions too.
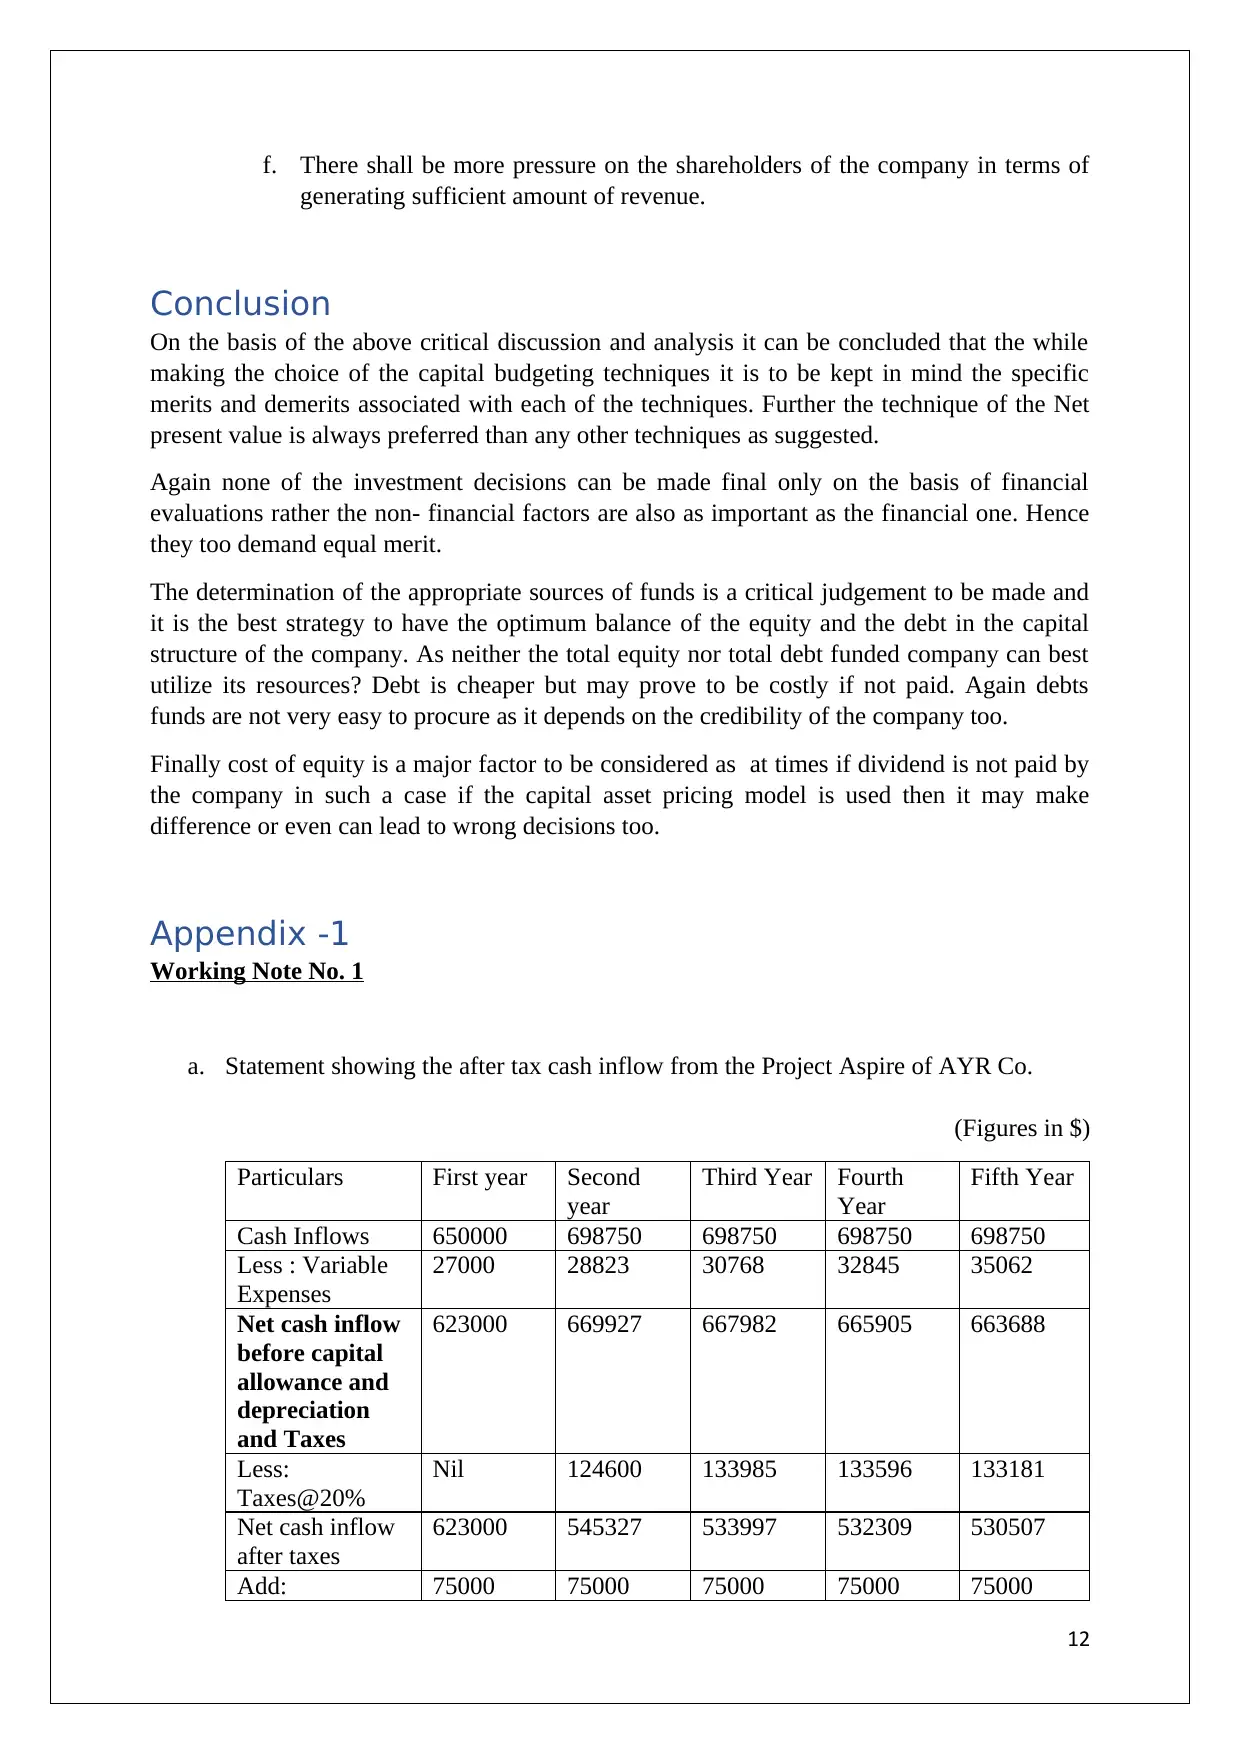
Appendix -1
Working Note No. 1
a. Statement showing the after tax cash inflow from the Project Aspire of AYR Co.
(Figures in $)
Particulars First year Second
year
Third Year Fourth
Year
Fifth Year
Cash Inflows 650000 698750 698750 698750 698750
Less : Variable
Expenses
27000 28823 30768 32845 35062
Net cash inflow
before capital
allowance and
depreciation
and Taxes
623000 669927 667982 665905 663688
Less:
Taxes@20%
Nil 124600 133985 133596 133181
Net cash inflow
after taxes
623000 545327 533997 532309 530507
Add: 75000 75000 75000 75000 75000
12
generating sufficient amount of revenue.
Conclusion
On the basis of the above critical discussion and analysis it can be concluded that the while
making the choice of the capital budgeting techniques it is to be kept in mind the specific
merits and demerits associated with each of the techniques. Further the technique of the Net
present value is always preferred than any other techniques as suggested.
Again none of the investment decisions can be made final only on the basis of financial
evaluations rather the non- financial factors are also as important as the financial one. Hence
they too demand equal merit.
The determination of the appropriate sources of funds is a critical judgement to be made and
it is the best strategy to have the optimum balance of the equity and the debt in the capital
structure of the company. As neither the total equity nor total debt funded company can best
utilize its resources? Debt is cheaper but may prove to be costly if not paid. Again debts
funds are not very easy to procure as it depends on the credibility of the company too.
Finally cost of equity is a major factor to be considered as at times if dividend is not paid by
the company in such a case if the capital asset pricing model is used then it may make
difference or even can lead to wrong decisions too.
Appendix -1
Working Note No. 1
a. Statement showing the after tax cash inflow from the Project Aspire of AYR Co.
(Figures in $)
Particulars First year Second
year
Third Year Fourth
Year
Fifth Year
Cash Inflows 650000 698750 698750 698750 698750
Less : Variable
Expenses
27000 28823 30768 32845 35062
Net cash inflow
before capital
allowance and
depreciation
and Taxes
623000 669927 667982 665905 663688
Less:
Taxes@20%
Nil 124600 133985 133596 133181
Net cash inflow
after taxes
623000 545327 533997 532309 530507
Add: 75000 75000 75000 75000 75000
12
⊘ This is a preview!⊘
Do you want full access?
Subscribe today to unlock all pages.
Trusted by 1+ million students worldwide
1 out of 15
Related Documents


Your All-in-One AI-Powered Toolkit for Academic Success.
+13062052269
info@desklib.com
Available 24*7 on WhatsApp / Email
![[object Object]](/_next/static/media/star-bottom.7253800d.svg)
Unlock your academic potential
Copyright © 2020–2026 A2Z Services. All Rights Reserved. Developed and managed by ZUCOL.