AF4S31: Financial Analysis of Investment Projects at AYR Co.
VerifiedAdded on 2023/04/21
|22
|4552
|493
Report
AI Summary
This report provides a comprehensive financial analysis of two investment projects, Aspire and Wolf, for AYR Co. The analysis includes a capital investment appraisal, utilizing methods such as Net Present Value (NPV), Internal Rate of Return (IRR), and payback period to evaluate the projects' financial viability. The report calculates and compares these metrics for both projects, considering discounted cash flows and the time value of money. The findings reveal that Project Aspire has a higher NPV, indicating greater potential cash flows, while Project Wolf offers a shorter payback period. The report also examines other factors like strategic options, personnel, culture, economic and political influences, and environmental concerns. Based on the analysis, recommendations are made to the directors of AYR Co., guiding them on which project to select, considering both financial and non-financial aspects for informed decision-making.

Running Head: FINANCIAL ANALYSIS 0
FINANCIAL ANALYSIS
FINANCIAL ANALYSIS
Paraphrase This Document
Need a fresh take? Get an instant paraphrase of this document with our AI Paraphraser
FINANCIAL ANALYSIS 1
Abstract
AYR co is basically a company that is looking out for the proposals of investment of two
categories namely Aspire and Wolf. According to the information provided in the case study the
Directors of the AYR Co. are being advised on how to plan the capital expenditure. On the basis
of certain assumptions the Net Present Value, Internal Rate of Return and Payback period of the
projects were calculated. After comparing both the projects of the company the Project Aspire
has been recommended to the company due to the great amount of cash flows as compared to the
Project Wolf. However a number of other factors are also required to be considered in terms of
the financial and other market forces.
FINANCIAL ANALYSIS 2
Contents
Abstract.......................................................................................................................................................1
Phase 1: Capital Investment Appraisal........................................................................................................3
Methods and Techniques.........................................................................................................................3
Phase 2: Analysis and evaluation of the investment project option.............................................................4
Findings...................................................................................................................................................4
Net Present value.................................................................................................................................4
Internal Rate of Return........................................................................................................................6
Payback period....................................................................................................................................6
Interpretations and Recommendations.....................................................................................................8
Other factors............................................................................................................................................9
Financing and its sources...........................................................................................................................10
Description of Equity and Debt.............................................................................................................11
Cost of financing...................................................................................................................................12
Effects on WACC..................................................................................................................................13
Shareholders and Impact.......................................................................................................................13
Conclusion.................................................................................................................................................14
References.................................................................................................................................................15
Appendix...................................................................................................................................................18
⊘ This is a preview!⊘
Do you want full access?
Subscribe today to unlock all pages.
Trusted by 1+ million students worldwide
FINANCIAL ANALYSIS 3
Phase 1: Capital Investment Appraisal
The capital investment appraisal is a segment of the planning which assist in evaluating the long
terms investments or the short term investment. There are various methods to calculate the
viability of the investments and such techniques are namely IRR, Net present Value, and
Profitability index. The current report will be restricted to these three methods an these
techniques are used to determine the future prospects that will be beneficial after the
implementation. In order to increase the market share the AYR Co shall focus on the ability of
the projects to generate enough cash flows (Caselli and Negri, 2018).
Methods and Techniques
As mentioned in the report the three methods of the appraisal and capital investments include the
net present value, the IRR and the payback period. The first two methods also consider the
concept of the time value of money (Burns and Walker, 2015).
Net Present value: it is the calculative description of the difference between the inflows and the
outflows of the cash. The net present value is calculated at the discounted rate. The decision on
the basis of the net present value can be considered on the basis of the high or low present value.
The higher the net present value, the desirability of the project increases accordingly (Rad,
Jamili, Tavakkoli-Moghaddam and Paknahad, 2016).
Formula:
NPV = Cashflow - Initial Investment
(1+i)^t
Paraphrase This Document
Need a fresh take? Get an instant paraphrase of this document with our AI Paraphraser
FINANCIAL ANALYSIS 4
Internal rate of return: IRR is the discounting rate that brings the NPV value equivalent to
zero. The decision on the basis of the IRR can be taken if the cost of capital is lower than the
IRR, otherwise the project is rejected (Gallo, 2016).
Formula:
IRR(Sum of cash flows including initial investment)
Payback period: The payback period can be referred to as the period in which the cost of
investment can be recovered. The investment proposals that have the shorter payback period
shall be selected (Abor, 2017).
Payback Period = A
+
B
C
Variable A: is the last period with a negative cumulative cash flow;
Variable B: is the absolute value of cumulative cash flow at the end of the period A
Variable C: is the total cash flow during the period after A
Phase 2: Analysis and evaluation of the investment project option
Findings
Net Present value
To analyze the discounted cash flows, NPV stands out as one of the common techniques used for
measuring the projects. In this way the future uncertainty of the cash flows is compensated. This
techniques allows the good comparison between the cash flows, hence the net present value is a
good factor to analyze the present position of the investment proposals. For two investment
proposals the project with higher NPV shall be selected. For the purpose of calculation the

FINANCIAL ANALYSIS 5
discounted rate of 10% is used to discount all the net cash flows to their present value. The same
can be observed with the help of the table (Leyman and Vanhoucke, 2016).
Project Aspire
Calculation of
Net present
Value
Years Cash
flows
Discounting
Factor @
10%
NPV
0 -2250000 1.00
-
2250000
1 623000 0.91 566930
2 665328 0.83 552222
3 664403 0.75 498302
4 699570 0.68 475708
5 1113063 0.62 690099
6 -193599 0.56 -108415
Net Present
Value 424846
Project Wolf
Calculation of Net
present Value
Years Cash
flows
Discountin
g Factor @
10%
NPV
0
-
225000
0 1.00
-
225000
0
1 847600 0.91 771316
2 678350 0.83 563031
3 678384 0.75 508788
4 678273 0.68 461226
5 678019 0.62 420372
6
-
169518 0.56 -94930
Net Present Value 379801
⊘ This is a preview!⊘
Do you want full access?
Subscribe today to unlock all pages.
Trusted by 1+ million students worldwide

FINANCIAL ANALYSIS 6
From the above analysis it can be found out that the net present value of the Project Aspire is
better than the net present value of the Project Wolf. But this single factor lone cannot help in
deciding whether the project shall be accepted or rejected or not. The other factors must also be
considered to determine which proposal shall be included.
Internal Rate of Return
The internal rate of return is the accounting rate which is basically achieved when the project is
at breakeven. The investors invest in the project on the basis of the internal rate of return because
this rate reflects what amount in return the investor is going to get. The decision to choose the
investment is based upon IRR greater the cost of capital. The higher the IRR the more attractive
the project is. In order to calculate the IRR the following method can be used to present the IRR
(Bornholt, 2017).
Calculati
on of
IRR
Cash
flows
(Aspir
e)
Cash
flows
(Wolf)
-
22500
00
-
22500
00
62300
0
84760
0
66532
8
67835
0
66440
3
67838
4
69957
0
67827
3
11130
63
67801
9
- -
Paraphrase This Document
Need a fresh take? Get an instant paraphrase of this document with our AI Paraphraser
FINANCIAL ANALYSIS 7
19359
9
16951
8
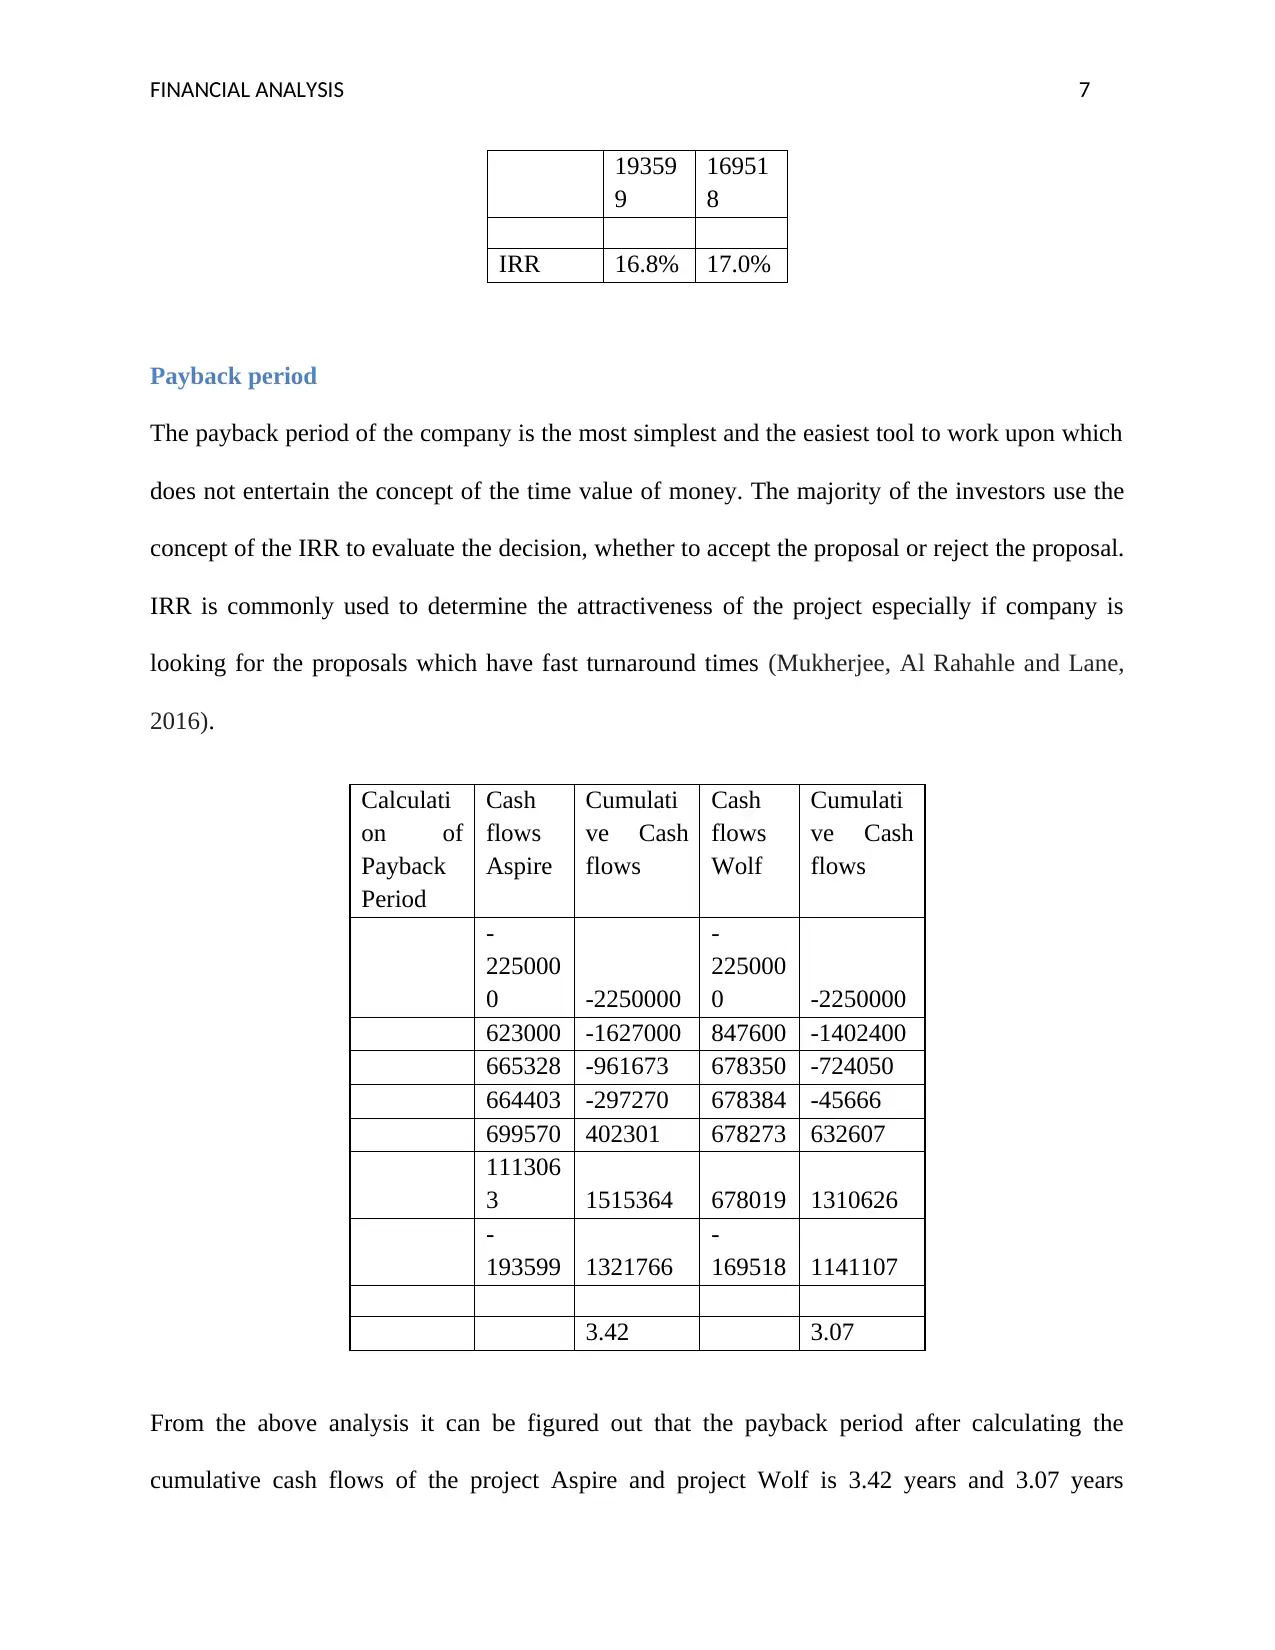
IRR 16.8% 17.0%
Payback period
The payback period of the company is the most simplest and the easiest tool to work upon which
does not entertain the concept of the time value of money. The majority of the investors use the
concept of the IRR to evaluate the decision, whether to accept the proposal or reject the proposal.
IRR is commonly used to determine the attractiveness of the project especially if company is
looking for the proposals which have fast turnaround times (Mukherjee, Al Rahahle and Lane,
2016).
Calculati
on of
Payback
Period
Cash
flows
Aspire
Cumulati
ve Cash
flows
Cash
flows
Wolf
Cumulati
ve Cash
flows
-
225000
0 -2250000
-
225000
0 -2250000
623000 -1627000 847600 -1402400
665328 -961673 678350 -724050
664403 -297270 678384 -45666
699570 402301 678273 632607
111306
3 1515364 678019 1310626
-
193599 1321766
-
169518 1141107
3.42 3.07
From the above analysis it can be figured out that the payback period after calculating the
cumulative cash flows of the project Aspire and project Wolf is 3.42 years and 3.07 years
19359
9
16951
8
IRR 16.8% 17.0%
Payback period
The payback period of the company is the most simplest and the easiest tool to work upon which
does not entertain the concept of the time value of money. The majority of the investors use the
concept of the IRR to evaluate the decision, whether to accept the proposal or reject the proposal.
IRR is commonly used to determine the attractiveness of the project especially if company is
looking for the proposals which have fast turnaround times (Mukherjee, Al Rahahle and Lane,
2016).
Calculati
on of
Payback
Period
Cash
flows
Aspire
Cumulati
ve Cash
flows
Cash
flows
Wolf
Cumulati
ve Cash
flows
-
225000
0 -2250000
-
225000
0 -2250000
623000 -1627000 847600 -1402400
665328 -961673 678350 -724050
664403 -297270 678384 -45666
699570 402301 678273 632607
111306
3 1515364 678019 1310626
-
193599 1321766
-
169518 1141107
3.42 3.07
From the above analysis it can be figured out that the payback period after calculating the
cumulative cash flows of the project Aspire and project Wolf is 3.42 years and 3.07 years

FINANCIAL ANALYSIS 8
respectively. The Wolf project has more capacity than the Aspire project. This certainly doesn’t
mean that the Aspire project is bad and shall not be selected the Aspire project though is going to
recover the cost a little later yet it can be chosen on the basis of the net present value and internal
rate of return if combined in taking the overall decision (Robinson and Burnett, 2016).
⊘ This is a preview!⊘
Do you want full access?
Subscribe today to unlock all pages.
Trusted by 1+ million students worldwide
FINANCIAL ANALYSIS 9
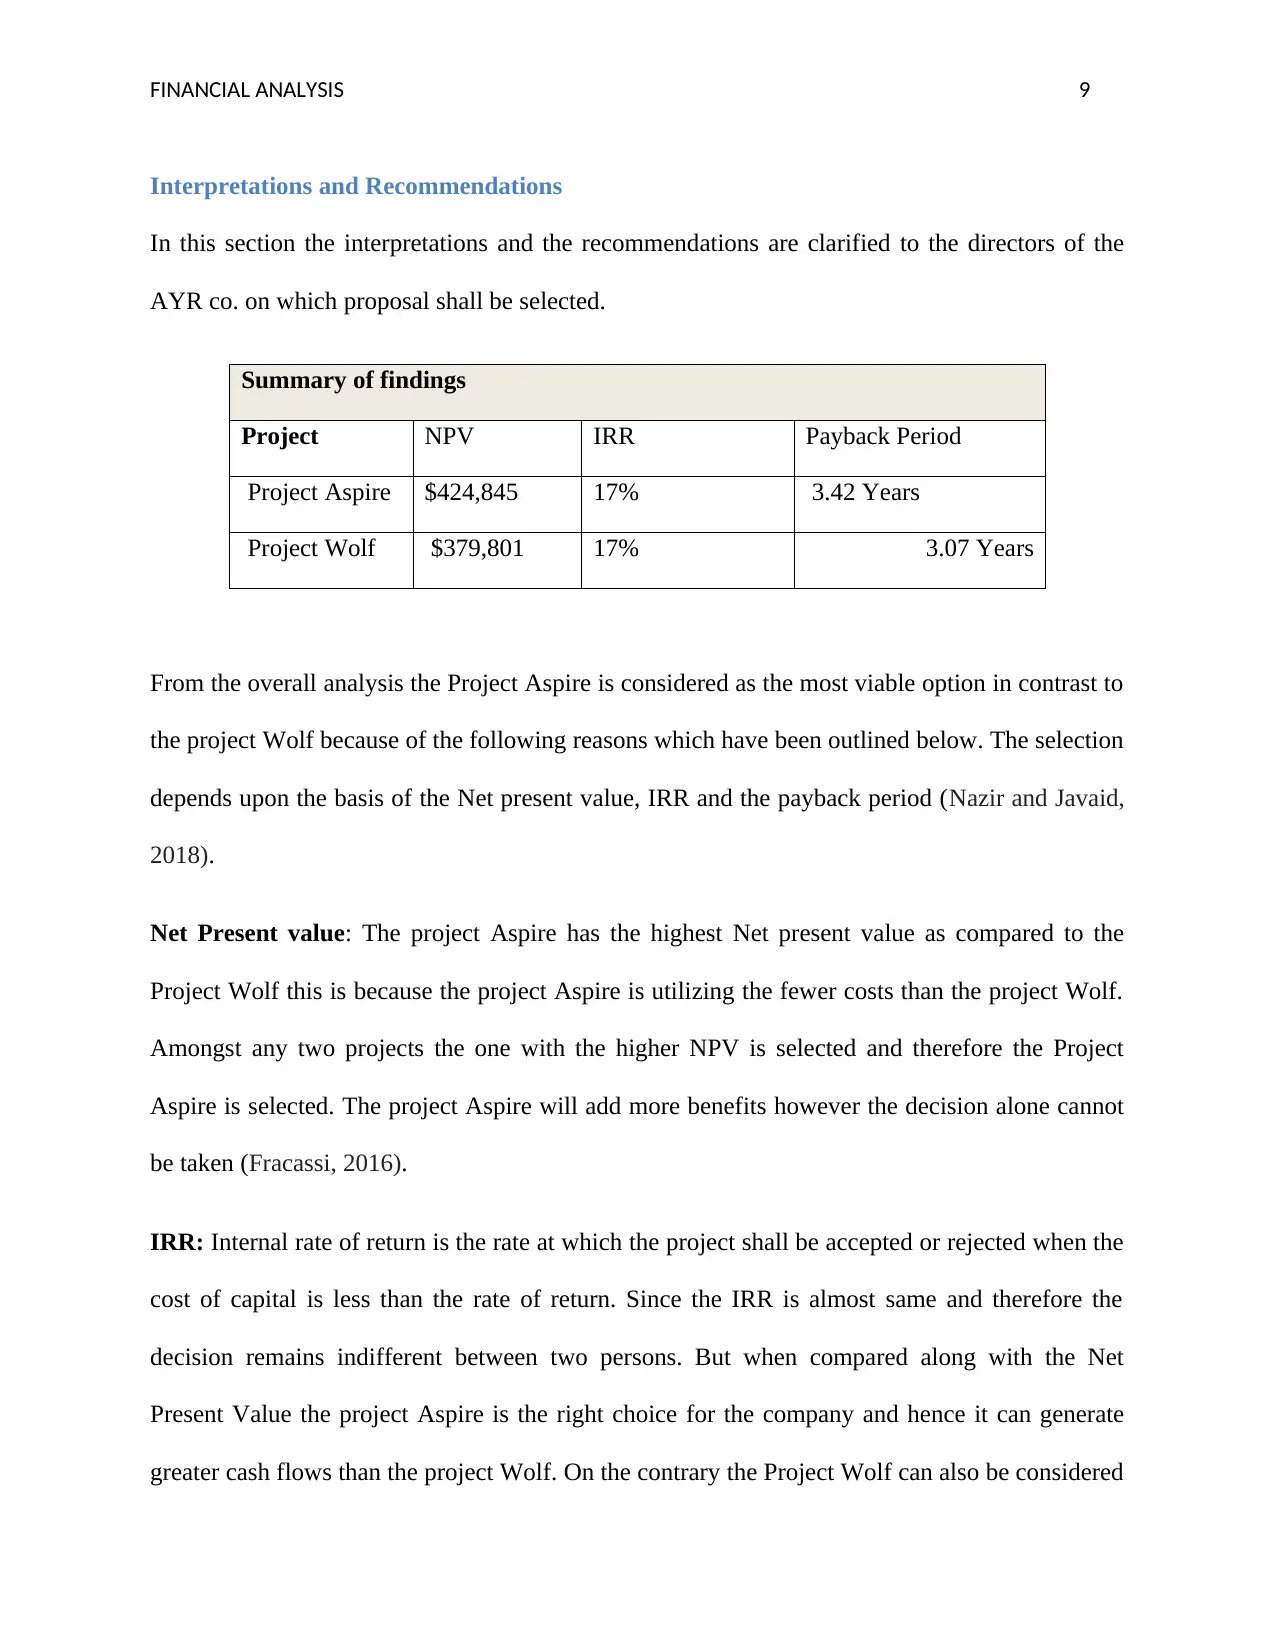
Interpretations and Recommendations
In this section the interpretations and the recommendations are clarified to the directors of the
AYR co. on which proposal shall be selected.
Summary of findings
Project NPV IRR Payback Period
Project Aspire $424,845 17% 3.42 Years
Project Wolf $379,801 17% 3.07 Years
From the overall analysis the Project Aspire is considered as the most viable option in contrast to
the project Wolf because of the following reasons which have been outlined below. The selection
depends upon the basis of the Net present value, IRR and the payback period (Nazir and Javaid,
2018).
Net Present value: The project Aspire has the highest Net present value as compared to the
Project Wolf this is because the project Aspire is utilizing the fewer costs than the project Wolf.
Amongst any two projects the one with the higher NPV is selected and therefore the Project
Aspire is selected. The project Aspire will add more benefits however the decision alone cannot
be taken (Fracassi, 2016).
IRR: Internal rate of return is the rate at which the project shall be accepted or rejected when the
cost of capital is less than the rate of return. Since the IRR is almost same and therefore the
decision remains indifferent between two persons. But when compared along with the Net
Present Value the project Aspire is the right choice for the company and hence it can generate
greater cash flows than the project Wolf. On the contrary the Project Wolf can also be considered
Paraphrase This Document
Need a fresh take? Get an instant paraphrase of this document with our AI Paraphraser

FINANCIAL ANALYSIS 10
just on the basis of the IRR and this can also add more value to the AYR Co. hence, overall
conclusion will fall in favor of the Project Aspire only (Ehrhardt and Brigham, 2016).
Payback Period: Lastly in terms of the payback period the Project Wolf is ahead of Project
Aspire as the number of days the investment can recover the cost of investment in 3.07 years
whereas in case of the Aspire project the payback period is 3.42 years. Under this situation the
project Wolf is recommended to the AYR Co. as it will recover the cost of investment in the
faster manner. The project Wolf might be a fruitful one but the Project Aspire is the most
desirable choice in terms of the overall selection of the proposal (Pham and Alenikov, 2018).
Other factors
Strategic options
The strategy plays an important factor determining the selection of the proposal and the
acceptance. This usually occurs when the product breaks the sales of another product. If such
case arises for the Project Aspire it is recommended to the directors of the company to entertain
the Wolf project more as it appeal to the different categories and while the Aspire project is used
to fulfill the expectations of the existing customers. In such a case the desirability of the project
will increase and will be favorable for the company. Such strategies will define the right choice
that fits the resources of the company.
Personnel
Personnel also play a vital role in selection of the proposal and the situations differ accordingly.
In case of the AYR Co. has experts and the skilled people or they have the capacity to enjoy the
wider options in the market. The non-financial factors shall also be considered (Harris, 2018).
FINANCIAL ANALYSIS 11
Culture and system
The culture and system of the company can interfere the performance of the company in many
ways. This may also leads to the either the enhancement in the performance or the declining in
the performance of the company. If undertaking the Aspire project by the company can lead to
the interference of the culture and the values possessed by the companies on the basis of say the
method of the communication than the company can make the changes accordingly and decide.
It is the duty of the management to take all the possible alternatives before making any capital
investment decision. Therefore it is advised to the management of the AYR Co that it shall
analyze the effects of the investment proposal before spending the funds.
Economy and politics
The economic and the political factors are also critical from the point of view of the
management. The interest rates and the taxes can affect the performance the company that may
also give rise to inflation (Michiels and Molly, 2017).
Environmental concerns
The ethical practices and the environmental concerns are the major reasons that are to be
analyzed because it can possibly effect the financial option the company is going to adopt. This
suggests that the management shall supervise the changes happening in the external as well as
the internal environment (Frank and Shen, 2016).
Financing and its sources
In this particular phase of the report the methods of the financing are being discussed by the
AYR Co. The methods are classified into the Equity financing and debt financing. Under the
⊘ This is a preview!⊘
Do you want full access?
Subscribe today to unlock all pages.
Trusted by 1+ million students worldwide
1 out of 22
Related Documents


Your All-in-One AI-Powered Toolkit for Academic Success.
+13062052269
info@desklib.com
Available 24*7 on WhatsApp / Email
![[object Object]](/_next/static/media/star-bottom.7253800d.svg)
Unlock your academic potential
Copyright © 2020–2026 A2Z Services. All Rights Reserved. Developed and managed by ZUCOL.