Comprehensive Financial Statement Analysis of B Ltd. (2021-2022)
VerifiedAdded on 2023/06/04
|6
|1298
|233
Report
AI Summary
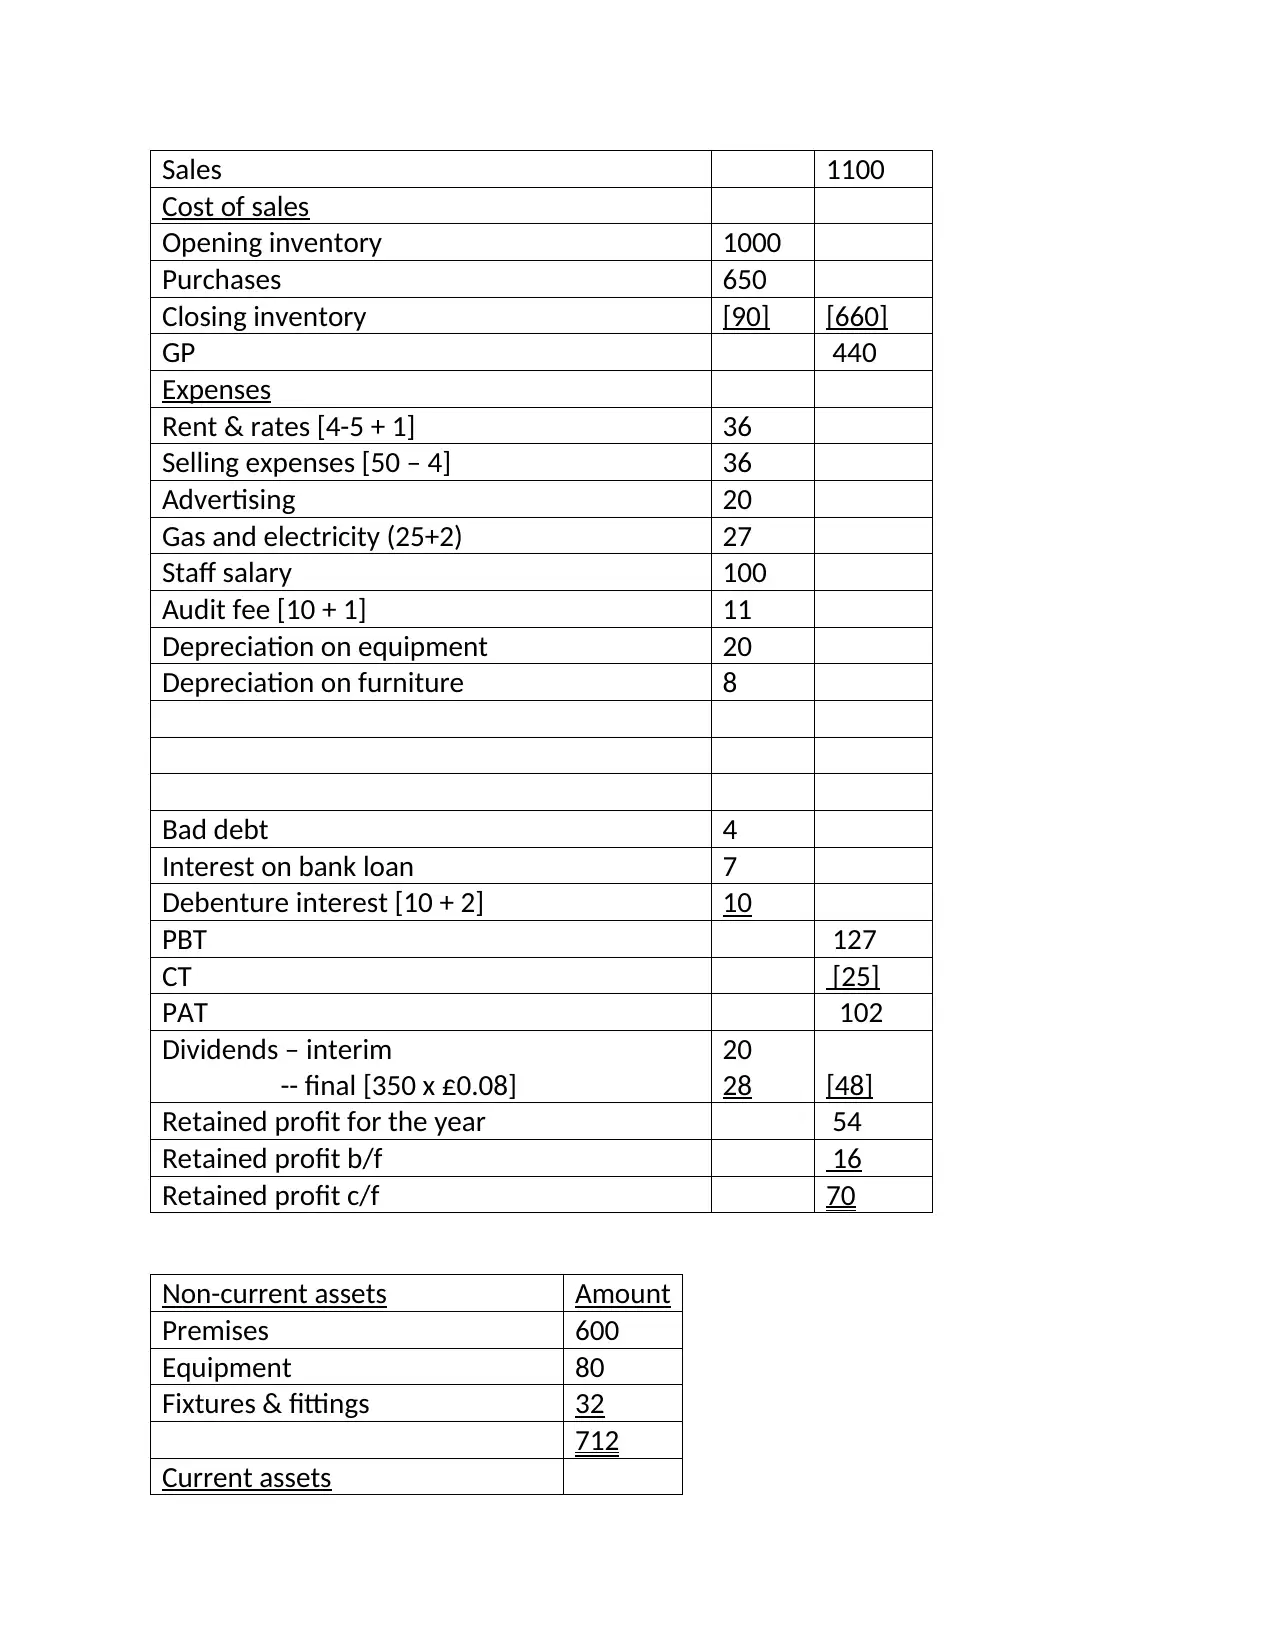
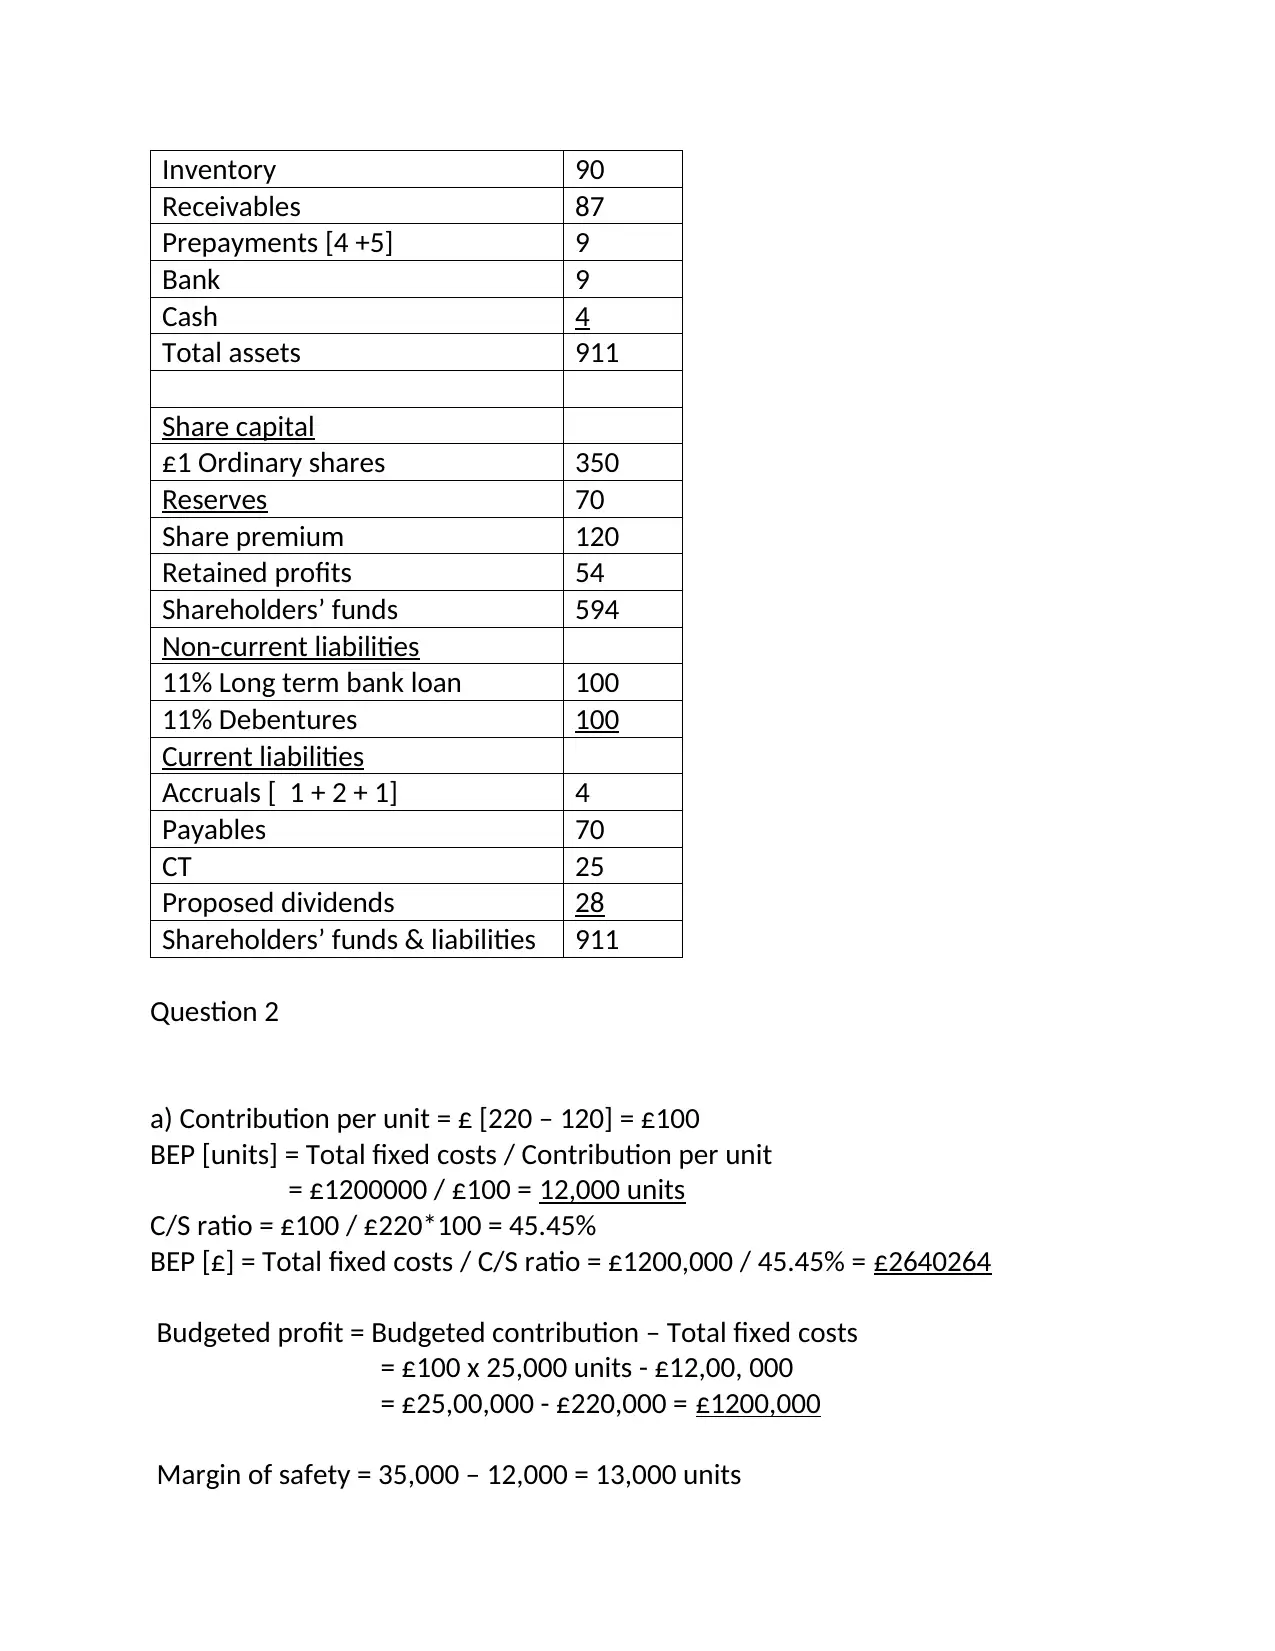
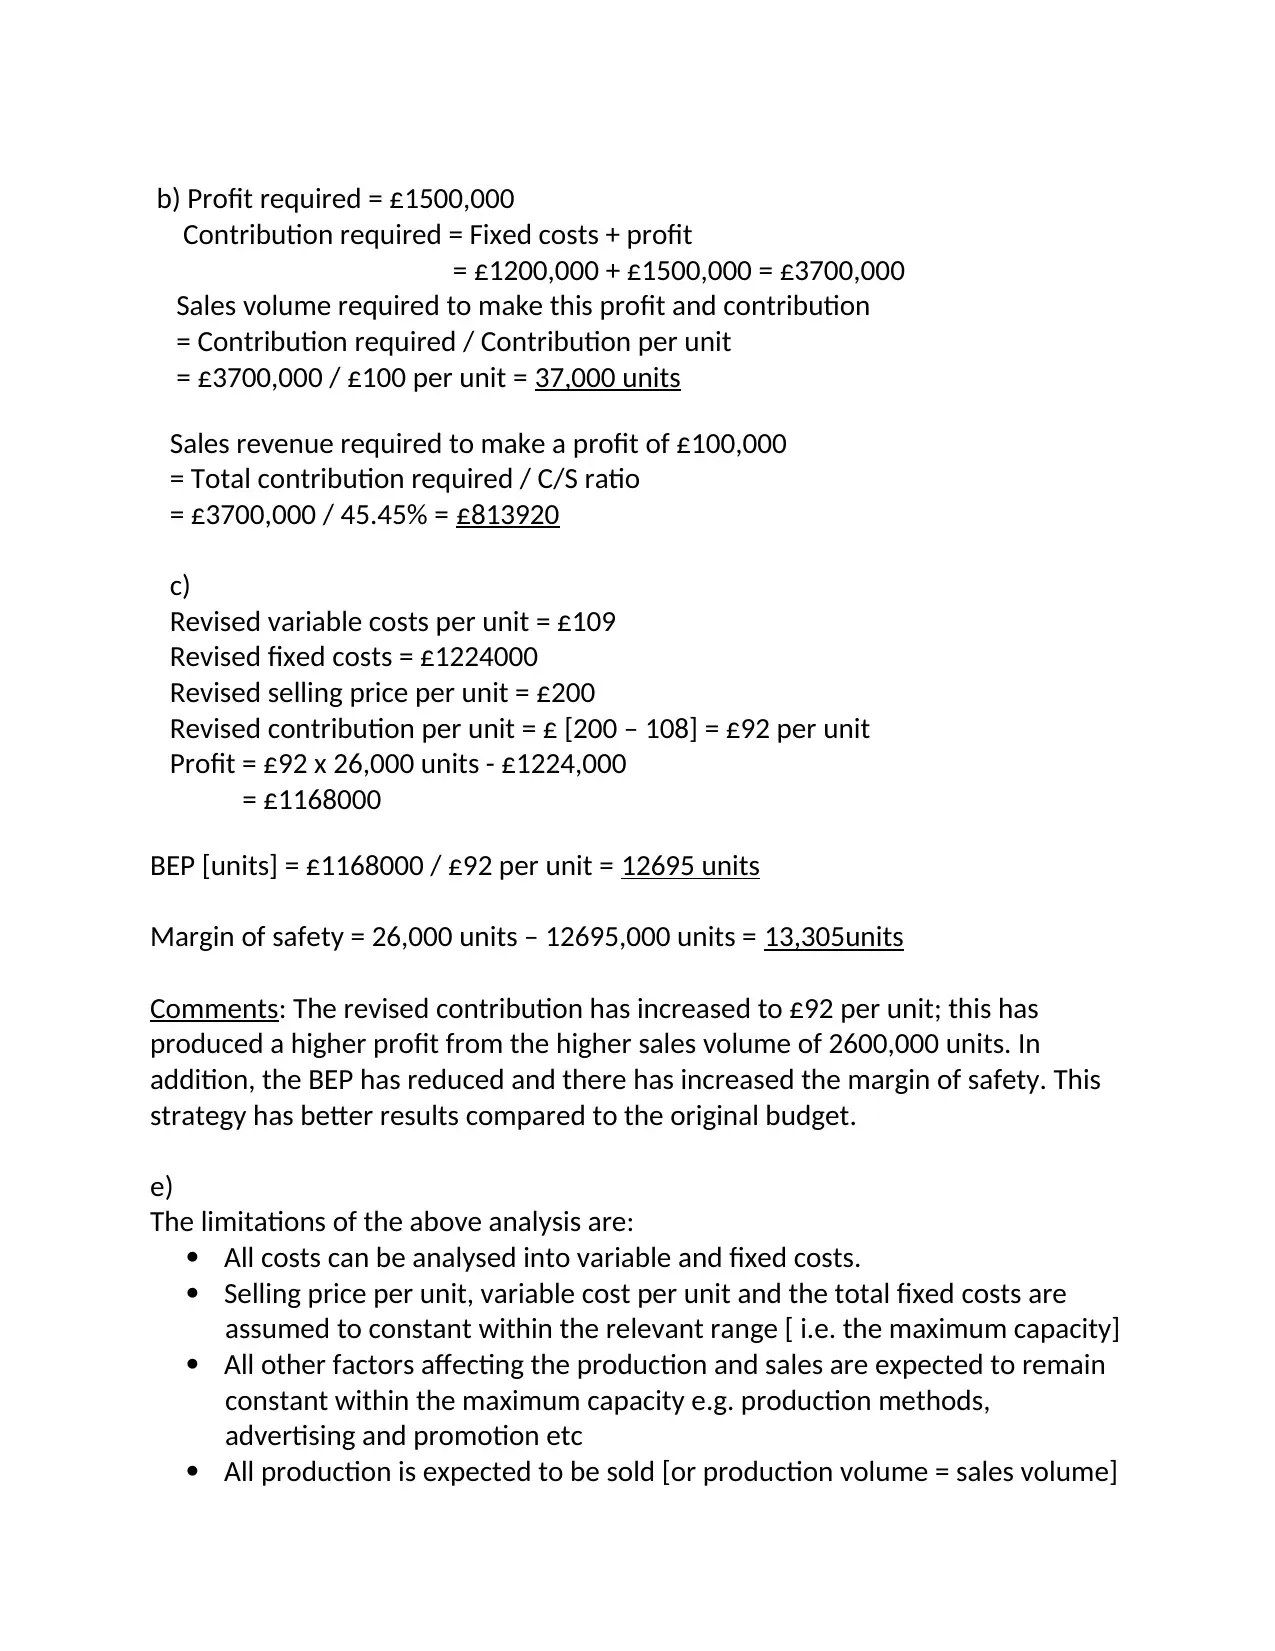
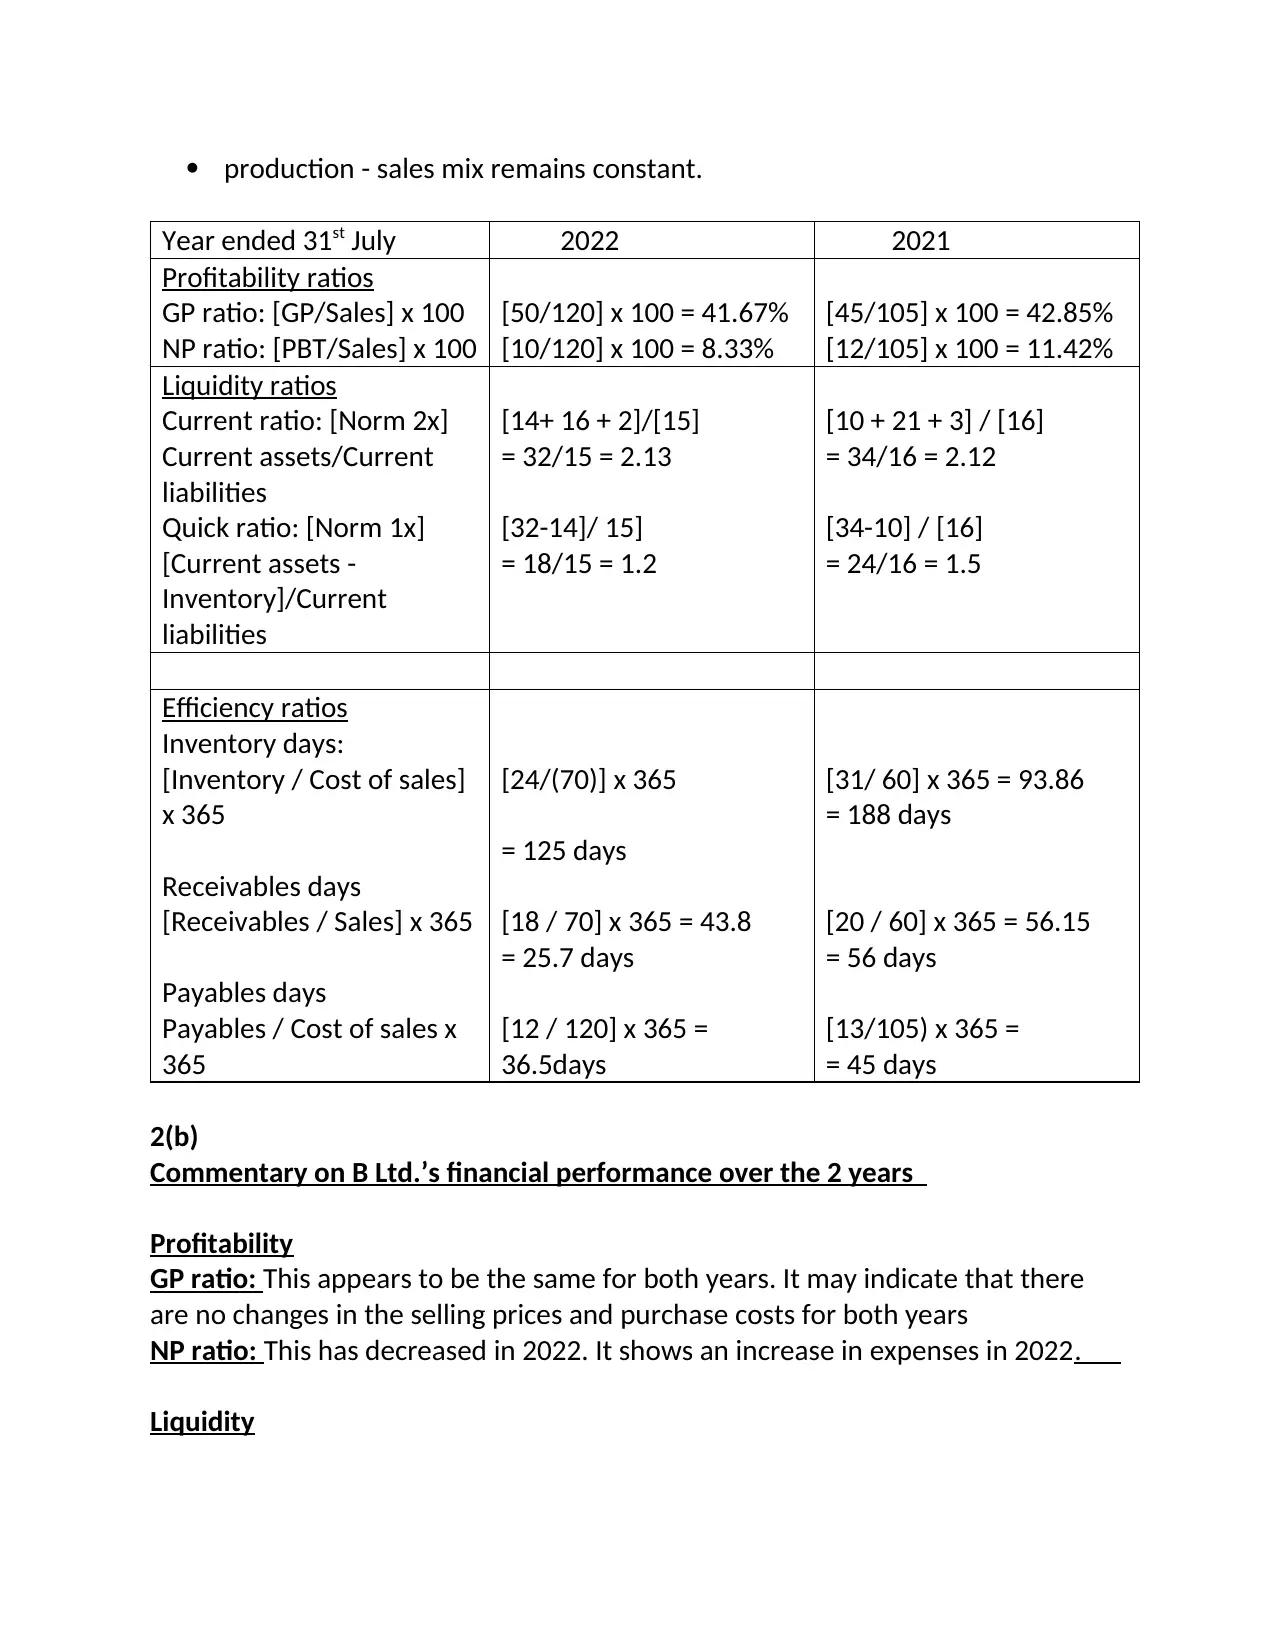
This report provides a comprehensive analysis of B Ltd.'s financial performance, encompassing the years 2021 and 2022. It begins with the construction of the financial statements, including the income statement, balance sheet, and calculation of key financial ratios. The report delves into profitability, liquidity, and efficiency ratios, providing insights into the company's financial health and performance trends. A break-even analysis is conducted to determine the sales volume needed to cover costs and achieve profitability. The analysis includes commentary on the company's financial performance over the two years, and also the limitations of the analysis. The report concludes with recommendations for B Ltd. to improve its financial performance, covering areas such as expense management, liquidity, inventory management, and payables management. Finally, the report provides a list of references for further reading.

Sales 1100
Cost of sales
Opening inventory 1000
Purchases 650
Closing inventory [90] [660]
GP 440
Expenses
Rent & rates [4-5 + 1] 36
Selling expenses [50 – 4] 36
Advertising 20
Gas and electricity (25+2) 27
Staff salary 100
Audit fee [10 + 1] 11
Depreciation on equipment 20
Depreciation on furniture 8
Bad debt 4
Interest on bank loan 7
Debenture interest [10 + 2] 10
PBT 127
CT [25]
PAT 102
Dividends – interim
-- final [350 x £0.08]
20
28 [48]
Retained profit for the year 54
Retained profit b/f 16
Retained profit c/f 70
Non-current assets Amount
Premises 600
Equipment 80
Fixtures & fittings 32
712
Current assets
Paraphrase This Document
Need a fresh take? Get an instant paraphrase of this document with our AI Paraphraser

Inventory 90
Receivables 87
Prepayments [4 +5] 9
Bank 9
Cash 4
Total assets 911
Share capital
£1 Ordinary shares 350
Reserves 70
Share premium 120
Retained profits 54
Shareholders’ funds 594
Non-current liabilities
11% Long term bank loan 100
11% Debentures 100
Current liabilities
Accruals [ 1 + 2 + 1] 4
Payables 70
CT 25
Proposed dividends 28
Shareholders’ funds & liabilities 911
Question 2
a) Contribution per unit = £ [220 – 120] = £100
BEP [units] = Total fixed costs / Contribution per unit
= £1200000 / £100 = 12,000 units
C/S ratio = £100 / £220*100 = 45.45%
BEP [£] = Total fixed costs / C/S ratio = £1200,000 / 45.45% = £2640264
Budgeted profit = Budgeted contribution – Total fixed costs
= £100 x 25,000 units - £12,00, 000
= £25,00,000 - £220,000 = £1200,000
Margin of safety = 35,000 – 12,000 = 13,000 units

b) Profit required = £1500,000
Contribution required = Fixed costs + profit
= £1200,000 + £1500,000 = £3700,000
Sales volume required to make this profit and contribution
= Contribution required / Contribution per unit
= £3700,000 / £100 per unit = 37,000 units
Sales revenue required to make a profit of £100,000
= Total contribution required / C/S ratio
= £3700,000 / 45.45% = £813920
c)
Revised variable costs per unit = £109
Revised fixed costs = £1224000
Revised selling price per unit = £200
Revised contribution per unit = £ [200 – 108] = £92 per unit
Profit = £92 x 26,000 units - £1224,000
= £1168000
BEP [units] = £1168000 / £92 per unit = 12695 units
Margin of safety = 26,000 units – 12695,000 units = 13,305units
Comments: The revised contribution has increased to £92 per unit; this has
produced a higher profit from the higher sales volume of 2600,000 units. In
addition, the BEP has reduced and there has increased the margin of safety. This
strategy has better results compared to the original budget.
e)
The limitations of the above analysis are:
All costs can be analysed into variable and fixed costs.
Selling price per unit, variable cost per unit and the total fixed costs are
assumed to constant within the relevant range [ i.e. the maximum capacity]
All other factors affecting the production and sales are expected to remain
constant within the maximum capacity e.g. production methods,
advertising and promotion etc
All production is expected to be sold [or production volume = sales volume]
⊘ This is a preview!⊘
Do you want full access?
Subscribe today to unlock all pages.

Trusted by 1+ million students worldwide

production - sales mix remains constant.
Year ended 31st July 2022 2021
Profitability ratios
GP ratio: [GP/Sales] x 100
NP ratio: [PBT/Sales] x 100
[50/120] x 100 = 41.67%
[10/120] x 100 = 8.33%
[45/105] x 100 = 42.85%
[12/105] x 100 = 11.42%
Liquidity ratios
Current ratio: [Norm 2x]
Current assets/Current
liabilities
Quick ratio: [Norm 1x]
[Current assets -
Inventory]/Current
liabilities
[14+ 16 + 2]/[15]
= 32/15 = 2.13
[32-14]/ 15]
= 18/15 = 1.2
[10 + 21 + 3] / [16]
= 34/16 = 2.12
[34-10] / [16]
= 24/16 = 1.5
Efficiency ratios
Inventory days:
[Inventory / Cost of sales]
x 365
Receivables days
[Receivables / Sales] x 365
Payables days
Payables / Cost of sales x
365
[24/(70)] x 365
= 125 days
[18 / 70] x 365 = 43.8
= 25.7 days
[12 / 120] x 365 =
36.5days
[31/ 60] x 365 = 93.86
= 188 days
[20 / 60] x 365 = 56.15
= 56 days
[13/105) x 365 =
= 45 days
2(b)
Commentary on B Ltd.’s financial performance over the 2 years
Profitability
GP ratio: This appears to be the same for both years. It may indicate that there
are no changes in the selling prices and purchase costs for both years
NP ratio: This has decreased in 2022. It shows an increase in expenses in 2022.
Liquidity
Paraphrase This Document
Need a fresh take? Get an instant paraphrase of this document with our AI Paraphraser

Current ratio: This is well below the norm of 2x and shows a decreasing trend
over the 2 years.
Quick ratio: This also shows a decrease in 2022 and is well below the norm of 1x.
Efficiency
Inventory days: This shows an increase of 6 days in 2022. Indicates that it is taking
longer to sell its inventory.
Receivables days: This has decreased from 45 days to days. It shows an
improvement in receivables management [i.e. credit control of receivables].
Payables days: This has decreased from 45 days to 36 days. More information [i.e.
credit period allowed by the supply chain] is required to assess payables
management.
Conclusion to the management of B Ltd.
The NP ratio can be improved by better management of expenses.
Both liquidity ratios need to be improved and increased to the norms. Otherwise
the company may face cash flow problems.
Better management of inventory is necessary – this may improve profitability and
liquidity. Payables management may require attention to manage credit risks with
the supply chain.

REFERENCES
Books and Journals
Asir, M., Rachman, S. and Yuliani, N.F., 2022. Performance Analysis of Financial Statements on
CV. SAM in Gowa District. Budapest International Research and Critics Institute (BIRCI-
Journal): Humanities and Social Sciences, 5(3).
Haustein, E. and Lorson, P.C., 2019. Consolidated financial statements.
Hernawati, E., 2021. Corporate Governance, Earnings Management and Integrity of Financial
Statements: The Role of Audit Quality and Evidence from Indonesia. Review of
International Geographical Education Online, 11(3).
Huy, P.Q. and Phuc, V.K., 2022. Exploration the influence to information quality of financial
statements from internal control structure–an approach to education field in public
sector. International Journal of Intellectual Property Management, 12(3), pp.318-340.
Li, J., Wei, L. and Zhu, X., 2022. Financial Statements-Based Bank Risk Aggregation
Framework. Financial Statements-Based Bank Risk Aggregation, pp.43-54.
Xu, X., 2022. Analysis of Zijin Mining's Financial Statements based on Harvard
Framework. Frontiers in Economics and Management, 3(8), pp.368-377.
⊘ This is a preview!⊘
Do you want full access?
Subscribe today to unlock all pages.

Trusted by 1+ million students worldwide
1 out of 6
Related Documents
Your All-in-One AI-Powered Toolkit for Academic Success.
+13062052269
info@desklib.com
Available 24*7 on WhatsApp / Email
Unlock your academic potential
Copyright © 2020–2025 A2Z Services. All Rights Reserved. Developed and managed by ZUCOL.


