Corporate Financial Management: British Airways Financial Report
VerifiedAdded on 2023/01/11
|33
|9060
|98
Report
AI Summary
This report provides a comprehensive financial analysis of British Airways (BA), examining its financial performance, risk profile, and valuation. The report begins with an executive summary, followed by an introduction to BA and its industry context. It then delves into BA's corporate governance and financial performance, utilizing ratio analysis to assess profitability, liquidity, and solvency from 2014 to 2018. The analysis includes an evaluation of risk factors, capital structure choices, and dividend policy. Furthermore, the report explores the company's prospects and fair valuation using a valuation model, ultimately aiming to determine BA's stability and market position within the airline industry. The report also includes capital budgeting calculations.
Running Head: CORPORTATE FINANCIAL MANAGEMENT
0
CFM
Financial Report analysis of British Airways
(Student Details: )
1/15/2020
0
CFM
Financial Report analysis of British Airways
(Student Details: )
1/15/2020
Paraphrase This Document
Need a fresh take? Get an instant paraphrase of this document with our AI Paraphraser
CORPORTATE FINANCIAL MANAGEMENT
1
Part A
Executive Summary
In this era, business world has become more challenging and competitive than it was before
because of the advancement of the modern development of technologies, modern economic
recessions. The major aim of this report is to produce a financial analysis of the company
British Airways Plc. (BA) over the last past years. It has been found that, BA is the UK’s
leader within airline operations as it has faced a hike in competition during the last 10 years
while contending an improved amount of the market share shared by so many modern firms.
The report has been carried out for evaluating the financial-performance of the chosen firm
with ratio analysis. In addition to that, the report has used risk profile analysis while
exploring the different risks sources as well as actions taken by the company for mitigating
those risks for recommending best to the company’s future. Besides, BA has a goal of
maximization of their shareholders’ wealth which can be achieved by understanding financial
analysis. It is clear that in order to achieve such goal company require to create several
competitive advantages in the modern airline market. Thus, through implementing proper
strategies BA can always stay on the correct track of the business all across the globe. Thus,
this report has been written to find out which financial strategies and methods should be used
by BA to be fit in the today’s airline market as a successful organization. With the help of
analysing BA’s financial performance, risk profile, dividend policy, optimality of capital
structure selections and prospects by using valuation model, this report has been able to
analyse the stability as well as current market position of the BA within recent airline
industries.
CORPORTATE FINANCIAL MANAGEMENT
2
Contents
Part A.........................................................................................................................................1
Executive Summary...................................................................................................................1
British Airways..........................................................................................................................3
Introduction................................................................................................................................3
A brief description of the company............................................................................................4
Corporate Governance...........................................................................................................4
Financial performance............................................................................................................5
Risk profile.............................................................................................................................8
Optimality of capital structure choices................................................................................10
Dividend policy....................................................................................................................10
Prospects and fair valuation of the firm using a valuation model........................................11
Conclusion................................................................................................................................12
Part B........................................................................................................................................13
Introduction..............................................................................................................................13
Capital budget calculations......................................................................................................13
Conclusion................................................................................................................................16
References................................................................................................................................17
Appendix..................................................................................................................................20
⊘ This is a preview!⊘
Do you want full access?
Subscribe today to unlock all pages.
Trusted by 1+ million students worldwide
CORPORTATE FINANCIAL MANAGEMENT
3
British Airways
Introduction
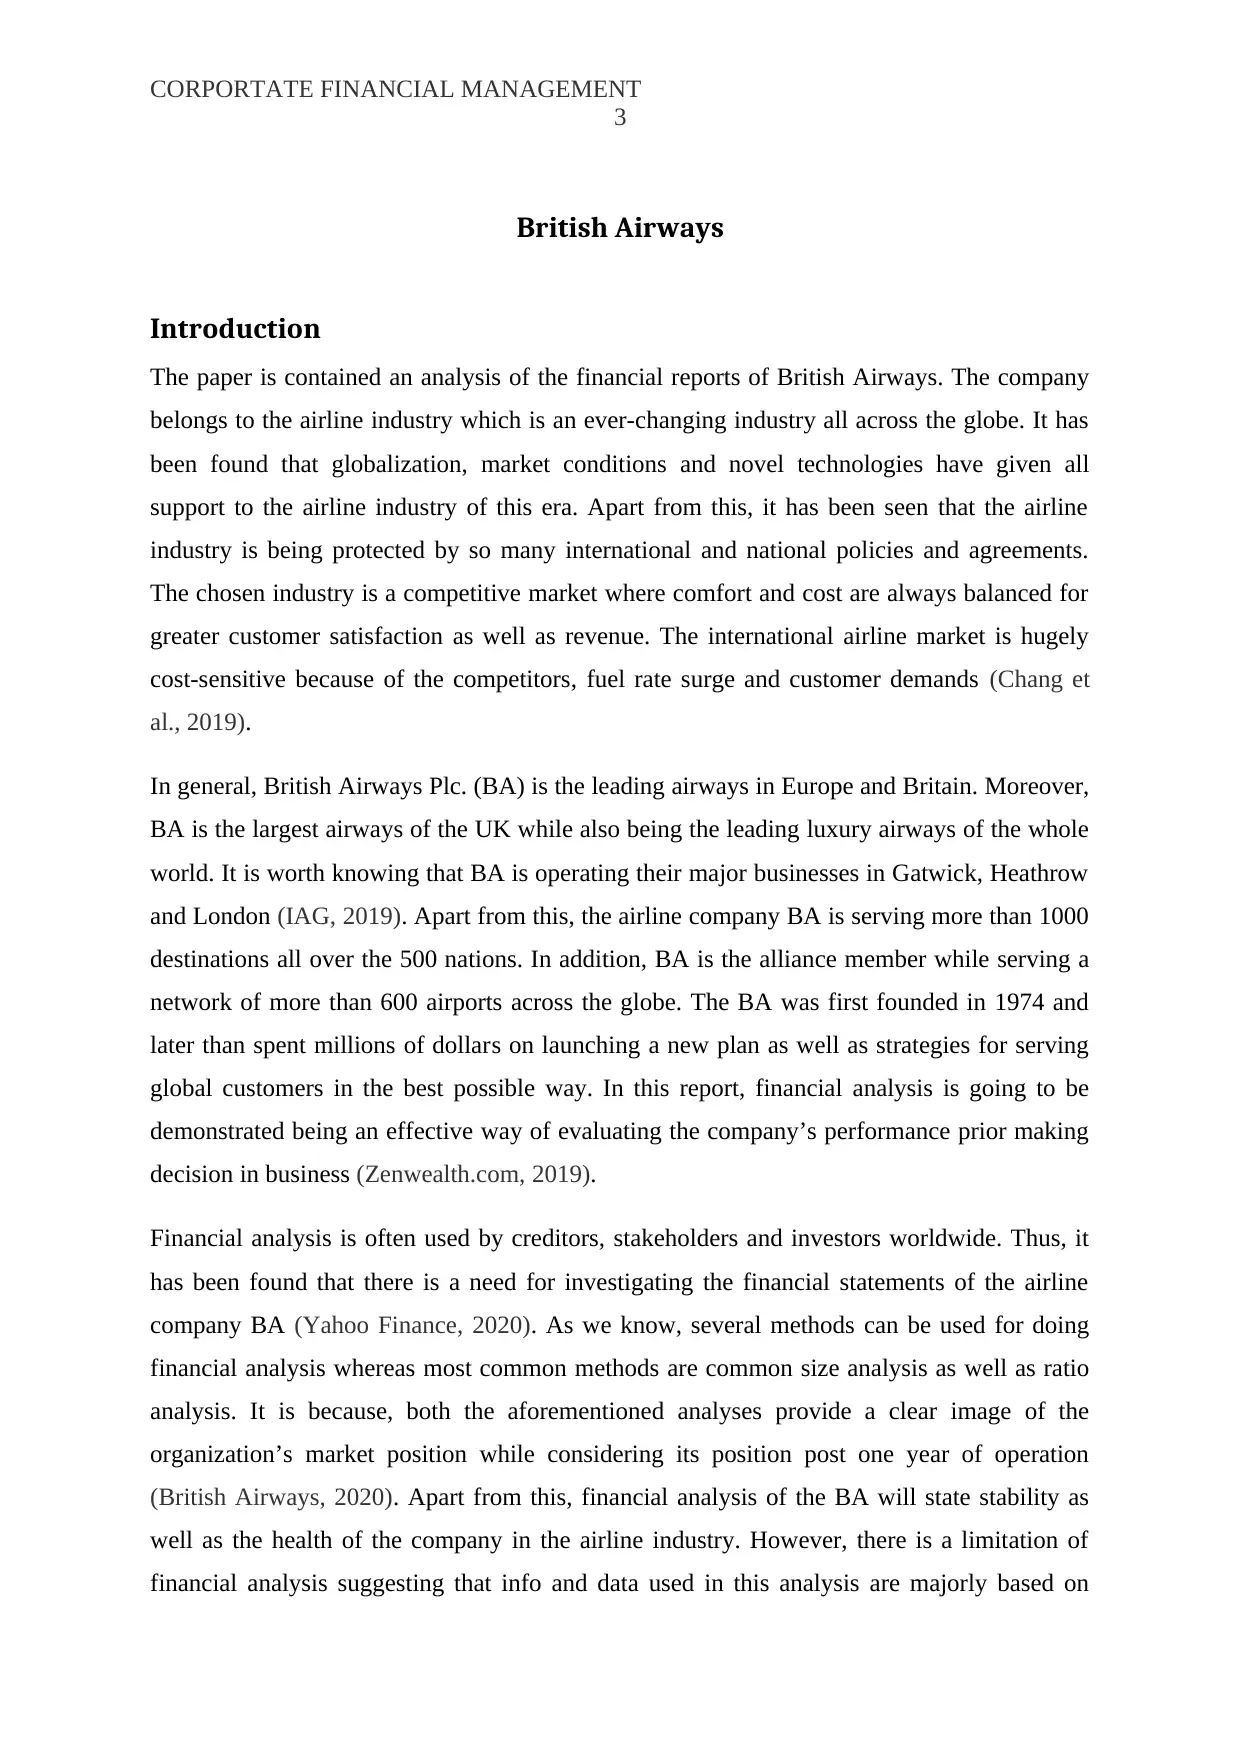
The paper is contained an analysis of the financial reports of British Airways. The company
belongs to the airline industry which is an ever-changing industry all across the globe. It has
been found that globalization, market conditions and novel technologies have given all
support to the airline industry of this era. Apart from this, it has been seen that the airline
industry is being protected by so many international and national policies and agreements.
The chosen industry is a competitive market where comfort and cost are always balanced for
greater customer satisfaction as well as revenue. The international airline market is hugely
cost-sensitive because of the competitors, fuel rate surge and customer demands (Chang et
al., 2019).
In general, British Airways Plc. (BA) is the leading airways in Europe and Britain. Moreover,
BA is the largest airways of the UK while also being the leading luxury airways of the whole
world. It is worth knowing that BA is operating their major businesses in Gatwick, Heathrow
and London (IAG, 2019). Apart from this, the airline company BA is serving more than 1000
destinations all over the 500 nations. In addition, BA is the alliance member while serving a
network of more than 600 airports across the globe. The BA was first founded in 1974 and
later than spent millions of dollars on launching a new plan as well as strategies for serving
global customers in the best possible way. In this report, financial analysis is going to be
demonstrated being an effective way of evaluating the company’s performance prior making
decision in business (Zenwealth.com, 2019).
Financial analysis is often used by creditors, stakeholders and investors worldwide. Thus, it
has been found that there is a need for investigating the financial statements of the airline
company BA (Yahoo Finance, 2020). As we know, several methods can be used for doing
financial analysis whereas most common methods are common size analysis as well as ratio
analysis. It is because, both the aforementioned analyses provide a clear image of the
organization’s market position while considering its position post one year of operation
(British Airways, 2020). Apart from this, financial analysis of the BA will state stability as
well as the health of the company in the airline industry. However, there is a limitation of
financial analysis suggesting that info and data used in this analysis are majorly based on
3
British Airways
Introduction
The paper is contained an analysis of the financial reports of British Airways. The company
belongs to the airline industry which is an ever-changing industry all across the globe. It has
been found that globalization, market conditions and novel technologies have given all
support to the airline industry of this era. Apart from this, it has been seen that the airline
industry is being protected by so many international and national policies and agreements.
The chosen industry is a competitive market where comfort and cost are always balanced for
greater customer satisfaction as well as revenue. The international airline market is hugely
cost-sensitive because of the competitors, fuel rate surge and customer demands (Chang et
al., 2019).
In general, British Airways Plc. (BA) is the leading airways in Europe and Britain. Moreover,
BA is the largest airways of the UK while also being the leading luxury airways of the whole
world. It is worth knowing that BA is operating their major businesses in Gatwick, Heathrow
and London (IAG, 2019). Apart from this, the airline company BA is serving more than 1000
destinations all over the 500 nations. In addition, BA is the alliance member while serving a
network of more than 600 airports across the globe. The BA was first founded in 1974 and
later than spent millions of dollars on launching a new plan as well as strategies for serving
global customers in the best possible way. In this report, financial analysis is going to be
demonstrated being an effective way of evaluating the company’s performance prior making
decision in business (Zenwealth.com, 2019).
Financial analysis is often used by creditors, stakeholders and investors worldwide. Thus, it
has been found that there is a need for investigating the financial statements of the airline
company BA (Yahoo Finance, 2020). As we know, several methods can be used for doing
financial analysis whereas most common methods are common size analysis as well as ratio
analysis. It is because, both the aforementioned analyses provide a clear image of the
organization’s market position while considering its position post one year of operation
(British Airways, 2020). Apart from this, financial analysis of the BA will state stability as
well as the health of the company in the airline industry. However, there is a limitation of
financial analysis suggesting that info and data used in this analysis are majorly based on
Paraphrase This Document
Need a fresh take? Get an instant paraphrase of this document with our AI Paraphraser
CORPORTATE FINANCIAL MANAGEMENT
4
external info offered by the organization. Thus, this financial reporting analysis is containing
all possible desirable characteristics of BA while summarizing key findings in the later
section.
A brief description of the company
In the financial reporting, the chosen organization for the detailed analysis is BA which is a
leading airline company currently. The BA is based on Heathrow Airport of the UK and it is
the largest global airline of the native country. In this context, this company deals with both
international and domestic carriage of freight, mail and ancillary services. The company was
privatized in the year 1987 (Tsui et al., 2019). It is known as the UK’s biggest global
scheduled airline as well as the globe’s leading international airline services. It is worth
knowing that BA’s hub of business in London and specifically at London City and Heathrow,
Gatwick airports. According to the IAG reports, BA is indulged into codeshare, joint business
and franchise partners while operating as the most extensive scheduled airline network of the
world. Apart from this, BA is typically operating as the founding member of the Oneworld
alliance. The BA’s member airlines presently serve around 1000 destinations all over the 150
countries. During the year ended 31st December 2018, BA operated on average 294 aircraft
while carrying around 46 million consumers to all across 200 destinations worldwide (Yahoo
Finance, 2020). Moreover, it has been observed that BA employs an average of 42,000
people worldwide. In addition to that, BA’s vision is to become the airline of choice with
personalized airline services, unique British style, exceptional stability and a digital mindset.
Recently, the airline company has celebrated its 100th anniversary on 25th August 2019. In
this way, the chosen airline is capable to trace their origins back to the birth of civil aviation
(Tsui et al., 2019).
In the context of management review, it can be said that the total revenue of the BA was
£13,021 million, up 6.1% (2017: £12,271 million). It has been found that BA always invests
in the processes for improving cost competitiveness, customers’ experiences, capital
efficiency, reliable and safe operations, and developing employees. In this context,
connectivity and inflight connectivity are the qualities that are emerging as an increasingly
critical factor for the modern passengers and it is vital for driving BA’s passengers' loyalty
(Yahoo Finance, 2020). In addition to that, during 2018, BA has welcomed the millionth
customer with the first wing at the Terminal 5. Apart from this, BA has recently opened
CORPORTATE FINANCIAL MANAGEMENT
5
innovative and completely new lounges in Aberdeen, Rome and New York’s JFK Airport
(Cashflow, 2019).
Corporate Governance
From the corporate governance perspective, BA is highly committed to high standards of
sustainable practices and quality standards. Generally, corporate governance includes a set of
connections that are focusing on a business’s investors, panel, management and stakeholders
(Anum, 2018). The BA is well-managed and it shows a decent corporate governance level.
Moreover, BA’s corporate governance is a combination of several processes, practices and
rules of the company that are directed as well as controlled by the company. It has been found
that the corporate governance of the company depends on the policies in relation to society
and the environment of an organization. Thus, in relation to BA, policies available in the
annual report have been assessed which explained well-planned strategies and planning in
favour of the environment and society (Beck et al., 2010).
Financial performance
In this context, generally financial performance is known as the act of accomplishing
financial activities. Apart from this, financial performance is used to analyse the degree to
which financial objectives have been achieved (Assetratio, 2019). Thus, financial
performance is the process of measuring the results of an organization’s policies as well as
operations into monetary terms. In this context, financial statements are the formal records of
the financial activities along with the position of any business, individual or any other entity.
In a financial performance, all the relevant financial information is available in a structured
manner which is well-illustrated. There are some basic measures of financial performance
include accounting ratios. In this financial reporting, ratio analysis will be used for showing
the financial performance of the BA Company (British Airways, 2020). Here, financial ratios
are the major indicators of the financial performance of the BA. Thus, financial ratios are
getting derived by using the three statements including cash flows, income statement and
balance sheets. In this context, financial ratios will be helping for analysing the BA’s
liquidity, financial stability, assumed risks and profitability in an effective manner (Baxter,
2019).
British Airways Financial Ratio Analysis for the years 2014-2018
Description Formula British Airways Financial Ratio Analysis
⊘ This is a preview!⊘
Do you want full access?
Subscribe today to unlock all pages.
Trusted by 1+ million students worldwide
CORPORTATE FINANCIAL MANAGEMENT
6
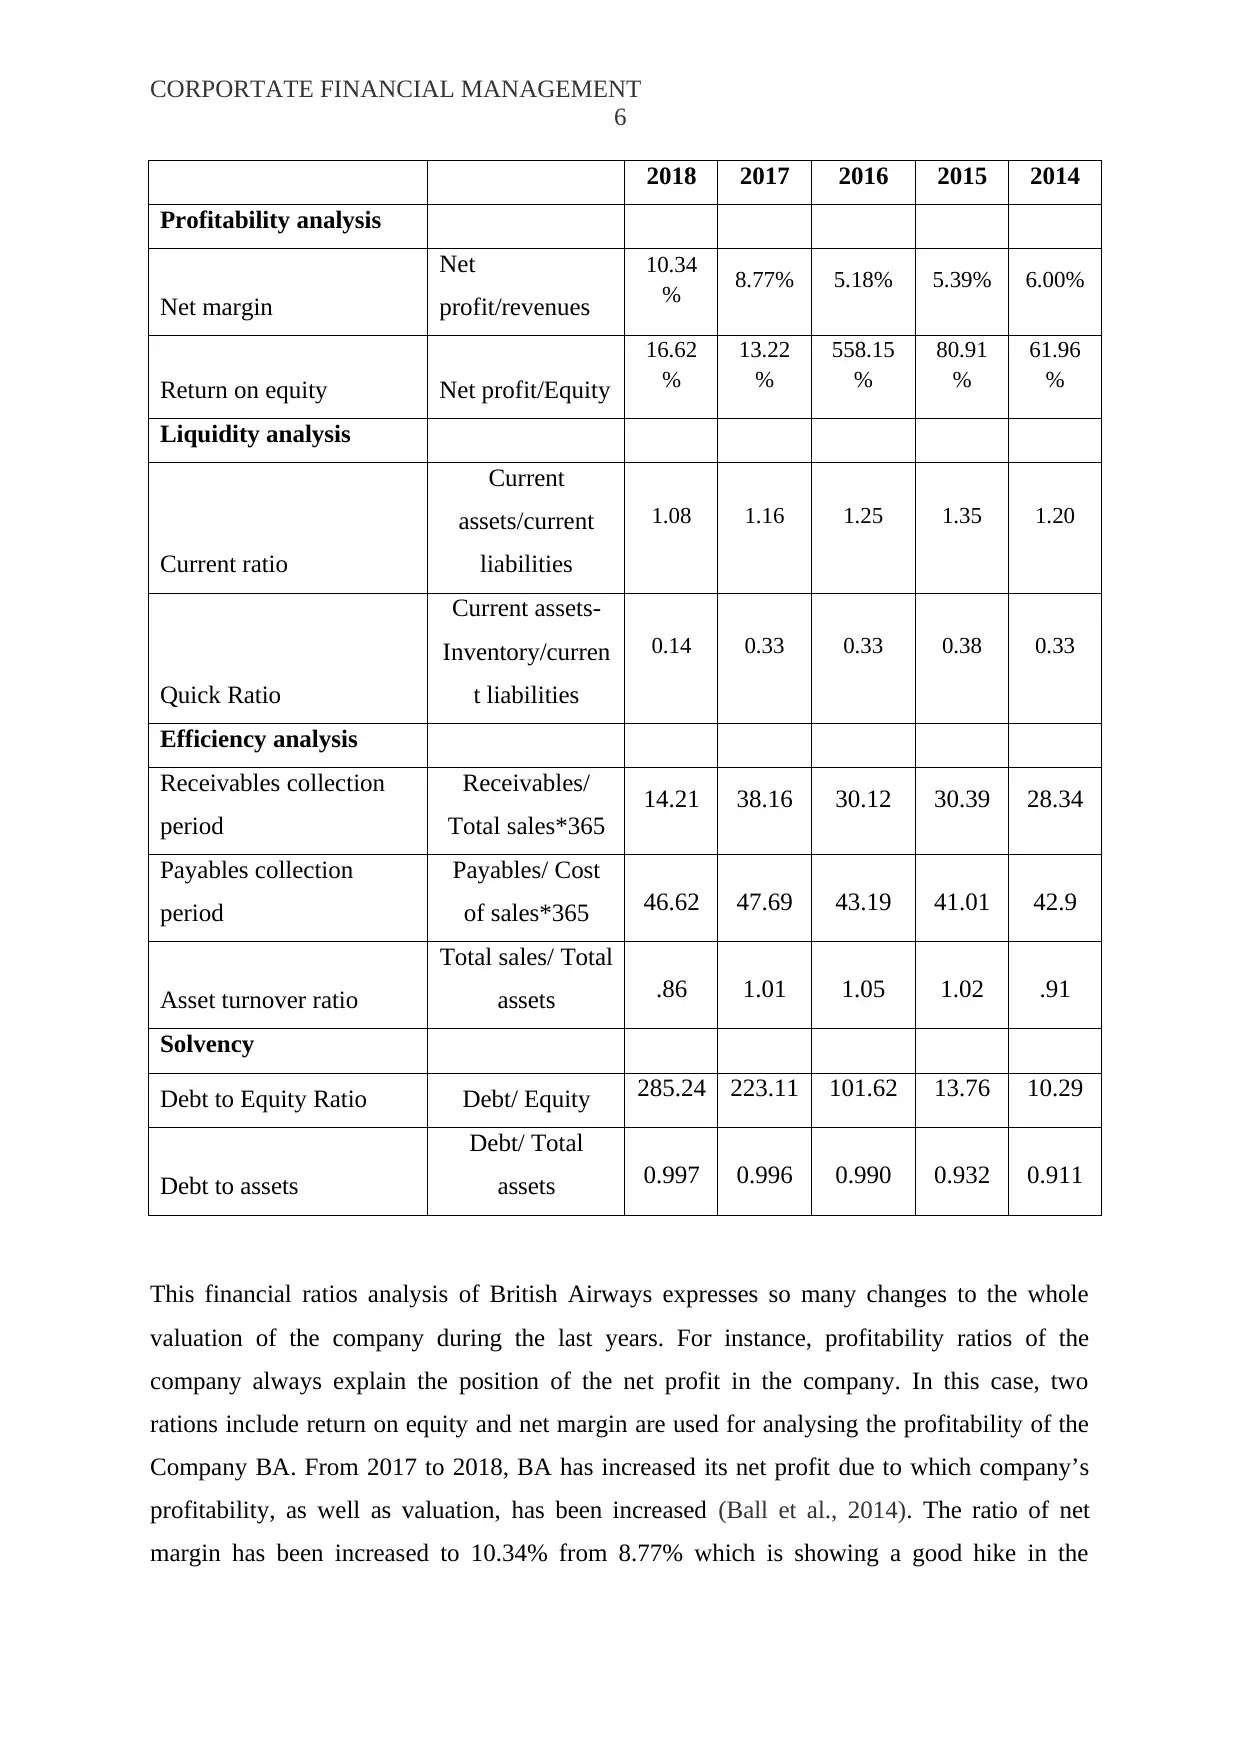
2018 2017 2016 2015 2014
Profitability analysis
Net margin
Net
profit/revenues
10.34
% 8.77% 5.18% 5.39% 6.00%
Return on equity Net profit/Equity
16.62
%
13.22
%
558.15
%
80.91
%
61.96
%
Liquidity analysis
Current ratio
Current
assets/current
liabilities
1.08 1.16 1.25 1.35 1.20
Quick Ratio
Current assets-
Inventory/curren
t liabilities
0.14 0.33 0.33 0.38 0.33
Efficiency analysis
Receivables collection
period
Receivables/
Total sales*365
14.21 38.16 30.12 30.39 28.34
Payables collection
period
Payables/ Cost
of sales*365 46.62 47.69 43.19 41.01 42.9
Asset turnover ratio
Total sales/ Total
assets .86 1.01 1.05 1.02 .91
Solvency
Debt to Equity Ratio Debt/ Equity 285.24 223.11 101.62 13.76 10.29
Debt to assets
Debt/ Total
assets 0.997 0.996 0.990 0.932 0.911
This financial ratios analysis of British Airways expresses so many changes to the whole
valuation of the company during the last years. For instance, profitability ratios of the
company always explain the position of the net profit in the company. In this case, two
rations include return on equity and net margin are used for analysing the profitability of the
Company BA. From 2017 to 2018, BA has increased its net profit due to which company’s
profitability, as well as valuation, has been increased (Ball et al., 2014). The ratio of net
margin has been increased to 10.34% from 8.77% which is showing a good hike in the
6
2018 2017 2016 2015 2014
Profitability analysis
Net margin
Net
profit/revenues
10.34
% 8.77% 5.18% 5.39% 6.00%
Return on equity Net profit/Equity
16.62
%
13.22
%
558.15
%
80.91
%
61.96
%
Liquidity analysis
Current ratio
Current
assets/current
liabilities
1.08 1.16 1.25 1.35 1.20
Quick Ratio
Current assets-
Inventory/curren
t liabilities
0.14 0.33 0.33 0.38 0.33
Efficiency analysis
Receivables collection
period
Receivables/
Total sales*365
14.21 38.16 30.12 30.39 28.34
Payables collection
period
Payables/ Cost
of sales*365 46.62 47.69 43.19 41.01 42.9
Asset turnover ratio
Total sales/ Total
assets .86 1.01 1.05 1.02 .91
Solvency
Debt to Equity Ratio Debt/ Equity 285.24 223.11 101.62 13.76 10.29
Debt to assets
Debt/ Total
assets 0.997 0.996 0.990 0.932 0.911
This financial ratios analysis of British Airways expresses so many changes to the whole
valuation of the company during the last years. For instance, profitability ratios of the
company always explain the position of the net profit in the company. In this case, two
rations include return on equity and net margin are used for analysing the profitability of the
Company BA. From 2017 to 2018, BA has increased its net profit due to which company’s
profitability, as well as valuation, has been increased (Ball et al., 2014). The ratio of net
margin has been increased to 10.34% from 8.77% which is showing a good hike in the
Paraphrase This Document
Need a fresh take? Get an instant paraphrase of this document with our AI Paraphraser
CORPORTATE FINANCIAL MANAGEMENT
7
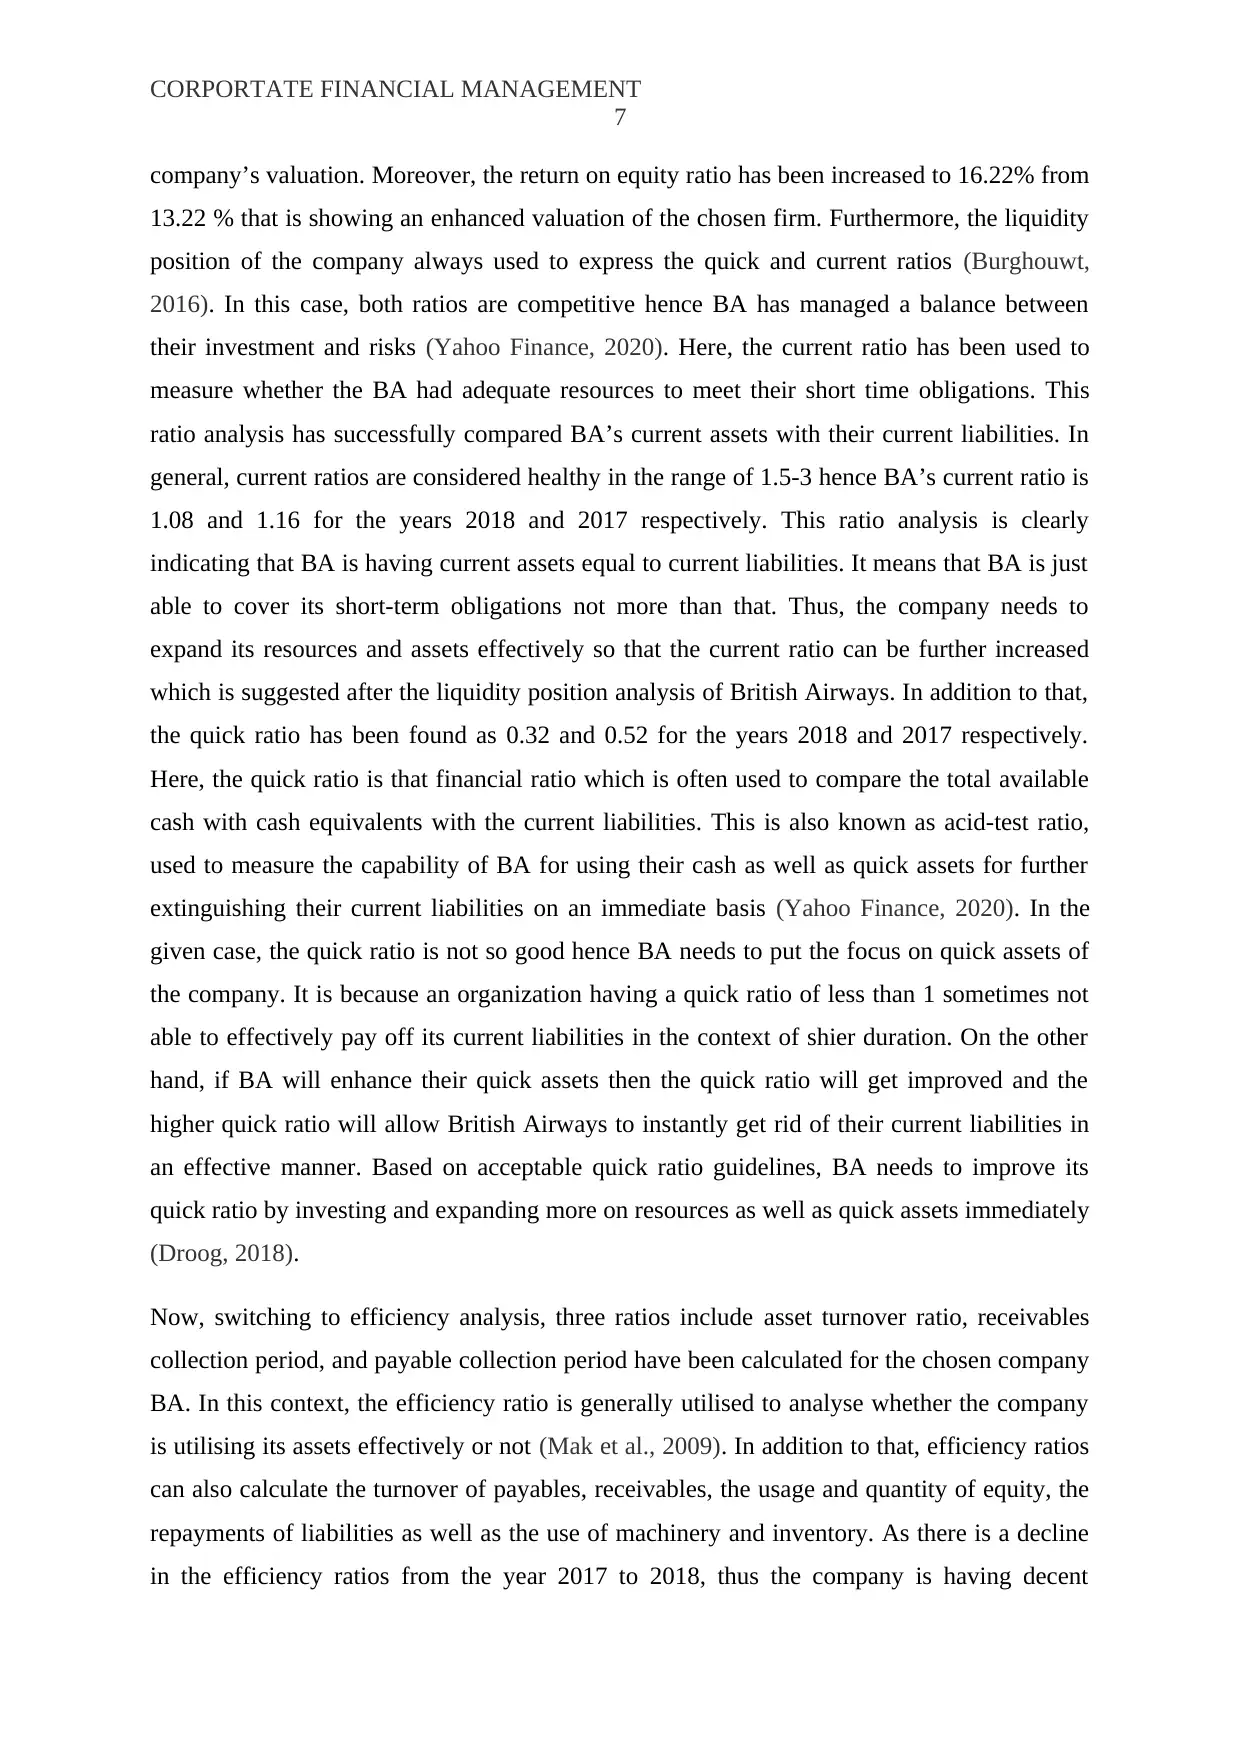
company’s valuation. Moreover, the return on equity ratio has been increased to 16.22% from
13.22 % that is showing an enhanced valuation of the chosen firm. Furthermore, the liquidity
position of the company always used to express the quick and current ratios (Burghouwt,
2016). In this case, both ratios are competitive hence BA has managed a balance between
their investment and risks (Yahoo Finance, 2020). Here, the current ratio has been used to
measure whether the BA had adequate resources to meet their short time obligations. This
ratio analysis has successfully compared BA’s current assets with their current liabilities. In
general, current ratios are considered healthy in the range of 1.5-3 hence BA’s current ratio is
1.08 and 1.16 for the years 2018 and 2017 respectively. This ratio analysis is clearly
indicating that BA is having current assets equal to current liabilities. It means that BA is just
able to cover its short-term obligations not more than that. Thus, the company needs to
expand its resources and assets effectively so that the current ratio can be further increased
which is suggested after the liquidity position analysis of British Airways. In addition to that,
the quick ratio has been found as 0.32 and 0.52 for the years 2018 and 2017 respectively.
Here, the quick ratio is that financial ratio which is often used to compare the total available
cash with cash equivalents with the current liabilities. This is also known as acid-test ratio,
used to measure the capability of BA for using their cash as well as quick assets for further
extinguishing their current liabilities on an immediate basis (Yahoo Finance, 2020). In the
given case, the quick ratio is not so good hence BA needs to put the focus on quick assets of
the company. It is because an organization having a quick ratio of less than 1 sometimes not
able to effectively pay off its current liabilities in the context of shier duration. On the other
hand, if BA will enhance their quick assets then the quick ratio will get improved and the
higher quick ratio will allow British Airways to instantly get rid of their current liabilities in
an effective manner. Based on acceptable quick ratio guidelines, BA needs to improve its
quick ratio by investing and expanding more on resources as well as quick assets immediately
(Droog, 2018).
Now, switching to efficiency analysis, three ratios include asset turnover ratio, receivables
collection period, and payable collection period have been calculated for the chosen company
BA. In this context, the efficiency ratio is generally utilised to analyse whether the company
is utilising its assets effectively or not (Mak et al., 2009). In addition to that, efficiency ratios
can also calculate the turnover of payables, receivables, the usage and quantity of equity, the
repayments of liabilities as well as the use of machinery and inventory. As there is a decline
in the efficiency ratios from the year 2017 to 2018, thus the company is having decent
7
company’s valuation. Moreover, the return on equity ratio has been increased to 16.22% from
13.22 % that is showing an enhanced valuation of the chosen firm. Furthermore, the liquidity
position of the company always used to express the quick and current ratios (Burghouwt,
2016). In this case, both ratios are competitive hence BA has managed a balance between
their investment and risks (Yahoo Finance, 2020). Here, the current ratio has been used to
measure whether the BA had adequate resources to meet their short time obligations. This
ratio analysis has successfully compared BA’s current assets with their current liabilities. In
general, current ratios are considered healthy in the range of 1.5-3 hence BA’s current ratio is
1.08 and 1.16 for the years 2018 and 2017 respectively. This ratio analysis is clearly
indicating that BA is having current assets equal to current liabilities. It means that BA is just
able to cover its short-term obligations not more than that. Thus, the company needs to
expand its resources and assets effectively so that the current ratio can be further increased
which is suggested after the liquidity position analysis of British Airways. In addition to that,
the quick ratio has been found as 0.32 and 0.52 for the years 2018 and 2017 respectively.
Here, the quick ratio is that financial ratio which is often used to compare the total available
cash with cash equivalents with the current liabilities. This is also known as acid-test ratio,
used to measure the capability of BA for using their cash as well as quick assets for further
extinguishing their current liabilities on an immediate basis (Yahoo Finance, 2020). In the
given case, the quick ratio is not so good hence BA needs to put the focus on quick assets of
the company. It is because an organization having a quick ratio of less than 1 sometimes not
able to effectively pay off its current liabilities in the context of shier duration. On the other
hand, if BA will enhance their quick assets then the quick ratio will get improved and the
higher quick ratio will allow British Airways to instantly get rid of their current liabilities in
an effective manner. Based on acceptable quick ratio guidelines, BA needs to improve its
quick ratio by investing and expanding more on resources as well as quick assets immediately
(Droog, 2018).
Now, switching to efficiency analysis, three ratios include asset turnover ratio, receivables
collection period, and payable collection period have been calculated for the chosen company
BA. In this context, the efficiency ratio is generally utilised to analyse whether the company
is utilising its assets effectively or not (Mak et al., 2009). In addition to that, efficiency ratios
can also calculate the turnover of payables, receivables, the usage and quantity of equity, the
repayments of liabilities as well as the use of machinery and inventory. As there is a decline
in the efficiency ratios from the year 2017 to 2018, thus the company is having decent
CORPORTATE FINANCIAL MANAGEMENT
8
efficiency ratios. Here, the value of the receivables collection period is 80.46 and 66.05
respectively. It is showing that ratio is measuring cash flow which is typically calculated
through dividing average receivables by using credit sales per day. Thus, this ratio of
receivables collection period has been calculated and it is having a decreased value which
shows that there are fewer receivables if the company in the current market (Coller et al.,
2016).
For BA, the payables collection period value has been found as 46.62 and 47.69 for the
year 2018 and 2017 respectively. It is showing a clear declining graph from the year 2017 to
2018. This ratio is the days' sales in accounts receivable. In this case, this payable ratio has
been calculated by finding average accounts payable and subtracting the accounts payable
balance initially from the accounts payable balance available at the end of the period. The
payable collection ratio of BA is indicating that how many times BA pays off the suppliers in
the accounting duration. The value of 46.62 for the payable turnover ratio is clearly showing
that BA’s payables are being paid more quickly hence this ratio can further be increased in
the future. As of now, the value of this ratio is good for the valuation and performance of the
company (Lin et al., 2018). In addition to that, the asset turnover ratio is also known as
efficiency ratio which refers to the company’s capability to produce sales with the help of
their assets through comparing net sales with the average number of assets. It is well aware
that the asset turnover ratio is often used to measure the productivity and efficiency of the
company hence higher asset turnover ratio shows enhanced efficiency of a company. The
ratio has been found as 0.86 and 1.01 for the two consecutive years which shows that the
asset turnover of the BA is not so good. The company needs to improve it by using its assets
in an effective manner for further generating a good number of sales. In addition, the
solvency position of the company has been found with the two major ratios include debt to
equity ratio and debt to asset ratio which is found as 1.86 and 1.48 for the years 2018 and
2017 respectively. Based on solvency position analysis it can be said that debt to equity ratio
has the related proportion of shareholders’ equity and debt which has been used to fund a
company’s assets. In this context, a good value of debt to equity ratio lays in the range of 1-
1.5 not more than that. Hence, the interpretation of the ratio suggests that BA is using more
debt financing than others which is good in the short-term but in the long-term it is not. Thus,
the debt to equity ratio was acceptable in the year 2017 which has been increased to 1.8 in the
year 2018. Thus, BA needs to decrease its debt as a comparison to shareholders’ equity.
Furthermore, debt to asset ratio for BA has been found as 0.997 and 0.996 for the years 2018
⊘ This is a preview!⊘
Do you want full access?
Subscribe today to unlock all pages.
Trusted by 1+ million students worldwide
CORPORTATE FINANCIAL MANAGEMENT
9
and 2017 respectively. In this context, British Airways is maintaining its debt to asset ratio in
both years include 2017 and 2018.
As we know, debt to asset ratio is clearly indicating the total assets which are financed by
creditors of the company instead of the company’s investors. Thus, the ratio should always be
less than 1 for the Company BA; hence the ratio of 0.99 is showing the company’s greater
efficiency towards assets and lesser debt in the market. Thus, it is showing that the company
is doing well in terms of debt to asset ratio.
Risk profile
In the context of risk profile, it is the technique with which the companies can evaluate their
risks associated with business development. In this context, the risk profile is the evaluation
process of an individual’s ability and willingness to take risks (Lange et al., 2015). Thus, risk
profile evaluation for BA is necessary to determine a proper investment asset allocation for
any specific portfolio (Yahoo Finance, 2020).
Based on the above risk profile analysis, contribution margin ratio is found as 0.80 which is
the difference amid an organization’s variable expenses and sales. It is often expressed in
percentage, hence in the case of BA, it is found as 80%. In general, a good contribution
margin ratio is near around 100% because the higher the contribution margin ratio, the
9
and 2017 respectively. In this context, British Airways is maintaining its debt to asset ratio in
both years include 2017 and 2018.
As we know, debt to asset ratio is clearly indicating the total assets which are financed by
creditors of the company instead of the company’s investors. Thus, the ratio should always be
less than 1 for the Company BA; hence the ratio of 0.99 is showing the company’s greater
efficiency towards assets and lesser debt in the market. Thus, it is showing that the company
is doing well in terms of debt to asset ratio.
Risk profile
In the context of risk profile, it is the technique with which the companies can evaluate their
risks associated with business development. In this context, the risk profile is the evaluation
process of an individual’s ability and willingness to take risks (Lange et al., 2015). Thus, risk
profile evaluation for BA is necessary to determine a proper investment asset allocation for
any specific portfolio (Yahoo Finance, 2020).
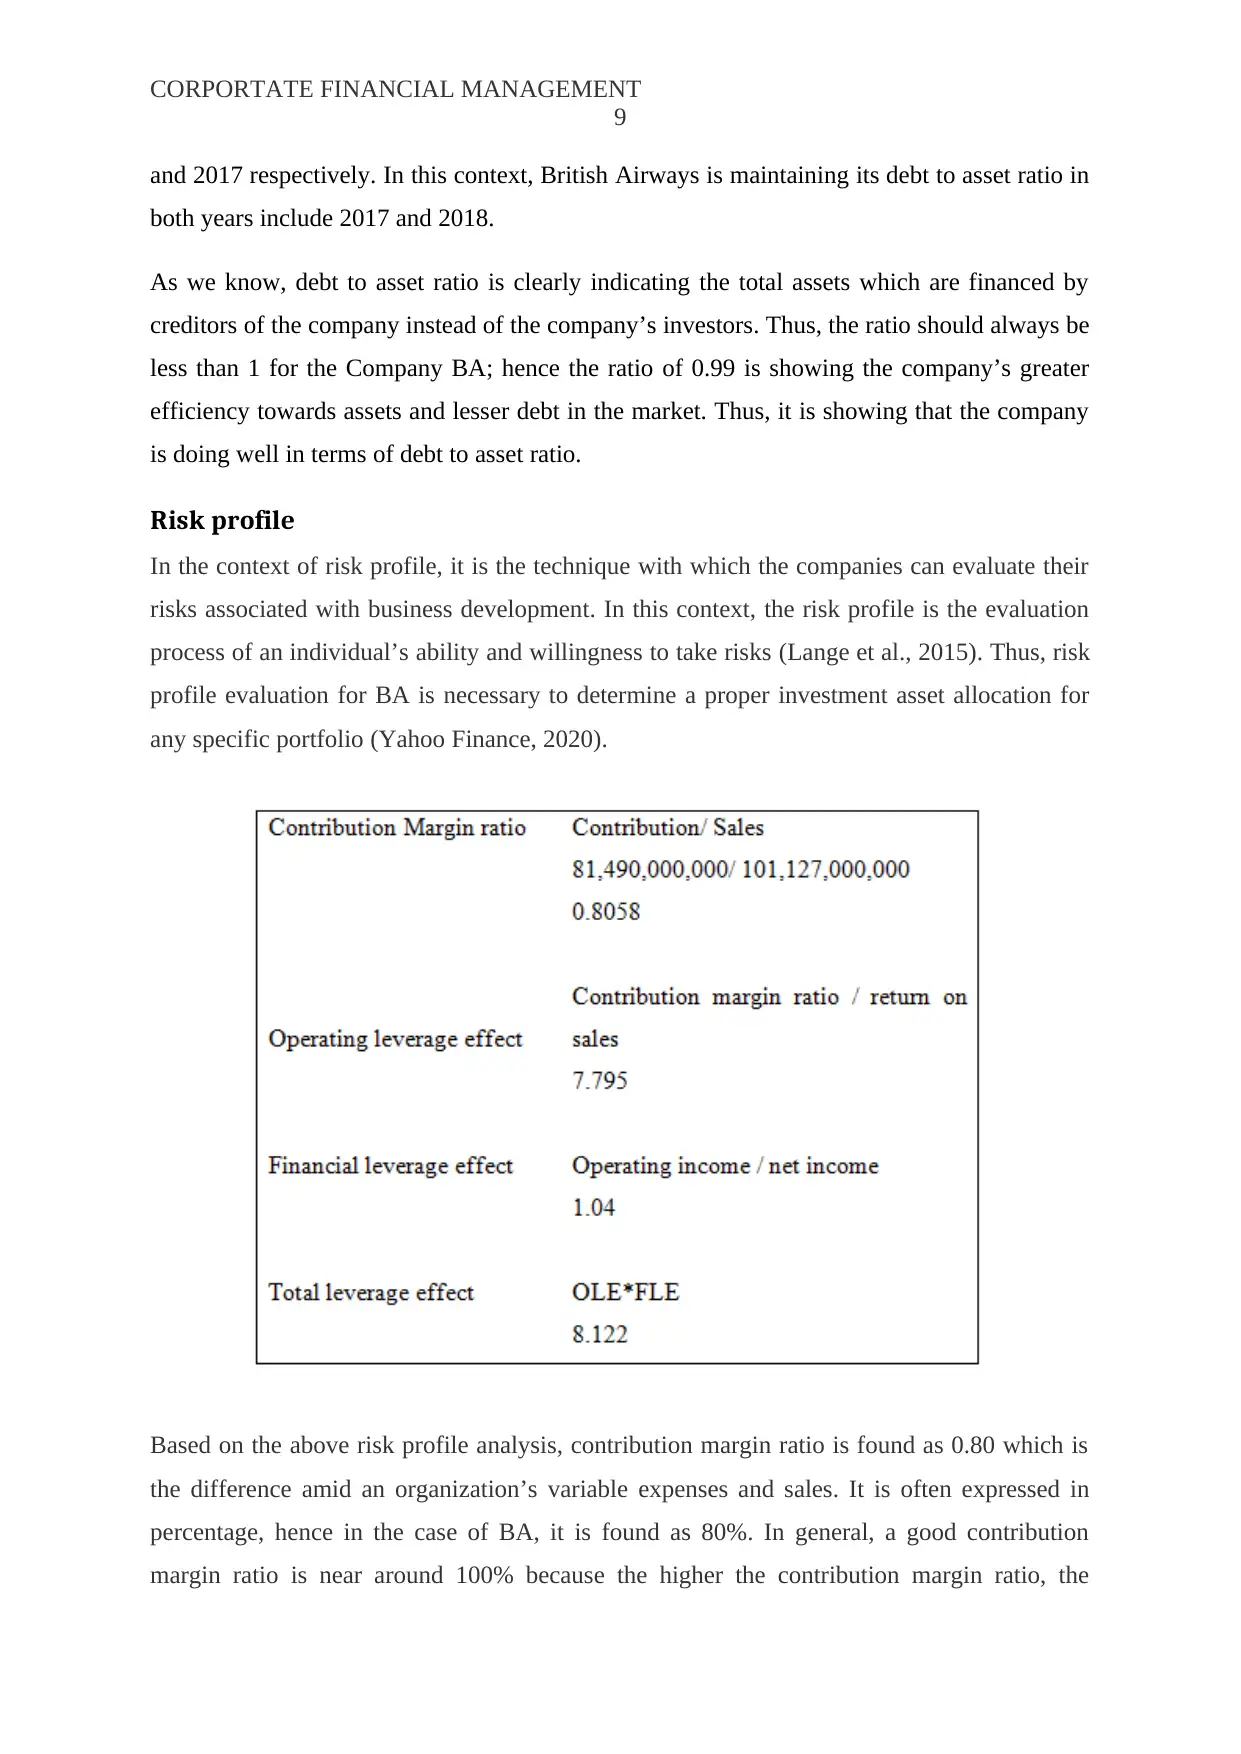
Based on the above risk profile analysis, contribution margin ratio is found as 0.80 which is
the difference amid an organization’s variable expenses and sales. It is often expressed in
percentage, hence in the case of BA, it is found as 80%. In general, a good contribution
margin ratio is near around 100% because the higher the contribution margin ratio, the
Paraphrase This Document
Need a fresh take? Get an instant paraphrase of this document with our AI Paraphraser
CORPORTATE FINANCIAL MANAGEMENT
10
greater the money is available for covering any business’s overhead expenses as well as fixed
costs. Thus, the 80% contribution margin ratio is showing that BA can effectively cover the
costs of creating the products and thereby produces a profit (Yahoo Finance, 2020).
Moreover, the calculated value of operating leverage is measuring how BA’s operating
income changes post a % change in their sales. In this context, a higher degree of operating
leverage forms added sensitivity to changes in revenue (Kuran & Novak, 2018). In this way,
enhanced sensitive operating leverage is often considered riskier due to the fact that it implies
that current profit margins are less secure moving into the future. The calculated result is
7.795 which is clearly indicating that the company is working with high risks and it has to be
reduced. While talking about the financial leverage effect ratio, it can be interpreted that
value calculated as 1.04 is not so bad. As the financial leverage ratio typically helps to
determine the overall effect of debt on the whole profitability of the chosen firm hence the
value of 1.04 is neither high nor low. It means that the average value of the financial leverage
ratio indicates moderate fixed cost investment in the BA’s business (Kaynak &
Kucukemiroglu, 2015). Thus, a total leverage effect is calculated as 8.122 which is higher
because of the operating leverage effect. Therefore, BA needs to work on minimizing their
operating leverage effect for minimizing the overall risks into the business operations of the
company.
Optimality of capital structure choices
Calculation of capital structure for years 2014-2018
Particulars 2018 2017 2016 2015 2014
Debt 116,949,000,000
91,921,000,0
00
89,120,00
0,000
88,011,00
0,000
90,408,00
0,000
Equity
62,8
80,000,000
61,960,0
00,000
877,000,0
00
6,397,000,
000
8,790,000,
000
Total
62,8
80,000,000
61,960,0
00,000
877,000,0
00
6,397,000,
000
8,790,000,
000
Debt % 185.9875954 148.3553906
10161.915
62
1375.8167
89
1028.5324
23
Equity % 100 100 100 100 100
EBIT 11,801,000,000
10,053,000,00
0
5,538,000,0
00
7,170,000,0
00
7,196,000,0
00
EBT 11326000000.00
9693000000.
00
55380000
00.00
71700000
00.00
71960000
00.00
475000000. 360000000.
EPS 7.38 7.44 7.83 13.85 17.85
intrinsic
value 139.482 140.616 147.987 261.765 337.365
10
greater the money is available for covering any business’s overhead expenses as well as fixed
costs. Thus, the 80% contribution margin ratio is showing that BA can effectively cover the
costs of creating the products and thereby produces a profit (Yahoo Finance, 2020).
Moreover, the calculated value of operating leverage is measuring how BA’s operating
income changes post a % change in their sales. In this context, a higher degree of operating
leverage forms added sensitivity to changes in revenue (Kuran & Novak, 2018). In this way,
enhanced sensitive operating leverage is often considered riskier due to the fact that it implies
that current profit margins are less secure moving into the future. The calculated result is
7.795 which is clearly indicating that the company is working with high risks and it has to be
reduced. While talking about the financial leverage effect ratio, it can be interpreted that
value calculated as 1.04 is not so bad. As the financial leverage ratio typically helps to
determine the overall effect of debt on the whole profitability of the chosen firm hence the
value of 1.04 is neither high nor low. It means that the average value of the financial leverage
ratio indicates moderate fixed cost investment in the BA’s business (Kaynak &
Kucukemiroglu, 2015). Thus, a total leverage effect is calculated as 8.122 which is higher
because of the operating leverage effect. Therefore, BA needs to work on minimizing their
operating leverage effect for minimizing the overall risks into the business operations of the
company.
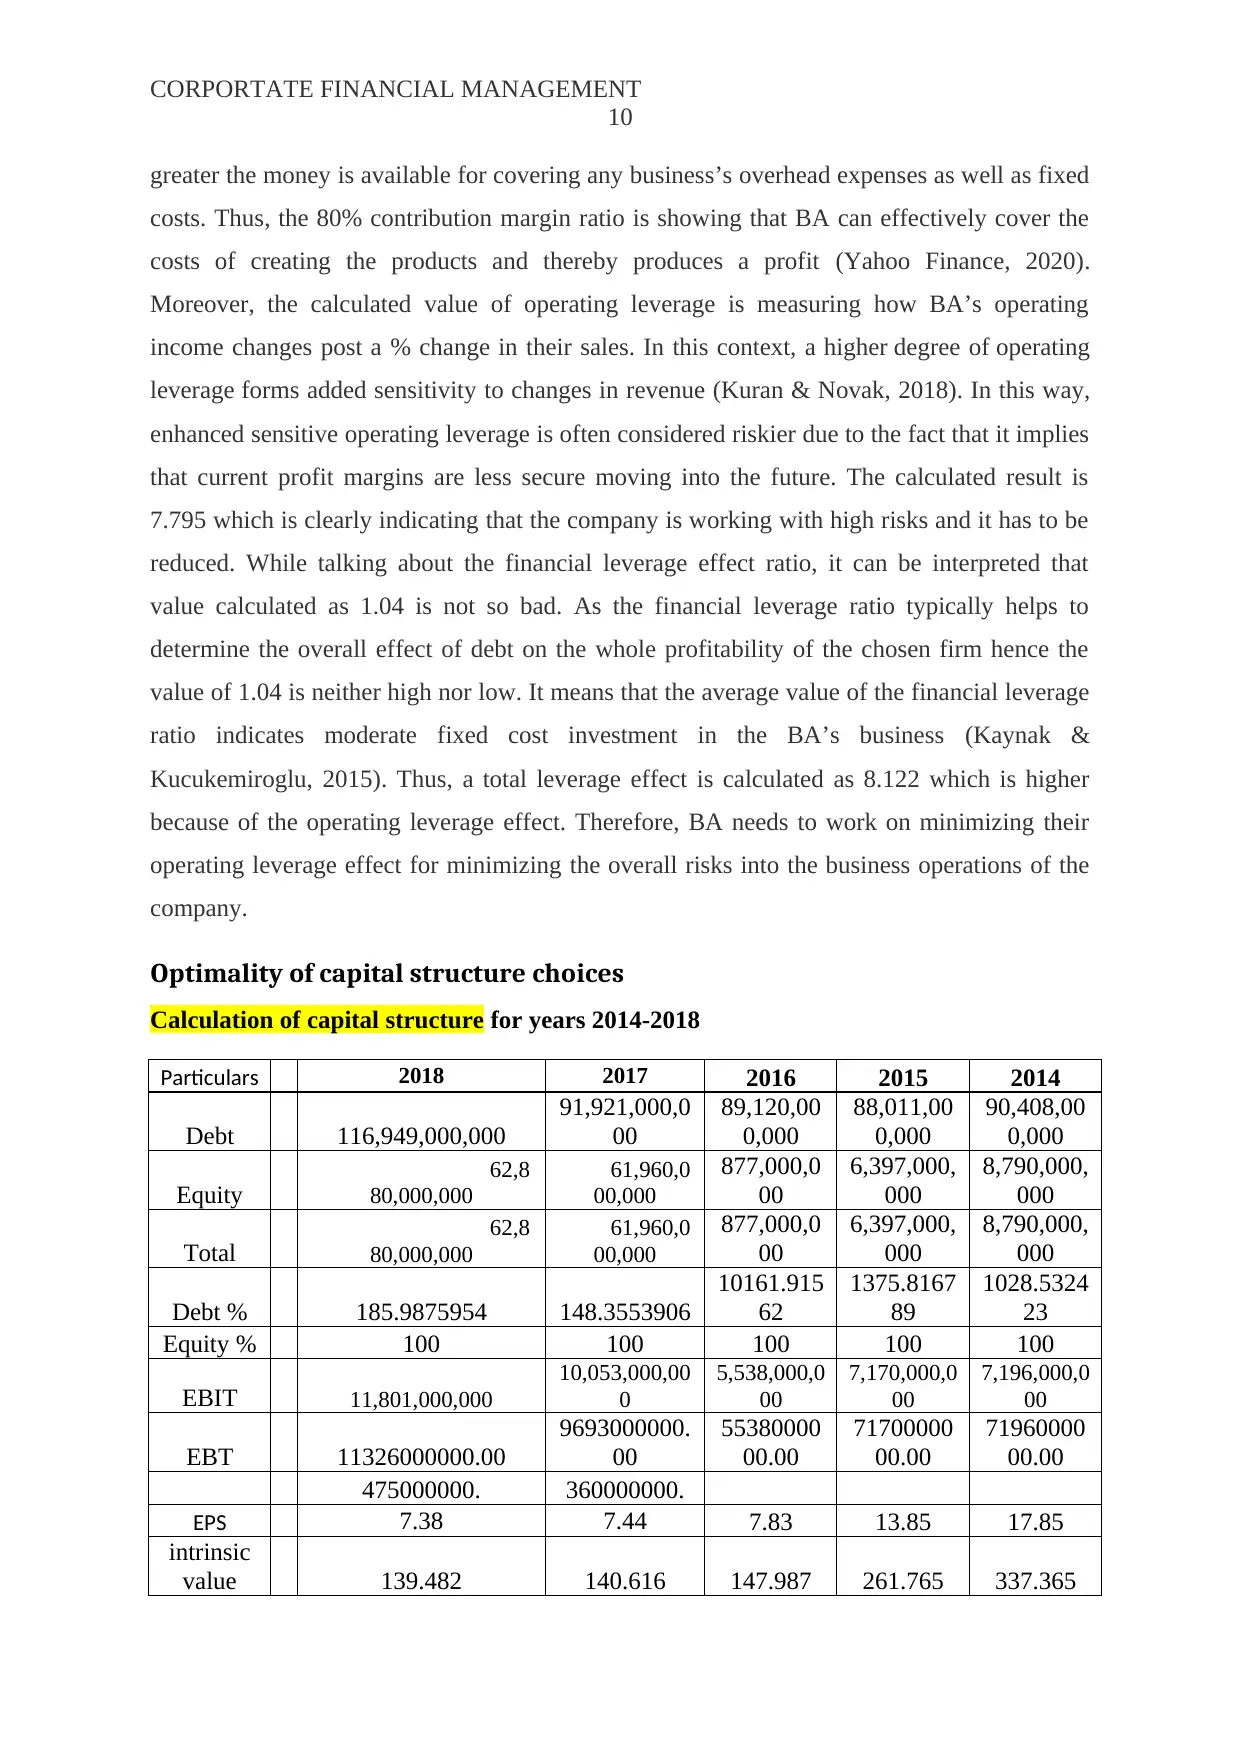
Optimality of capital structure choices
Calculation of capital structure for years 2014-2018
Particulars 2018 2017 2016 2015 2014
Debt 116,949,000,000
91,921,000,0
00
89,120,00
0,000
88,011,00
0,000
90,408,00
0,000
Equity
62,8
80,000,000
61,960,0
00,000
877,000,0
00
6,397,000,
000
8,790,000,
000
Total
62,8
80,000,000
61,960,0
00,000
877,000,0
00
6,397,000,
000
8,790,000,
000
Debt % 185.9875954 148.3553906
10161.915
62
1375.8167
89
1028.5324
23
Equity % 100 100 100 100 100
EBIT 11,801,000,000
10,053,000,00
0
5,538,000,0
00
7,170,000,0
00
7,196,000,0
00
EBT 11326000000.00
9693000000.
00
55380000
00.00
71700000
00.00
71960000
00.00
475000000. 360000000.
EPS 7.38 7.44 7.83 13.85 17.85
intrinsic
value 139.482 140.616 147.987 261.765 337.365
CORPORTATE FINANCIAL MANAGEMENT
11
Generally, the capital structure can be seen as the evaluation technique that is used to
calculate the equity, total assets and debt of an organization. In this context, the capital
structure of the Company BA has been analysed for determining the suitable risks as well as
returns in the organization. Here, capital structure is often evaluated by the financial analyst
or the administration of the chosen firm. Thus, a better capital structure of the BA would
show a better valuation of the company (Karami, 2017). Therefore, for calculating the
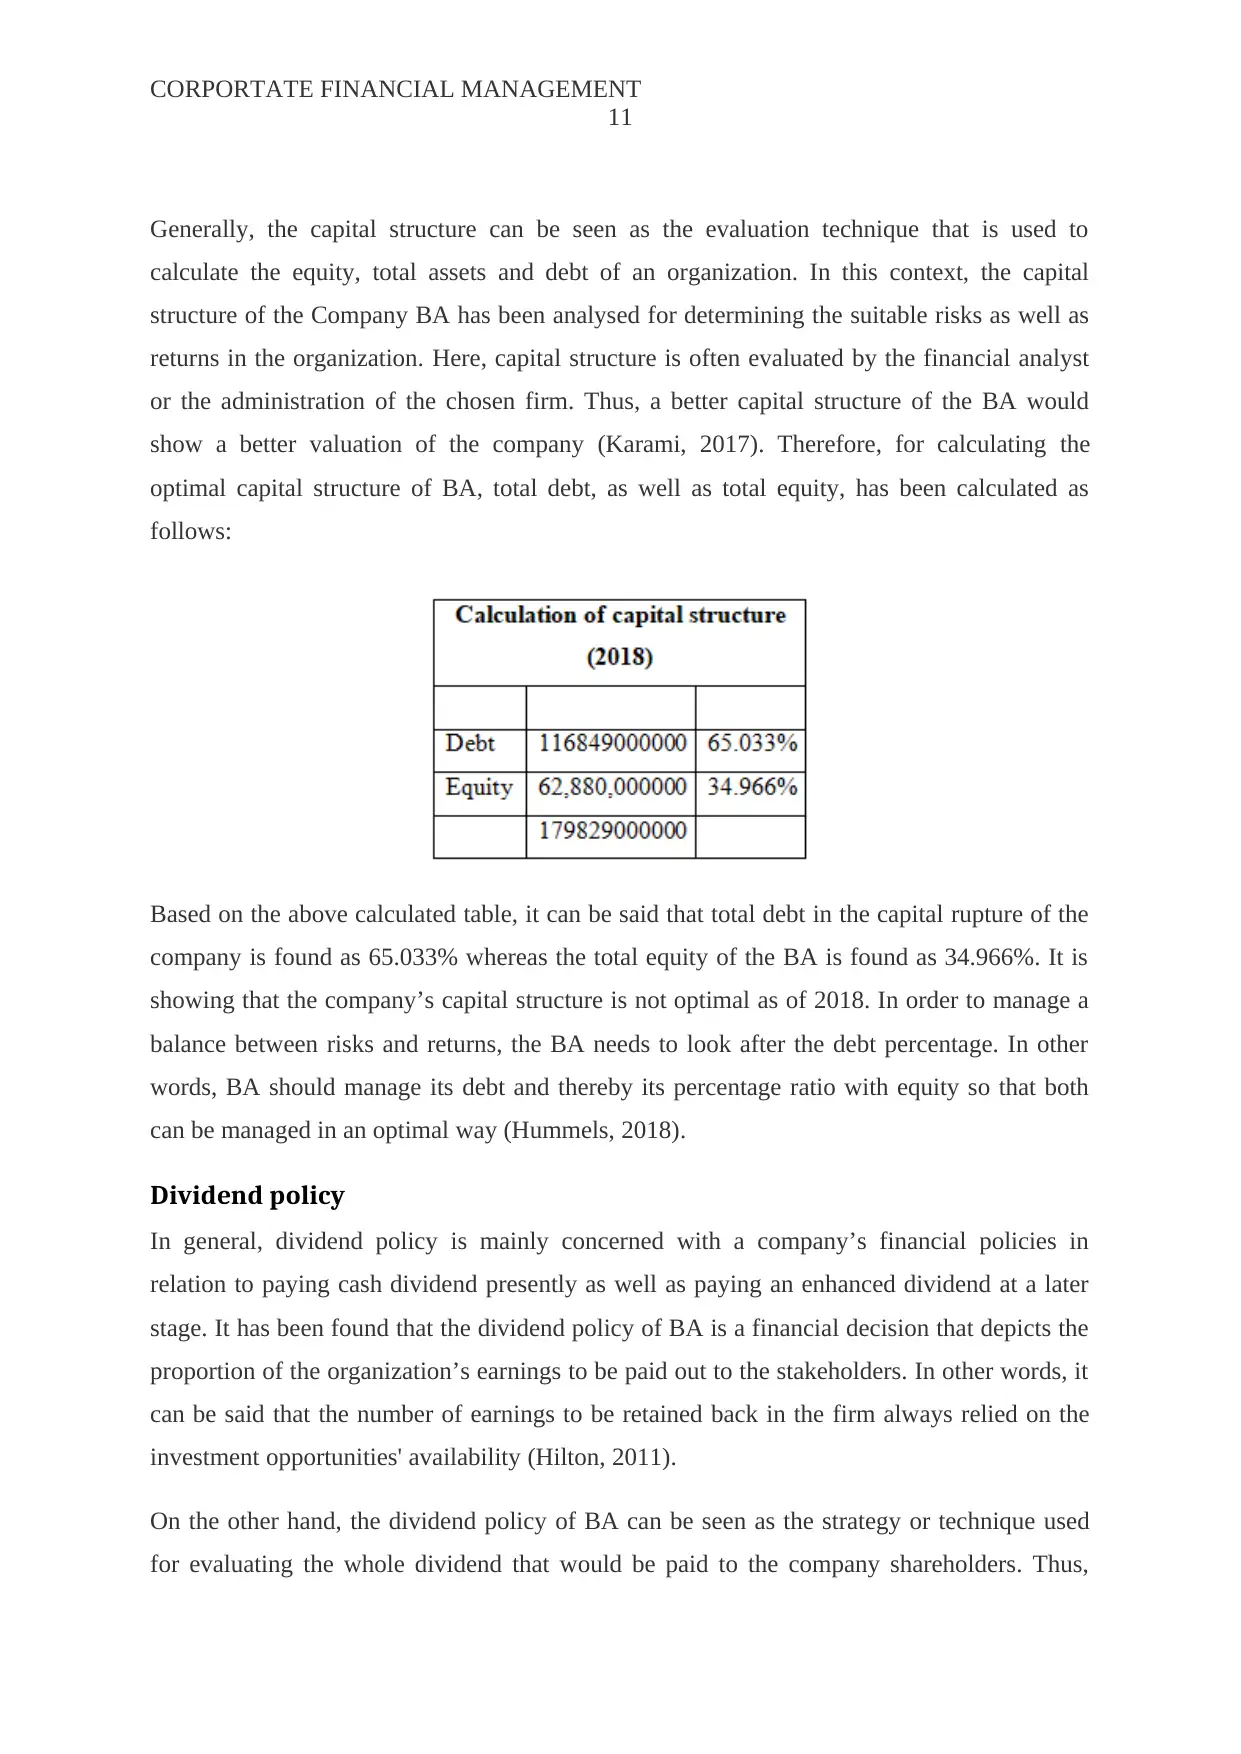
optimal capital structure of BA, total debt, as well as total equity, has been calculated as
follows:
Based on the above calculated table, it can be said that total debt in the capital rupture of the
company is found as 65.033% whereas the total equity of the BA is found as 34.966%. It is
showing that the company’s capital structure is not optimal as of 2018. In order to manage a
balance between risks and returns, the BA needs to look after the debt percentage. In other
words, BA should manage its debt and thereby its percentage ratio with equity so that both
can be managed in an optimal way (Hummels, 2018).
Dividend policy
In general, dividend policy is mainly concerned with a company’s financial policies in
relation to paying cash dividend presently as well as paying an enhanced dividend at a later
stage. It has been found that the dividend policy of BA is a financial decision that depicts the
proportion of the organization’s earnings to be paid out to the stakeholders. In other words, it
can be said that the number of earnings to be retained back in the firm always relied on the
investment opportunities' availability (Hilton, 2011).
On the other hand, the dividend policy of BA can be seen as the strategy or technique used
for evaluating the whole dividend that would be paid to the company shareholders. Thus,
11
Generally, the capital structure can be seen as the evaluation technique that is used to
calculate the equity, total assets and debt of an organization. In this context, the capital
structure of the Company BA has been analysed for determining the suitable risks as well as
returns in the organization. Here, capital structure is often evaluated by the financial analyst
or the administration of the chosen firm. Thus, a better capital structure of the BA would
show a better valuation of the company (Karami, 2017). Therefore, for calculating the
optimal capital structure of BA, total debt, as well as total equity, has been calculated as
follows:
Based on the above calculated table, it can be said that total debt in the capital rupture of the
company is found as 65.033% whereas the total equity of the BA is found as 34.966%. It is
showing that the company’s capital structure is not optimal as of 2018. In order to manage a
balance between risks and returns, the BA needs to look after the debt percentage. In other
words, BA should manage its debt and thereby its percentage ratio with equity so that both
can be managed in an optimal way (Hummels, 2018).
Dividend policy
In general, dividend policy is mainly concerned with a company’s financial policies in
relation to paying cash dividend presently as well as paying an enhanced dividend at a later
stage. It has been found that the dividend policy of BA is a financial decision that depicts the
proportion of the organization’s earnings to be paid out to the stakeholders. In other words, it
can be said that the number of earnings to be retained back in the firm always relied on the
investment opportunities' availability (Hilton, 2011).
On the other hand, the dividend policy of BA can be seen as the strategy or technique used
for evaluating the whole dividend that would be paid to the company shareholders. Thus,
⊘ This is a preview!⊘
Do you want full access?
Subscribe today to unlock all pages.
Trusted by 1+ million students worldwide
1 out of 33
Related Documents


Your All-in-One AI-Powered Toolkit for Academic Success.
+13062052269
info@desklib.com
Available 24*7 on WhatsApp / Email
![[object Object]](/_next/static/media/star-bottom.7253800d.svg)
Unlock your academic potential
Copyright © 2020–2026 A2Z Services. All Rights Reserved. Developed and managed by ZUCOL.