Financial Analysis of Baby Bunting Group Ltd (BBN) for Investors
VerifiedAdded on 2020/03/23
|10
|1341
|53
Report
AI Summary
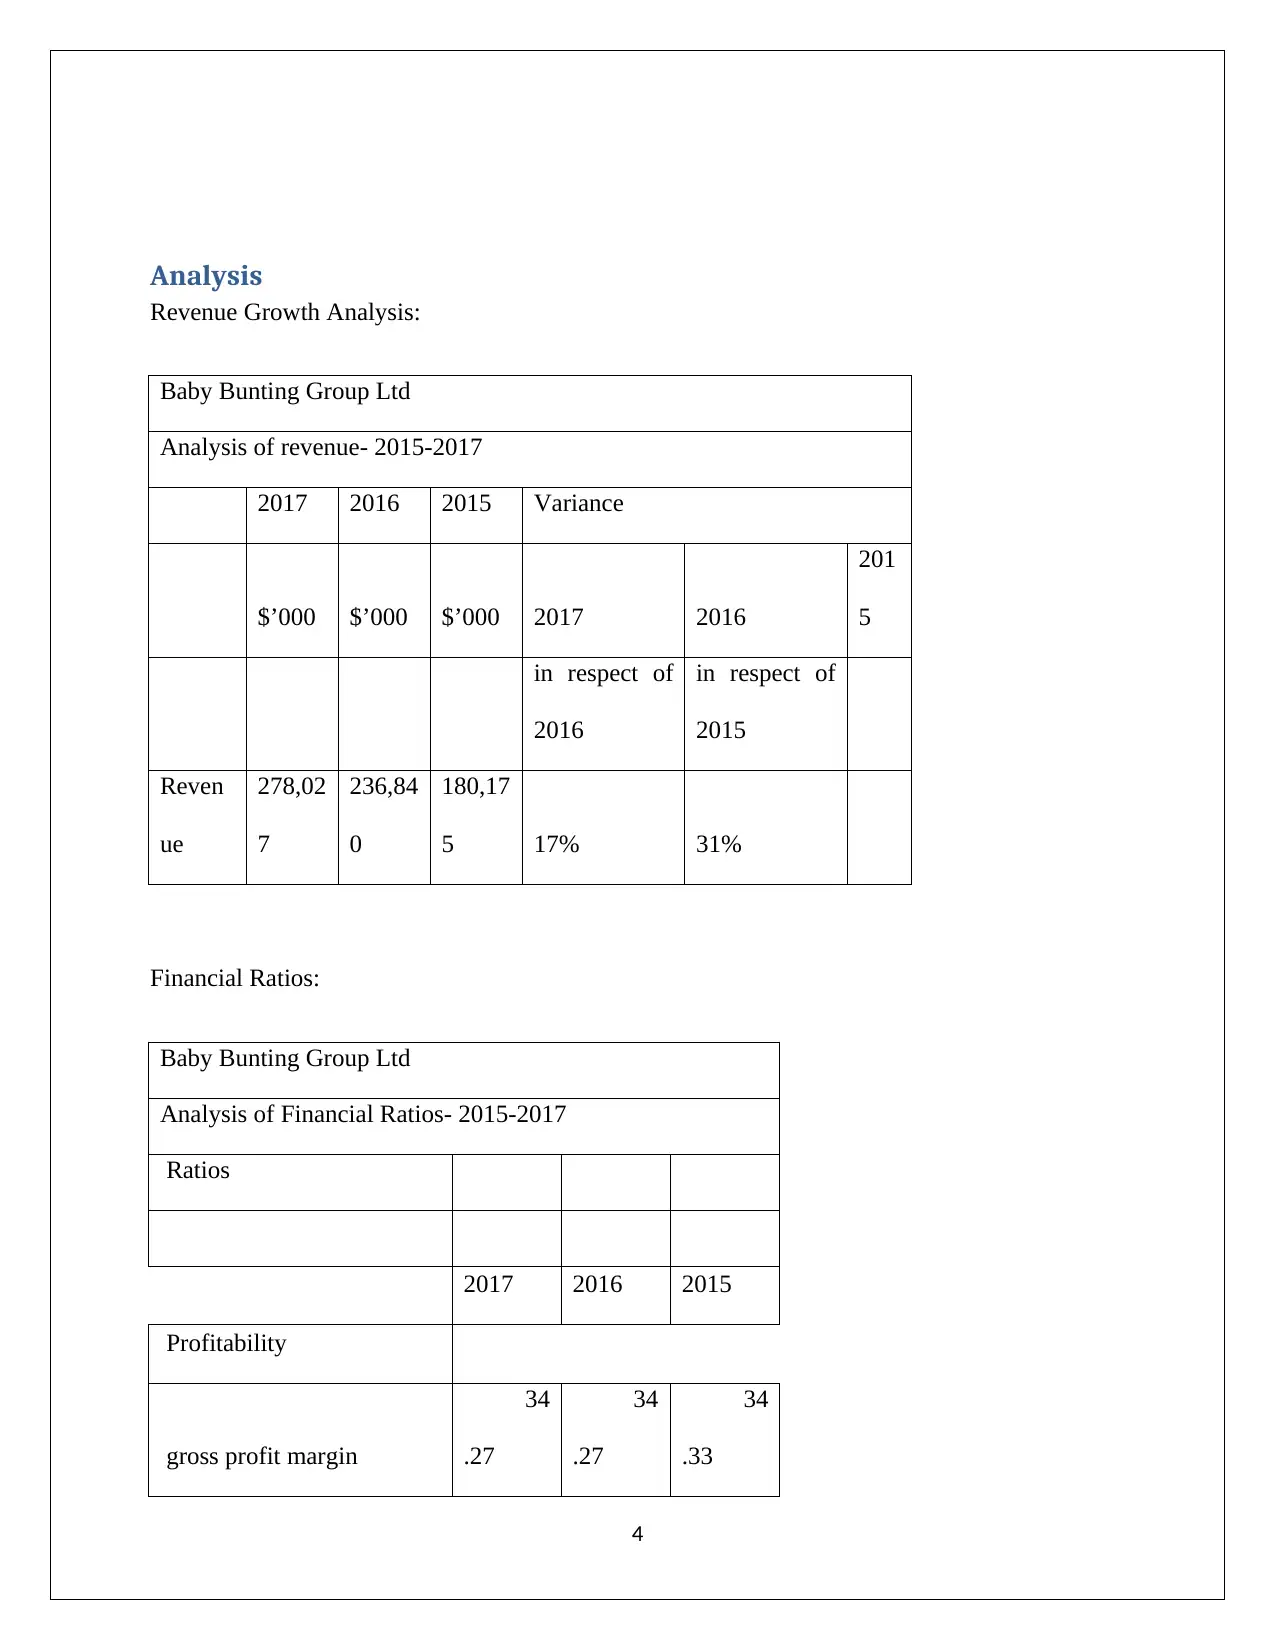
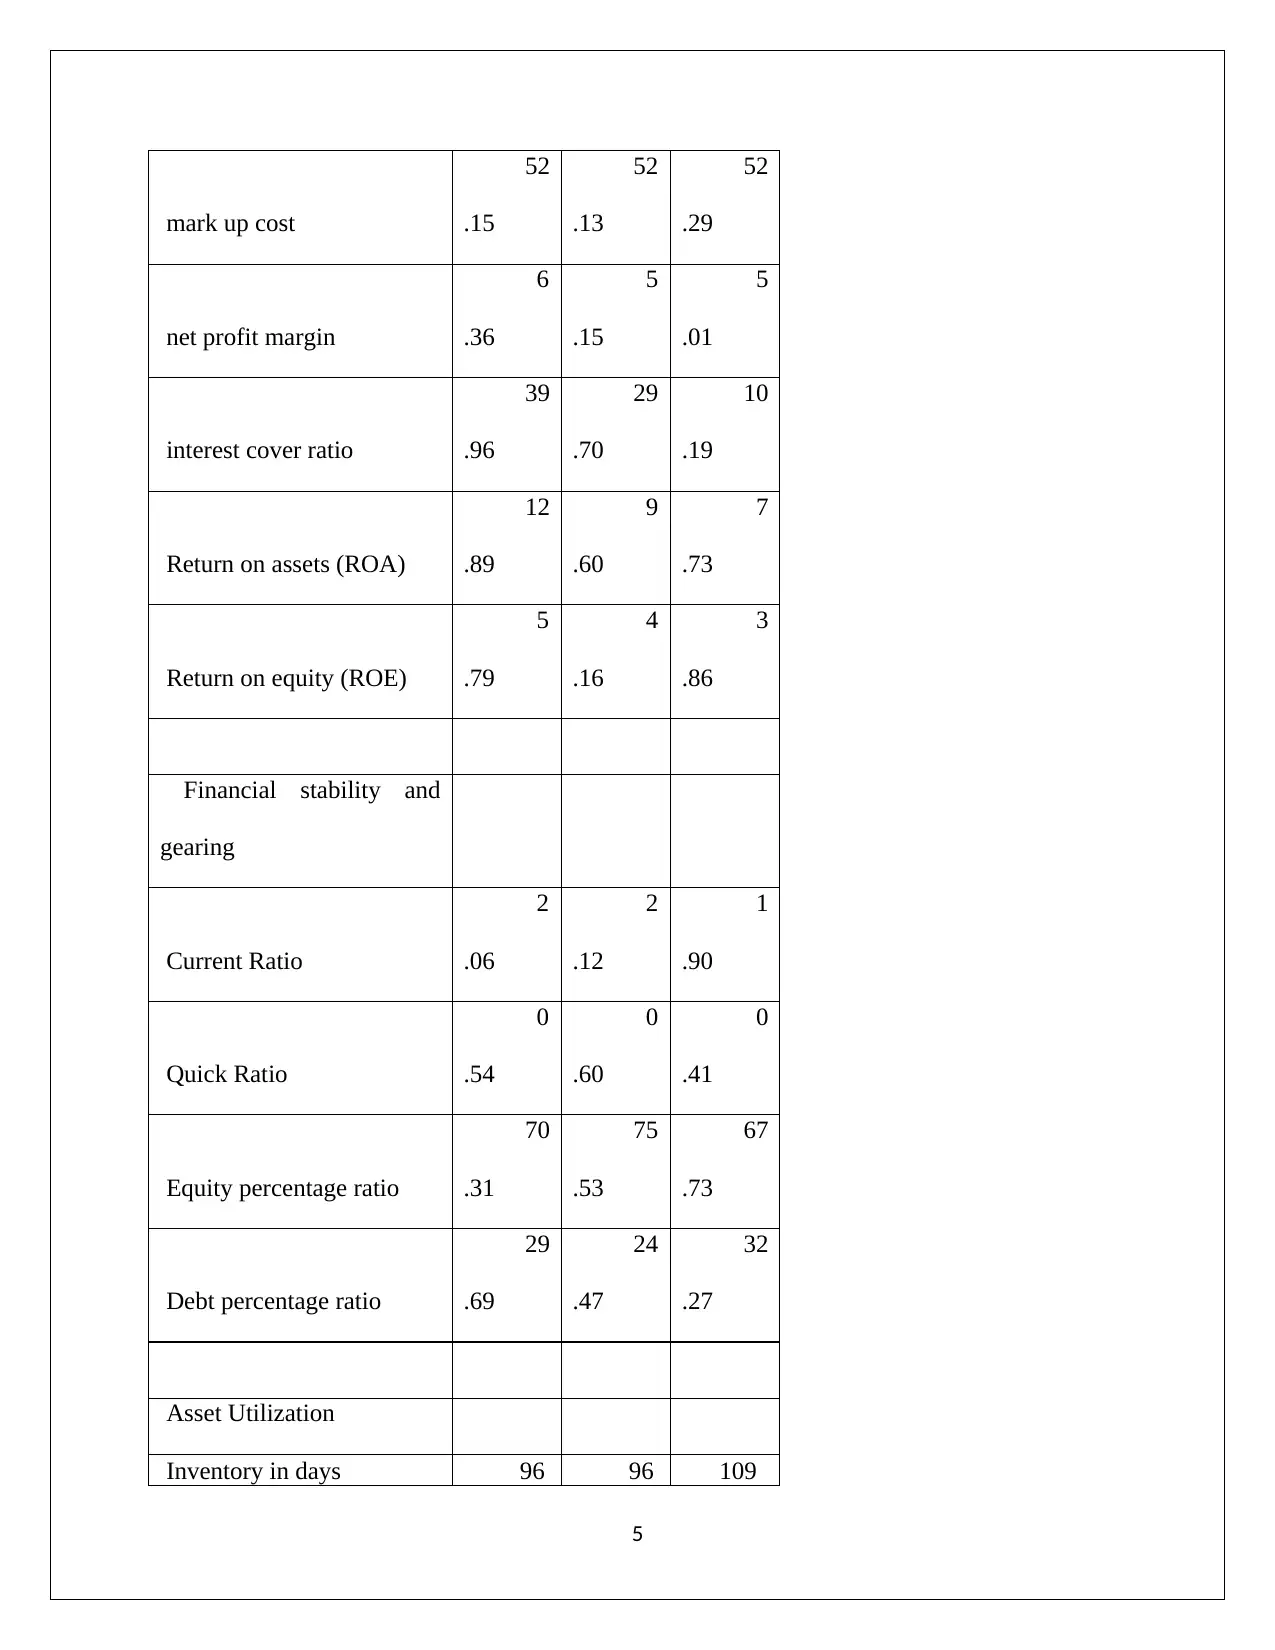
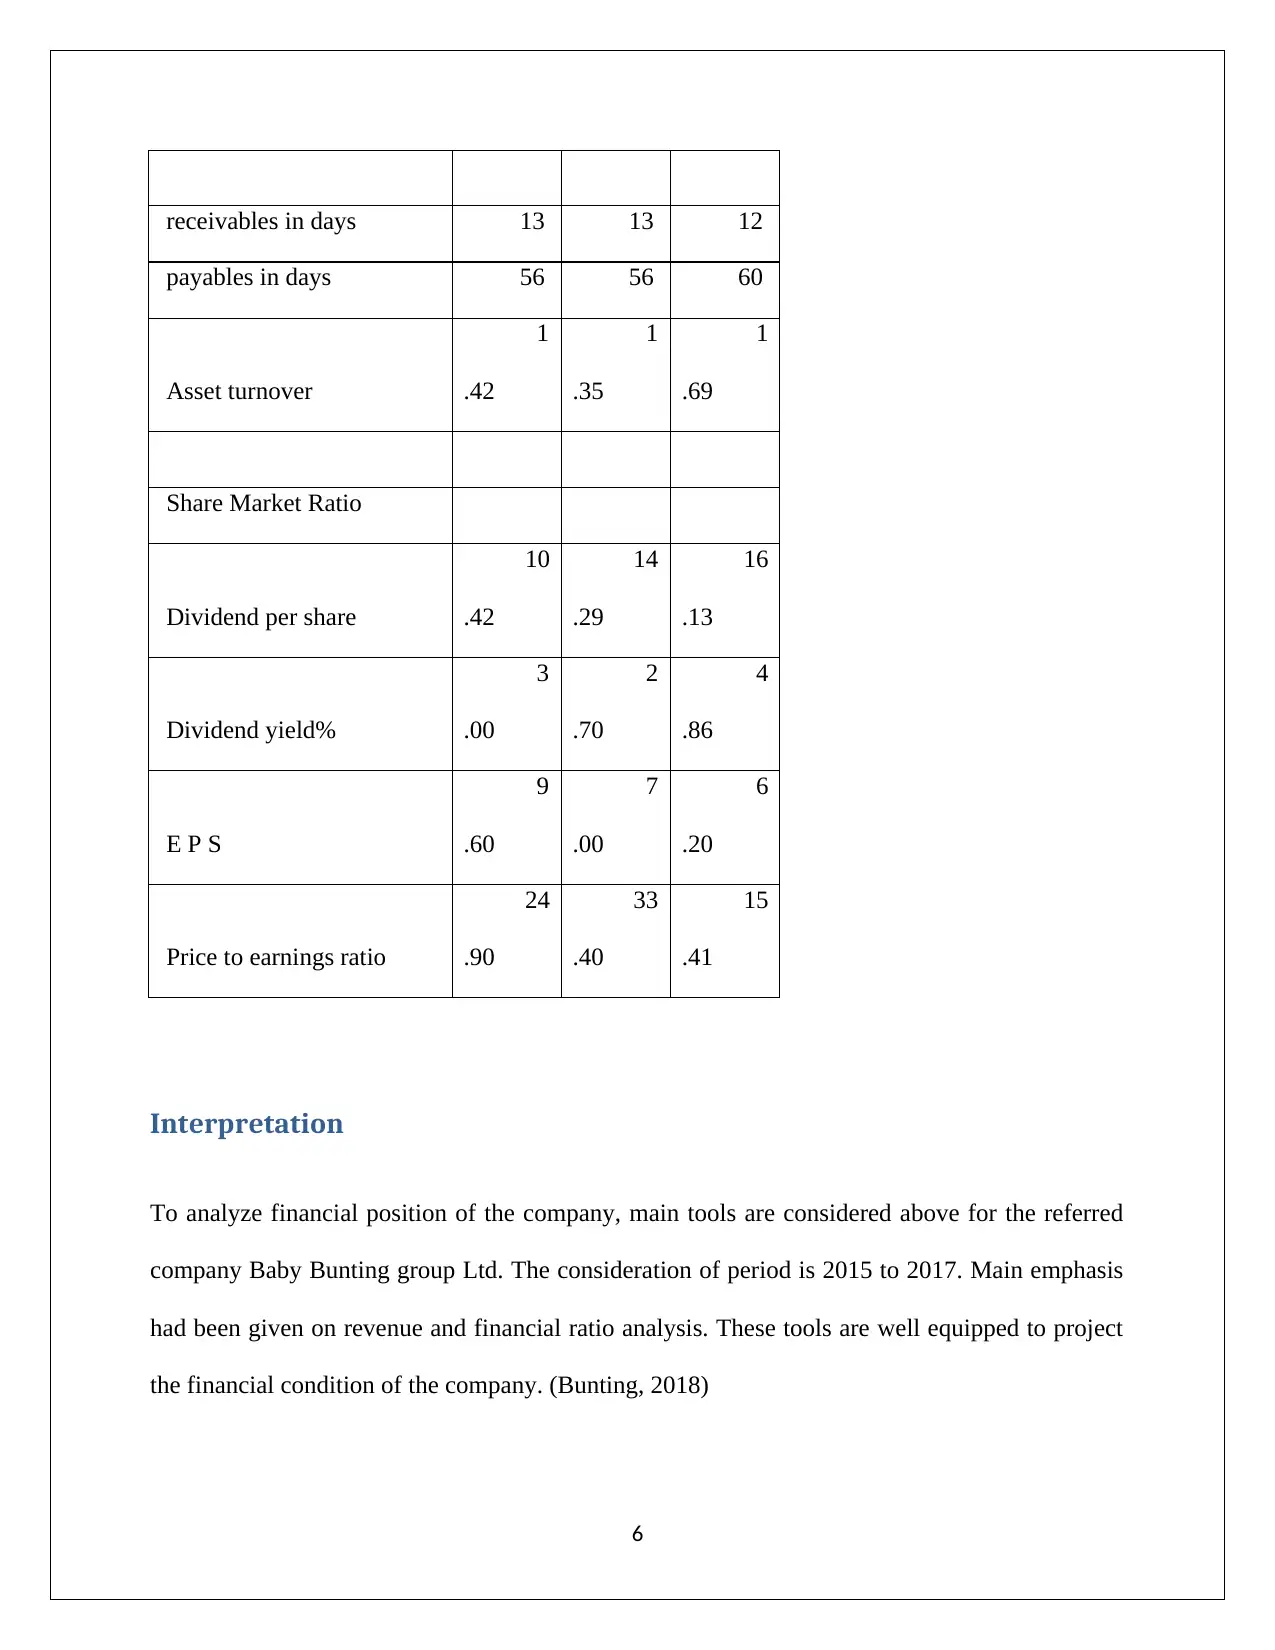
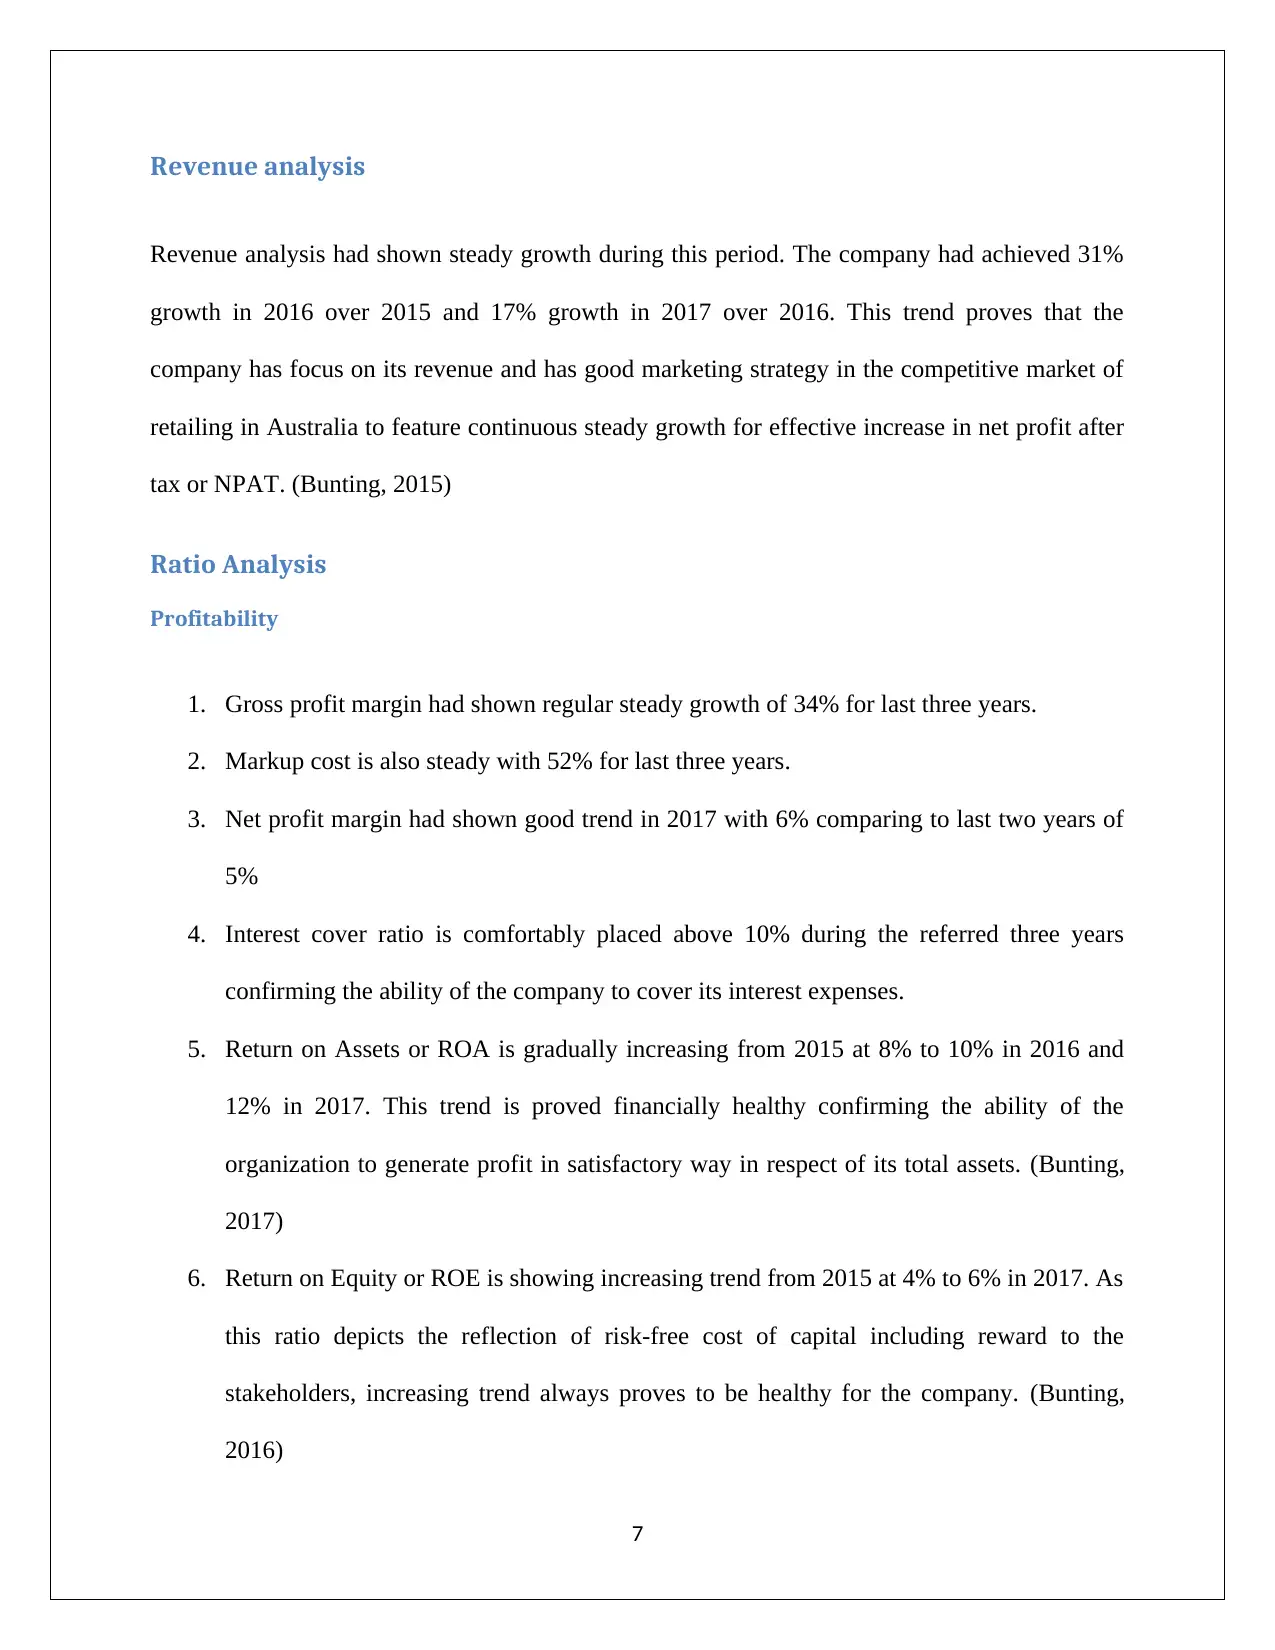
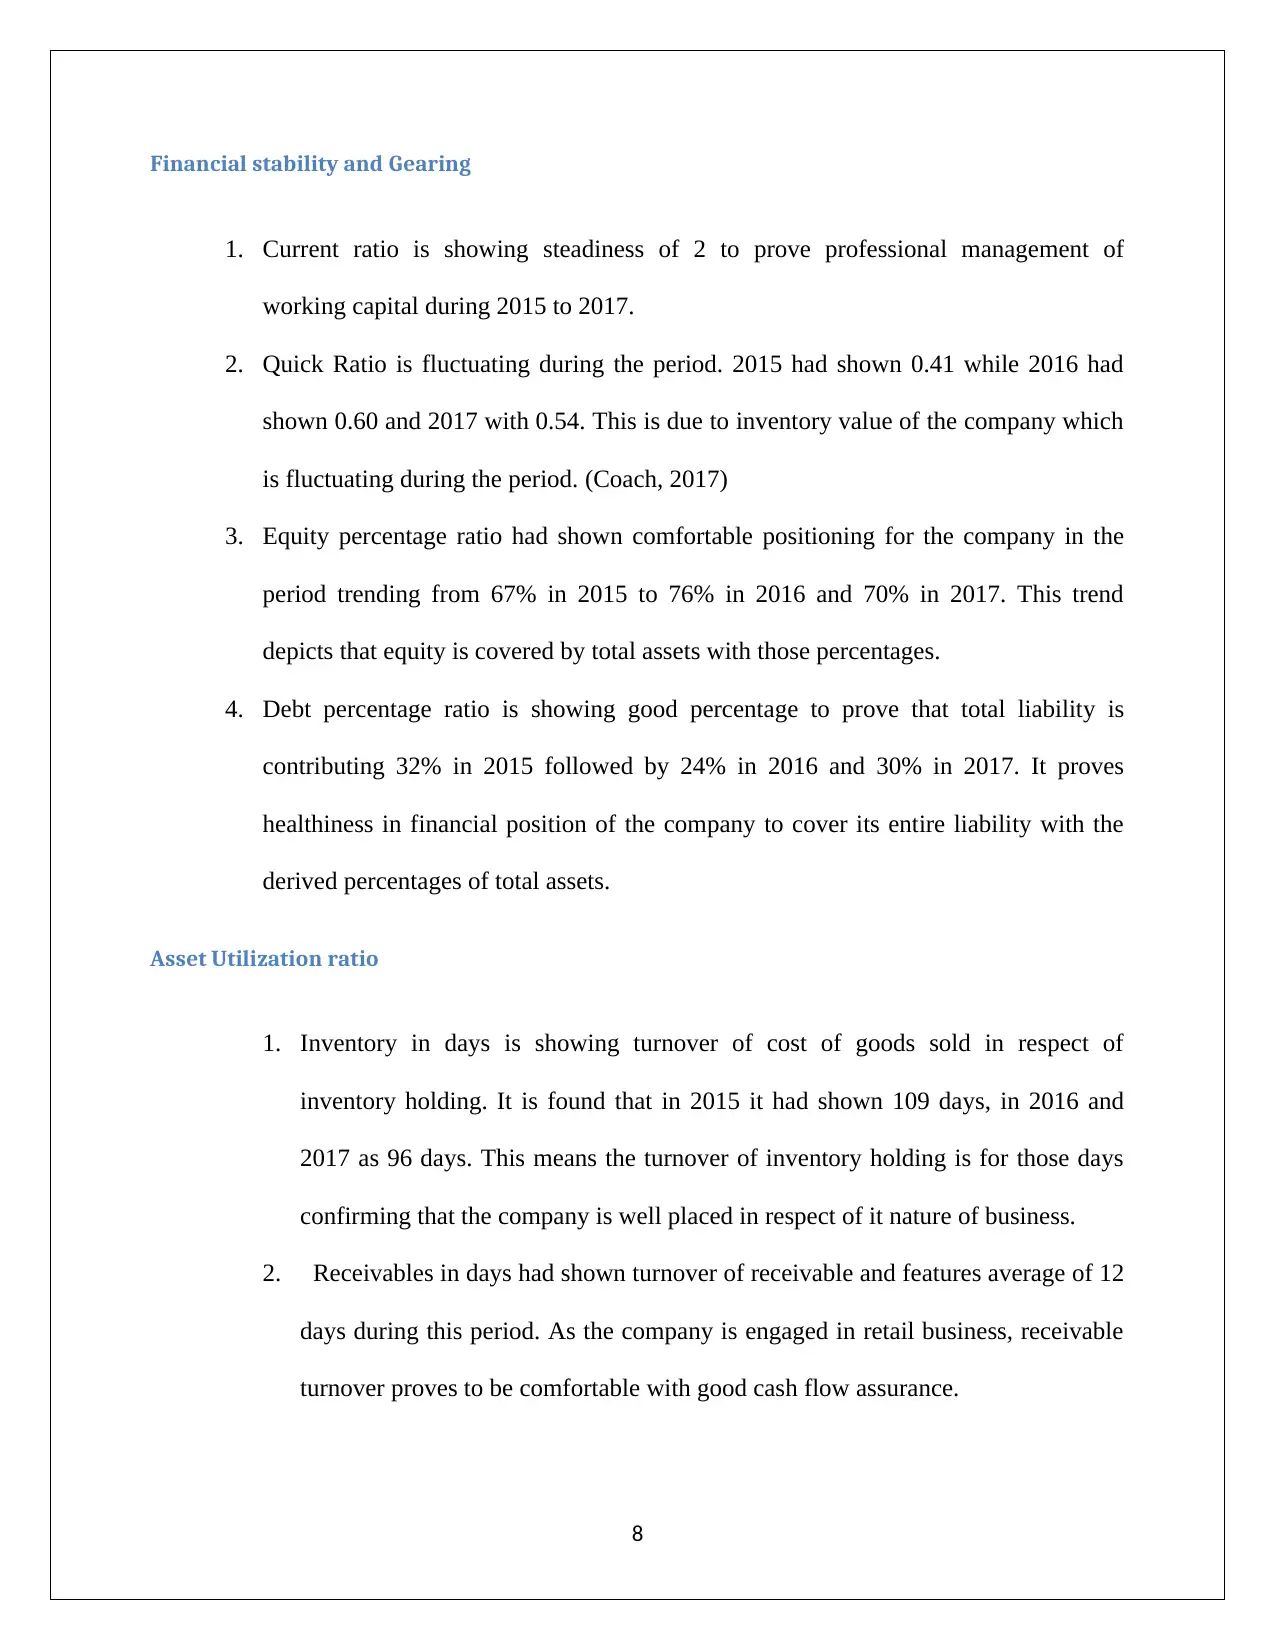
This report provides a financial analysis of Baby Bunting Group Ltd (BBN), an Australian retailing company listed on the ASX. The analysis covers the period from 2015 to 2017, focusing on revenue growth and various financial ratios to assess the company's financial health. Key areas examined include profitability (gross profit margin, net profit margin, ROA, ROE), financial stability (current ratio, quick ratio, debt and equity percentages), asset utilization (inventory turnover, receivables turnover), and share market ratios (dividend per share, EPS, P/E ratio). The report highlights steady revenue growth, comfortable profitability margins, and a healthy financial position. Recommendations are provided to improve receivable management, working capital management, and net profit margins, with a focus on achieving specific ROE targets. The report concludes with references to Baby Bunting's annual reports and other financial resources.

Financial Analysis of Baby Bunting for a
Prospective Investor
1
Prospective Investor
1
Paraphrase This Document
Need a fresh take? Get an instant paraphrase of this document with our AI Paraphraser

Executive Summary
For this report of financial analysis for a prospective investor, the company chosen was Baby
Bunting Group Ltd of Australia, which is enlisted in ASX since 2015 with ASX code BBN and
GICS Industry Group listing of Retailing. The company has head quarter at 955, Taylors Road,
DANDENONG SOUTH, VIC, AUSTRALIA, 3175. This report will highlight the analysis of
financial performance of the company to identify trend of business along with analysis of
different financial ratios to determine the financial health of the company through their
performance. This report will contribute to conclude the company’s performance from the
viewpoint of investors.
2

Table of Contents
Analysis........................................................................................................................................................4
Interpretation..............................................................................................................................................6
Revenue analysis.....................................................................................................................................6
Ratio Analysis...........................................................................................................................................7
Profitability..........................................................................................................................................7
Financial stability and Gearing.............................................................................................................7
Asset Utilization ratio..........................................................................................................................8
Share Market Ratio..............................................................................................................................9
Conclusion and recommendations..............................................................................................................9
References:................................................................................................................................................10
3
⊘ This is a preview!⊘
Do you want full access?
Subscribe today to unlock all pages.

Trusted by 1+ million students worldwide

Analysis
Revenue Growth Analysis:
Baby Bunting Group Ltd
Analysis of revenue- 2015-2017
2017 2016 2015 Variance
$’000 $’000 $’000 2017 2016
201
5
in respect of
2016
in respect of
2015
Reven
ue
278,02
7
236,84
0
180,17
5 17% 31%
Financial Ratios:
Baby Bunting Group Ltd
Analysis of Financial Ratios- 2015-2017
Ratios
2017 2016 2015
Profitability
gross profit margin
34
.27
34
.27
34
.33
4
Paraphrase This Document
Need a fresh take? Get an instant paraphrase of this document with our AI Paraphraser

mark up cost
52
.15
52
.13
52
.29
net profit margin
6
.36
5
.15
5
.01
interest cover ratio
39
.96
29
.70
10
.19
Return on assets (ROA)
12
.89
9
.60
7
.73
Return on equity (ROE)
5
.79
4
.16
3
.86
Financial stability and
gearing
Current Ratio
2
.06
2
.12
1
.90
Quick Ratio
0
.54
0
.60
0
.41
Equity percentage ratio
70
.31
75
.53
67
.73
Debt percentage ratio
29
.69
24
.47
32
.27
Asset Utilization
Inventory in days 96 96 109
5
52
.15
52
.13
52
.29
net profit margin
6
.36
5
.15
5
.01
interest cover ratio
39
.96
29
.70
10
.19
Return on assets (ROA)
12
.89
9
.60
7
.73
Return on equity (ROE)
5
.79
4
.16
3
.86
Financial stability and
gearing
Current Ratio
2
.06
2
.12
1
.90
Quick Ratio
0
.54
0
.60
0
.41
Equity percentage ratio
70
.31
75
.53
67
.73
Debt percentage ratio
29
.69
24
.47
32
.27
Asset Utilization
Inventory in days 96 96 109
5

receivables in days 13 13 12
payables in days 56 56 60
Asset turnover
1
.42
1
.35
1
.69
Share Market Ratio
Dividend per share
10
.42
14
.29
16
.13
Dividend yield%
3
.00
2
.70
4
.86
E P S
9
.60
7
.00
6
.20
Price to earnings ratio
24
.90
33
.40
15
.41
Interpretation
To analyze financial position of the company, main tools are considered above for the referred
company Baby Bunting group Ltd. The consideration of period is 2015 to 2017. Main emphasis
had been given on revenue and financial ratio analysis. These tools are well equipped to project
the financial condition of the company. (Bunting, 2018)
6
⊘ This is a preview!⊘
Do you want full access?
Subscribe today to unlock all pages.

Trusted by 1+ million students worldwide

Revenue analysis
Revenue analysis had shown steady growth during this period. The company had achieved 31%
growth in 2016 over 2015 and 17% growth in 2017 over 2016. This trend proves that the
company has focus on its revenue and has good marketing strategy in the competitive market of
retailing in Australia to feature continuous steady growth for effective increase in net profit after
tax or NPAT. (Bunting, 2015)
Ratio Analysis
Profitability
1. Gross profit margin had shown regular steady growth of 34% for last three years.
2. Markup cost is also steady with 52% for last three years.
3. Net profit margin had shown good trend in 2017 with 6% comparing to last two years of
5%
4. Interest cover ratio is comfortably placed above 10% during the referred three years
confirming the ability of the company to cover its interest expenses.
5. Return on Assets or ROA is gradually increasing from 2015 at 8% to 10% in 2016 and
12% in 2017. This trend is proved financially healthy confirming the ability of the
organization to generate profit in satisfactory way in respect of its total assets. (Bunting,
2017)
6. Return on Equity or ROE is showing increasing trend from 2015 at 4% to 6% in 2017. As
this ratio depicts the reflection of risk-free cost of capital including reward to the
stakeholders, increasing trend always proves to be healthy for the company. (Bunting,
2016)
7
Paraphrase This Document
Need a fresh take? Get an instant paraphrase of this document with our AI Paraphraser

Financial stability and Gearing
1. Current ratio is showing steadiness of 2 to prove professional management of
working capital during 2015 to 2017.
2. Quick Ratio is fluctuating during the period. 2015 had shown 0.41 while 2016 had
shown 0.60 and 2017 with 0.54. This is due to inventory value of the company which
is fluctuating during the period. (Coach, 2017)
3. Equity percentage ratio had shown comfortable positioning for the company in the
period trending from 67% in 2015 to 76% in 2016 and 70% in 2017. This trend
depicts that equity is covered by total assets with those percentages.
4. Debt percentage ratio is showing good percentage to prove that total liability is
contributing 32% in 2015 followed by 24% in 2016 and 30% in 2017. It proves
healthiness in financial position of the company to cover its entire liability with the
derived percentages of total assets.
Asset Utilization ratio
1. Inventory in days is showing turnover of cost of goods sold in respect of
inventory holding. It is found that in 2015 it had shown 109 days, in 2016 and
2017 as 96 days. This means the turnover of inventory holding is for those days
confirming that the company is well placed in respect of it nature of business.
2. Receivables in days had shown turnover of receivable and features average of 12
days during this period. As the company is engaged in retail business, receivable
turnover proves to be comfortable with good cash flow assurance.
8

3. Payable in days is ranging from 60 in 2015 to 56 in 2016 and 2017 respectively.
This analysis ensures proper deployment of working capital with perfect supply
chain management.
4. Asset turnover ratio is showing more than 1 of revenue over average total assets,
which is good for the organization in respect of its revenue covered by average
total assets. (Government, 2017)
Share Market Ratio
Four ratios in the form of dividend per share, dividend yield percentage, earning per share and
price to earnings ratio had shown comfortable positioning proving stable stock market existence
without any volatility. (Investsmart, 2017)
Conclusion and recommendations
The company is showing stability with steady growth in its business. As the company is engaged
in retail business, the main ratios in the form of asset utilization, share market ratio, profitability
and financial stability had shown comfortable positioning in the market to generate shareholders’
confidence.
Recommendations are:
1. Receivable management should be strict with days’ analysis to be kept within 5.
2. Working capital management is to prove more efficient emphasizing to increase quick
ratio.
3. Net profit margin should be geared up in higher level by proper cost management.
9
⊘ This is a preview!⊘
Do you want full access?
Subscribe today to unlock all pages.

Trusted by 1+ million students worldwide

4. Objective of ROE to be achieved should be above 7% by next fiscal year.
References:
Bunting, B., 2015. Annual Report. Annual Financial Report.
Bunting, B., 2016. Baby Bunting Annual report 2016. [Online] Available at:
http://www.babybuntingcorporate.com.au/wp-content/uploads/2016/01/BabyBunting-Annual-Report-
2016.pdf [Accessed 23 May 2018].
Bunting, B., 2017. Annual Report. [Online] Available at: http://www.babybuntingcorporate.com.au/wp-
content/uploads/2017/08/Appendix-4E-and-FY17-Annual-Report-final.pdf [Accessed 23 May 2018].
Bunting, B., 2018. Baby Bunting Investor Website. [Online] Available at:
http://www.babybuntingcorporate.com.au/reports [Accessed 9 June 2018].
Coach, A., 2017. What is a liquidity ratio? [Online] Available at:
https://www.accountingcoach.com/blog/liquidity-ratio [Accessed 25 May 2018].
Government, A., 2017. Analyse Your Finances: Financial Ratios. [Online] Available at:
https://www.business.gov.au/info/run/finance-and-accounting/finance/analyse-your-finances-financial-
ratios [Accessed 27 April 2018].
Investsmart, 2017. Baby Bunting Group Ltd. [Online] Available at:
https://www.investsmart.com.au/shares/asx-bbn/baby-bunting-group-limited [Accessed 09 June 2018].
10
1 out of 10
Related Documents

Your All-in-One AI-Powered Toolkit for Academic Success.
+13062052269
info@desklib.com
Available 24*7 on WhatsApp / Email
Unlock your academic potential
Copyright © 2020–2025 A2Z Services. All Rights Reserved. Developed and managed by ZUCOL.