Financial Management: GSK Plc and Roche Holding AG Analysis
VerifiedAdded on 2023/04/25
|27
|6251
|74
Report
AI Summary
This comprehensive report delves into various aspects of financial management, commencing with a comparative profitability analysis of GSK Plc and Roche Holding AG for the years 2016 and 2017, utilizing key ratios such as return on capital employed, operating profit margin, and earnings per share. The analysis reveals Roche Holding AG's stronger financial position. The report then explores zero-based budgeting (ZBB), outlining its advantages (accuracy, efficiency, and cooperation) and disadvantages (time-consuming nature), along with circumstances favoring its implementation. Further, it examines the benefits and limitations of the balanced scorecard and discusses process failures. Finally, the report addresses financial considerations essential for making sound investment decisions. The report also touches upon the potential of Artificial Intelligence (AI) in banking, specifically focusing on the retail credit center and disbursal units, considering the risks and opportunities of AI implementation in Emirates NBD, aligning with the UAE government's vision for digital transformation. The report includes the student's analysis of the given assignment brief.
Running head: FINANCIAL MANAGEMENT
Financial Management
Name of the Student:
Name of the University:
Author’s Note:
Course ID:
Financial Management
Name of the Student:
Name of the University:
Author’s Note:
Course ID:
Paraphrase This Document
Need a fresh take? Get an instant paraphrase of this document with our AI Paraphraser
1FINANCIAL MANAGEMENT
Table of Contents
Part 1:...............................................................................................................................................3
Introduction:................................................................................................................................3
Organisational profiles of GSK Plc and Roche Holding AG:.....................................................3
Profitability analysis of GSK Plc and Roche Holding AG for the years 2016 and 2017:...........4
Conclusion:..................................................................................................................................9
Part 2:.............................................................................................................................................10
Introduction:..............................................................................................................................10
Advantages and disadvantages of Zero Based Budgeting:........................................................10
Circumstances under which Zero Based Budgeting would be used:.........................................12
Conclusion:................................................................................................................................13
Part 3:.............................................................................................................................................13
Introduction:..............................................................................................................................13
Benefits and limitations of balanced scorecard:........................................................................14
Process failure:...........................................................................................................................17
Conclusion:................................................................................................................................18
Part 4:.............................................................................................................................................18
Introduction:..............................................................................................................................18
Financial issues to be considered before undertaking investment decision:.............................19

2FINANCIAL MANAGEMENT
Conclusion:................................................................................................................................21
References and Bibliographies:.....................................................................................................22
Conclusion:................................................................................................................................21
References and Bibliographies:.....................................................................................................22
⊘ This is a preview!⊘
Do you want full access?
Subscribe today to unlock all pages.
Trusted by 1+ million students worldwide
3FINANCIAL MANAGEMENT
Part 1:
Introduction:
The current section would provide a brief comparison of the profitability positions of
GSK Plc and Roche Holding AG for the years 2016 and 2017. For determination of the
profitability position of these two healthcare organisations, three useful ratios have been used.
These ratios mainly constitute of return on capital employed, operating profit margin and
earnings per share. The comparison of these ratios would help in understanding the financial
performance of the two chosen organisations in the years 2016 and 2017.
Organisational profiles of GSK Plc and Roche Holding AG:
GSK Plc is a UK-based pharmaceutical firm dealing with inventing, developing,
producing and marketing vaccines along with other health products in the global marketplace. It
is listed on FTSE 100 having market capitalisation of almost £81 million in 2016, which is the
fourth biggest in the stated index (Gsk.com 2019). The main products that it sells in the global
arena comprise of Flovent, Avodart, Advair and other medicines. The organisation has the
objective of becoming the most trusted and innovative healthcare in the global marketplace. In
2010, GSK Plc made the acquisitions of Laboratorious Phoenix for $253 million and it has
employees of nearly 95,400 in 2018.
Roche Holding AG is involved in pharmaceuticals and diagnostics business in
Switzerland, Germany and other European nations (Roche.com 2019). It is a Swiss global
healthcare organisation operating under two divisions, which include diagnostics and
pharmaceuticals. In addition, the organisation is focusing on maintaining competitive advantage
Paraphrase This Document
Need a fresh take? Get an instant paraphrase of this document with our AI Paraphraser
4FINANCIAL MANAGEMENT
through simplification of its business processes by retaining the best talent. At present, it has
employee base of 65,000.
Profitability analysis of GSK Plc and Roche Holding AG for the years 2016 and 2017:
For assessment of the profitability position of GSK Plc and Roche Holding AG for the
years 2016 and 2017, the ratios that have been considered mainly include return on capital
employed, operating profit margin and earnings per share. The detailed evaluation of these ratios
is presented as follows:
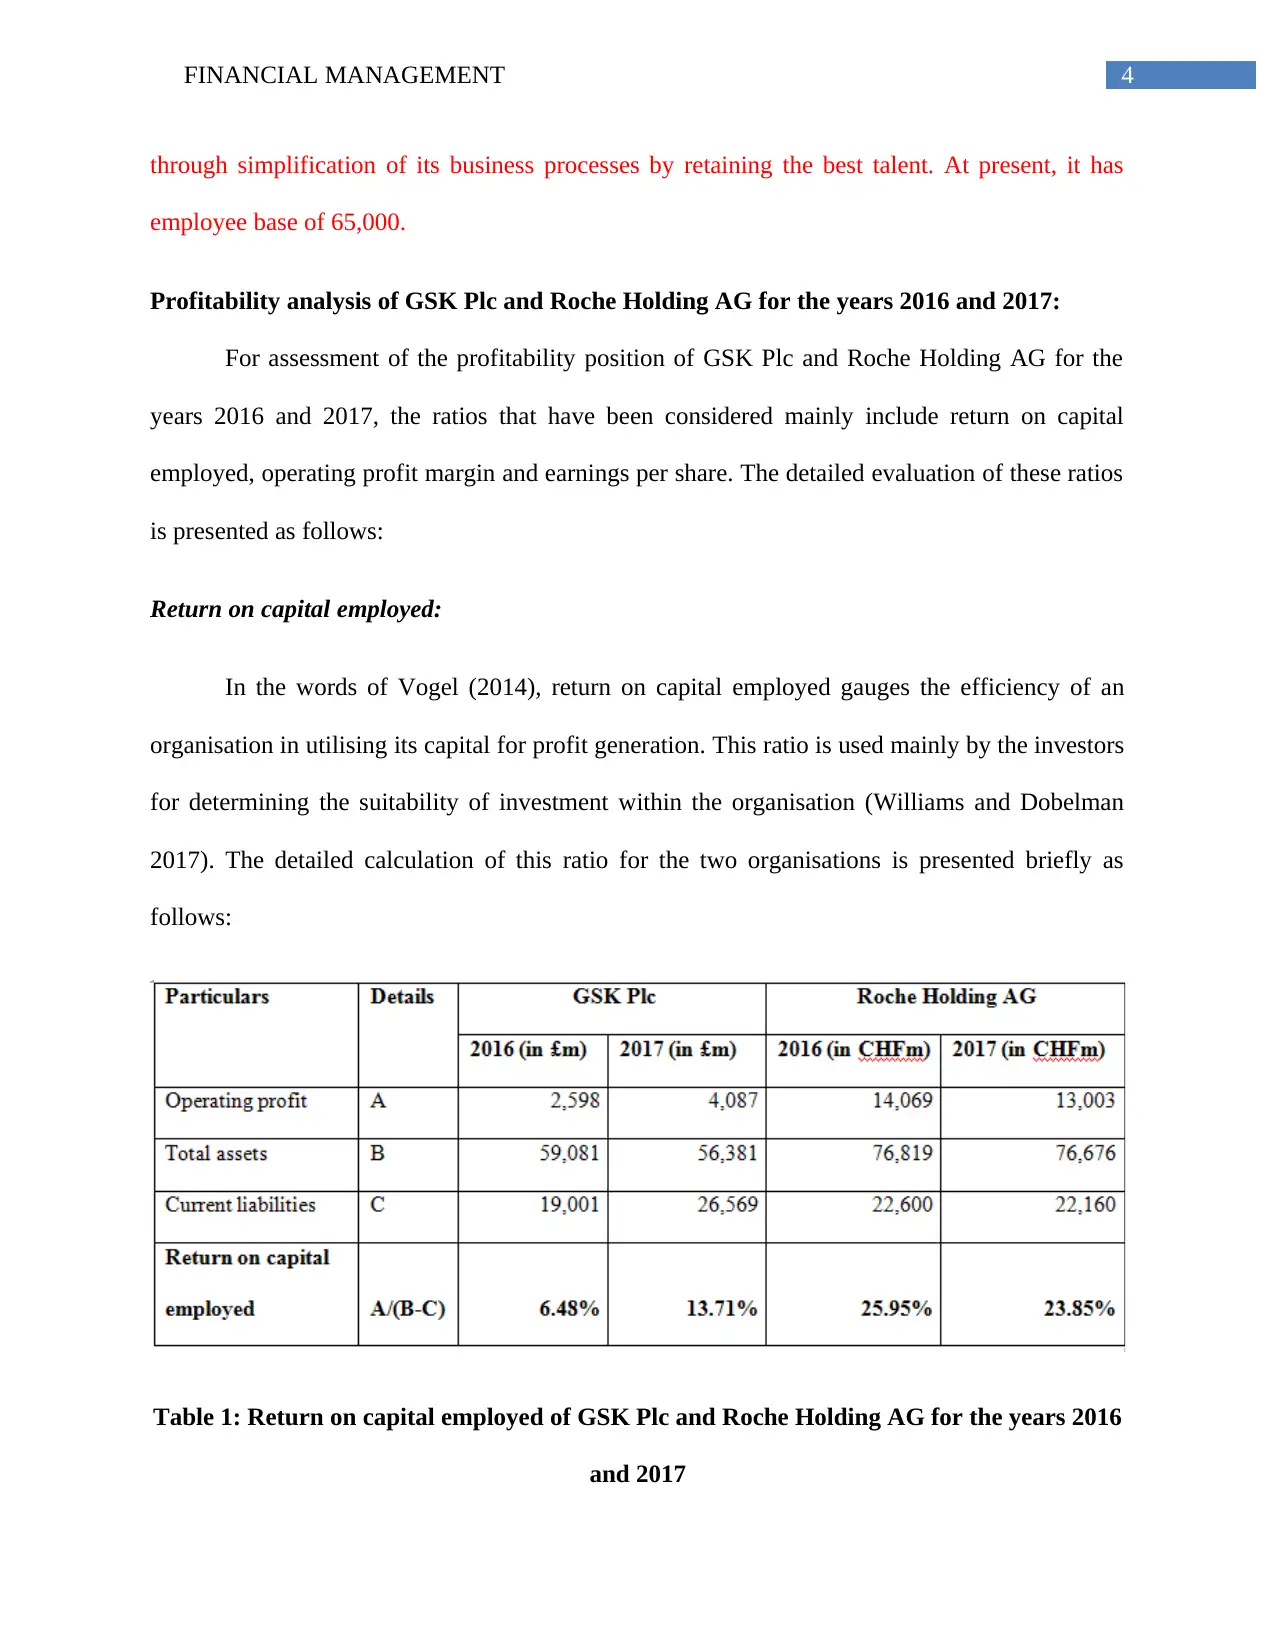
Return on capital employed:
In the words of Vogel (2014), return on capital employed gauges the efficiency of an
organisation in utilising its capital for profit generation. This ratio is used mainly by the investors
for determining the suitability of investment within the organisation (Williams and Dobelman
2017). The detailed calculation of this ratio for the two organisations is presented briefly as
follows:
Table 1: Return on capital employed of GSK Plc and Roche Holding AG for the years 2016
and 2017
through simplification of its business processes by retaining the best talent. At present, it has
employee base of 65,000.
Profitability analysis of GSK Plc and Roche Holding AG for the years 2016 and 2017:
For assessment of the profitability position of GSK Plc and Roche Holding AG for the
years 2016 and 2017, the ratios that have been considered mainly include return on capital
employed, operating profit margin and earnings per share. The detailed evaluation of these ratios
is presented as follows:
Return on capital employed:
In the words of Vogel (2014), return on capital employed gauges the efficiency of an
organisation in utilising its capital for profit generation. This ratio is used mainly by the investors
for determining the suitability of investment within the organisation (Williams and Dobelman
2017). The detailed calculation of this ratio for the two organisations is presented briefly as
follows:
Table 1: Return on capital employed of GSK Plc and Roche Holding AG for the years 2016
and 2017
5FINANCIAL MANAGEMENT
(Source: Gsk.com 2019: Roche.com 2019)
2016 2017 2016 2017
GSK Plc Roche Holding AG
0.00%
5.00%
10.00%
15.00%
20.00%
25.00%
30.00%
6.48%
13.71%
25.95% 23.85%
Return on capital employed
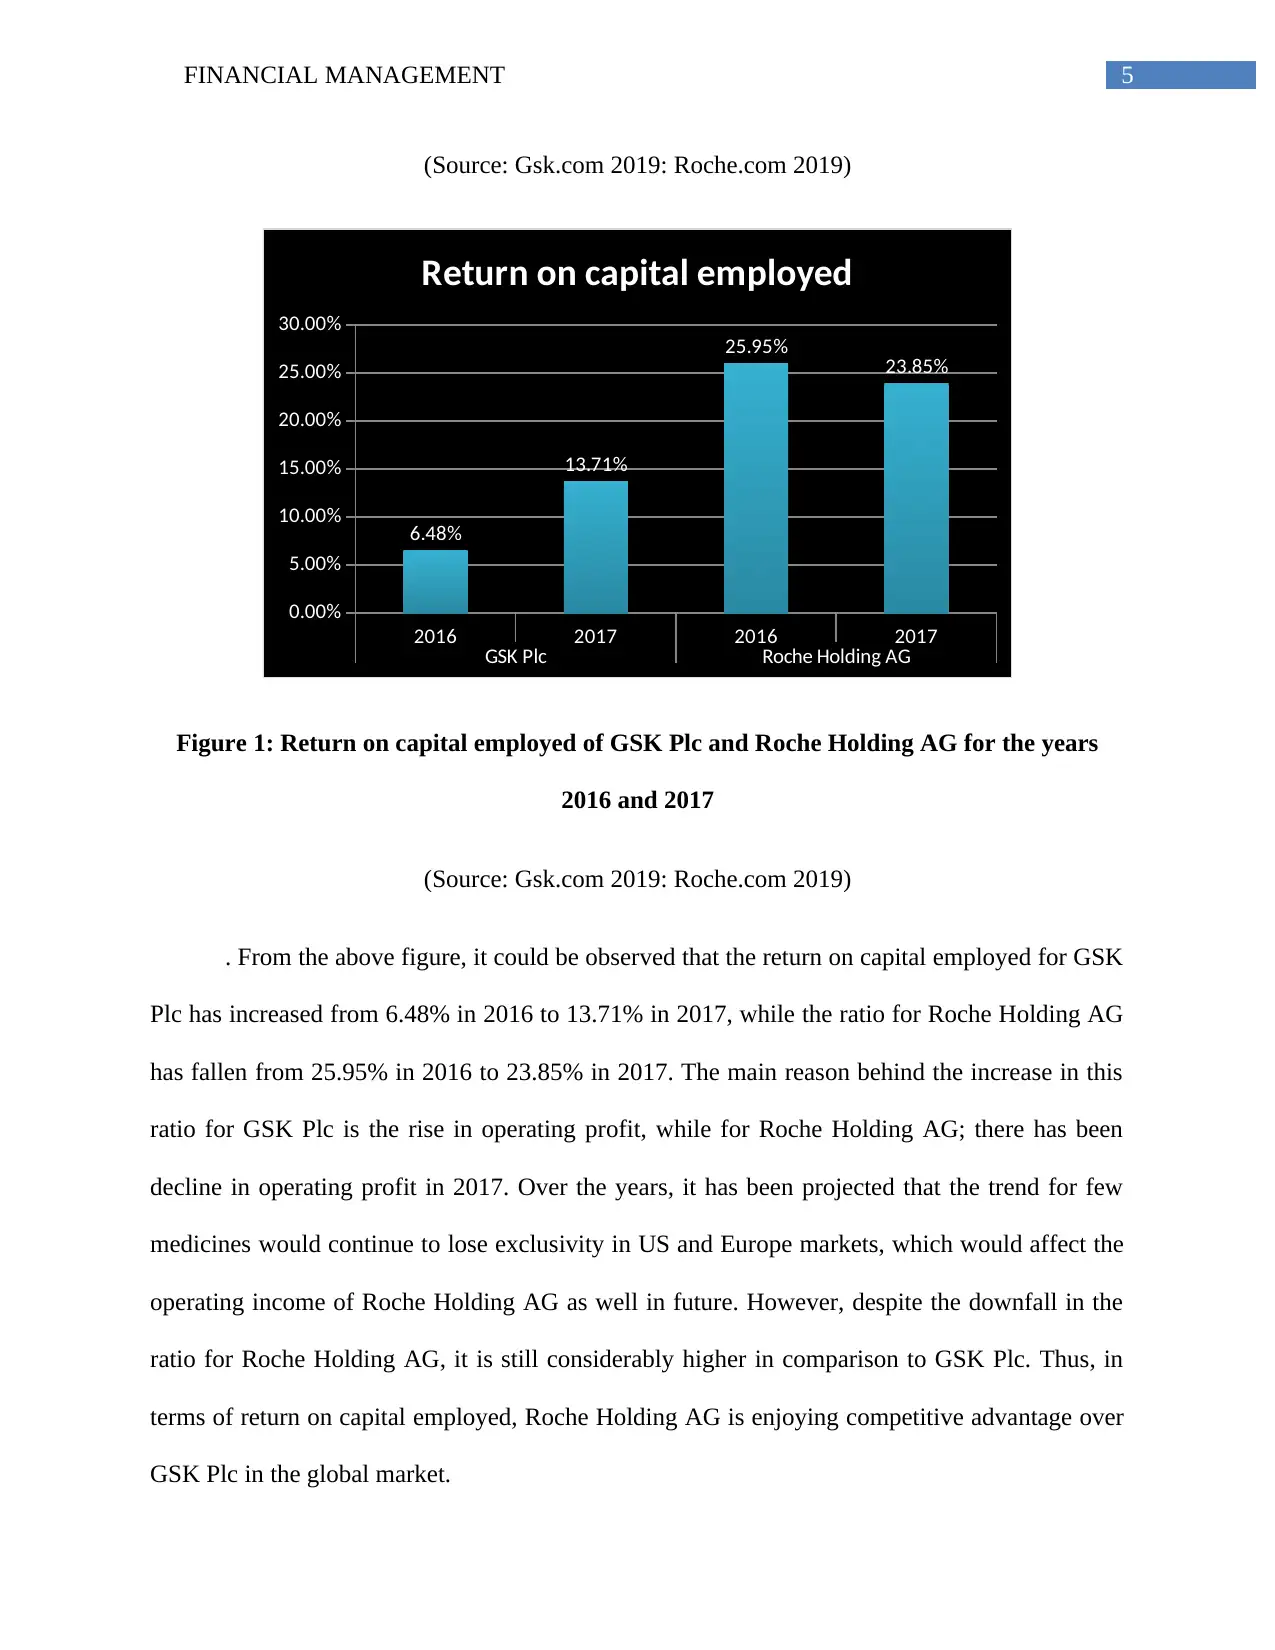
Figure 1: Return on capital employed of GSK Plc and Roche Holding AG for the years
2016 and 2017
(Source: Gsk.com 2019: Roche.com 2019)
. From the above figure, it could be observed that the return on capital employed for GSK
Plc has increased from 6.48% in 2016 to 13.71% in 2017, while the ratio for Roche Holding AG
has fallen from 25.95% in 2016 to 23.85% in 2017. The main reason behind the increase in this
ratio for GSK Plc is the rise in operating profit, while for Roche Holding AG; there has been
decline in operating profit in 2017. Over the years, it has been projected that the trend for few
medicines would continue to lose exclusivity in US and Europe markets, which would affect the
operating income of Roche Holding AG as well in future. However, despite the downfall in the
ratio for Roche Holding AG, it is still considerably higher in comparison to GSK Plc. Thus, in
terms of return on capital employed, Roche Holding AG is enjoying competitive advantage over
GSK Plc in the global market.
(Source: Gsk.com 2019: Roche.com 2019)
2016 2017 2016 2017
GSK Plc Roche Holding AG
0.00%
5.00%
10.00%
15.00%
20.00%
25.00%
30.00%
6.48%
13.71%
25.95% 23.85%
Return on capital employed
Figure 1: Return on capital employed of GSK Plc and Roche Holding AG for the years
2016 and 2017
(Source: Gsk.com 2019: Roche.com 2019)
. From the above figure, it could be observed that the return on capital employed for GSK
Plc has increased from 6.48% in 2016 to 13.71% in 2017, while the ratio for Roche Holding AG
has fallen from 25.95% in 2016 to 23.85% in 2017. The main reason behind the increase in this
ratio for GSK Plc is the rise in operating profit, while for Roche Holding AG; there has been
decline in operating profit in 2017. Over the years, it has been projected that the trend for few
medicines would continue to lose exclusivity in US and Europe markets, which would affect the
operating income of Roche Holding AG as well in future. However, despite the downfall in the
ratio for Roche Holding AG, it is still considerably higher in comparison to GSK Plc. Thus, in
terms of return on capital employed, Roche Holding AG is enjoying competitive advantage over
GSK Plc in the global market.
⊘ This is a preview!⊘
Do you want full access?
Subscribe today to unlock all pages.
Trusted by 1+ million students worldwide
6FINANCIAL MANAGEMENT
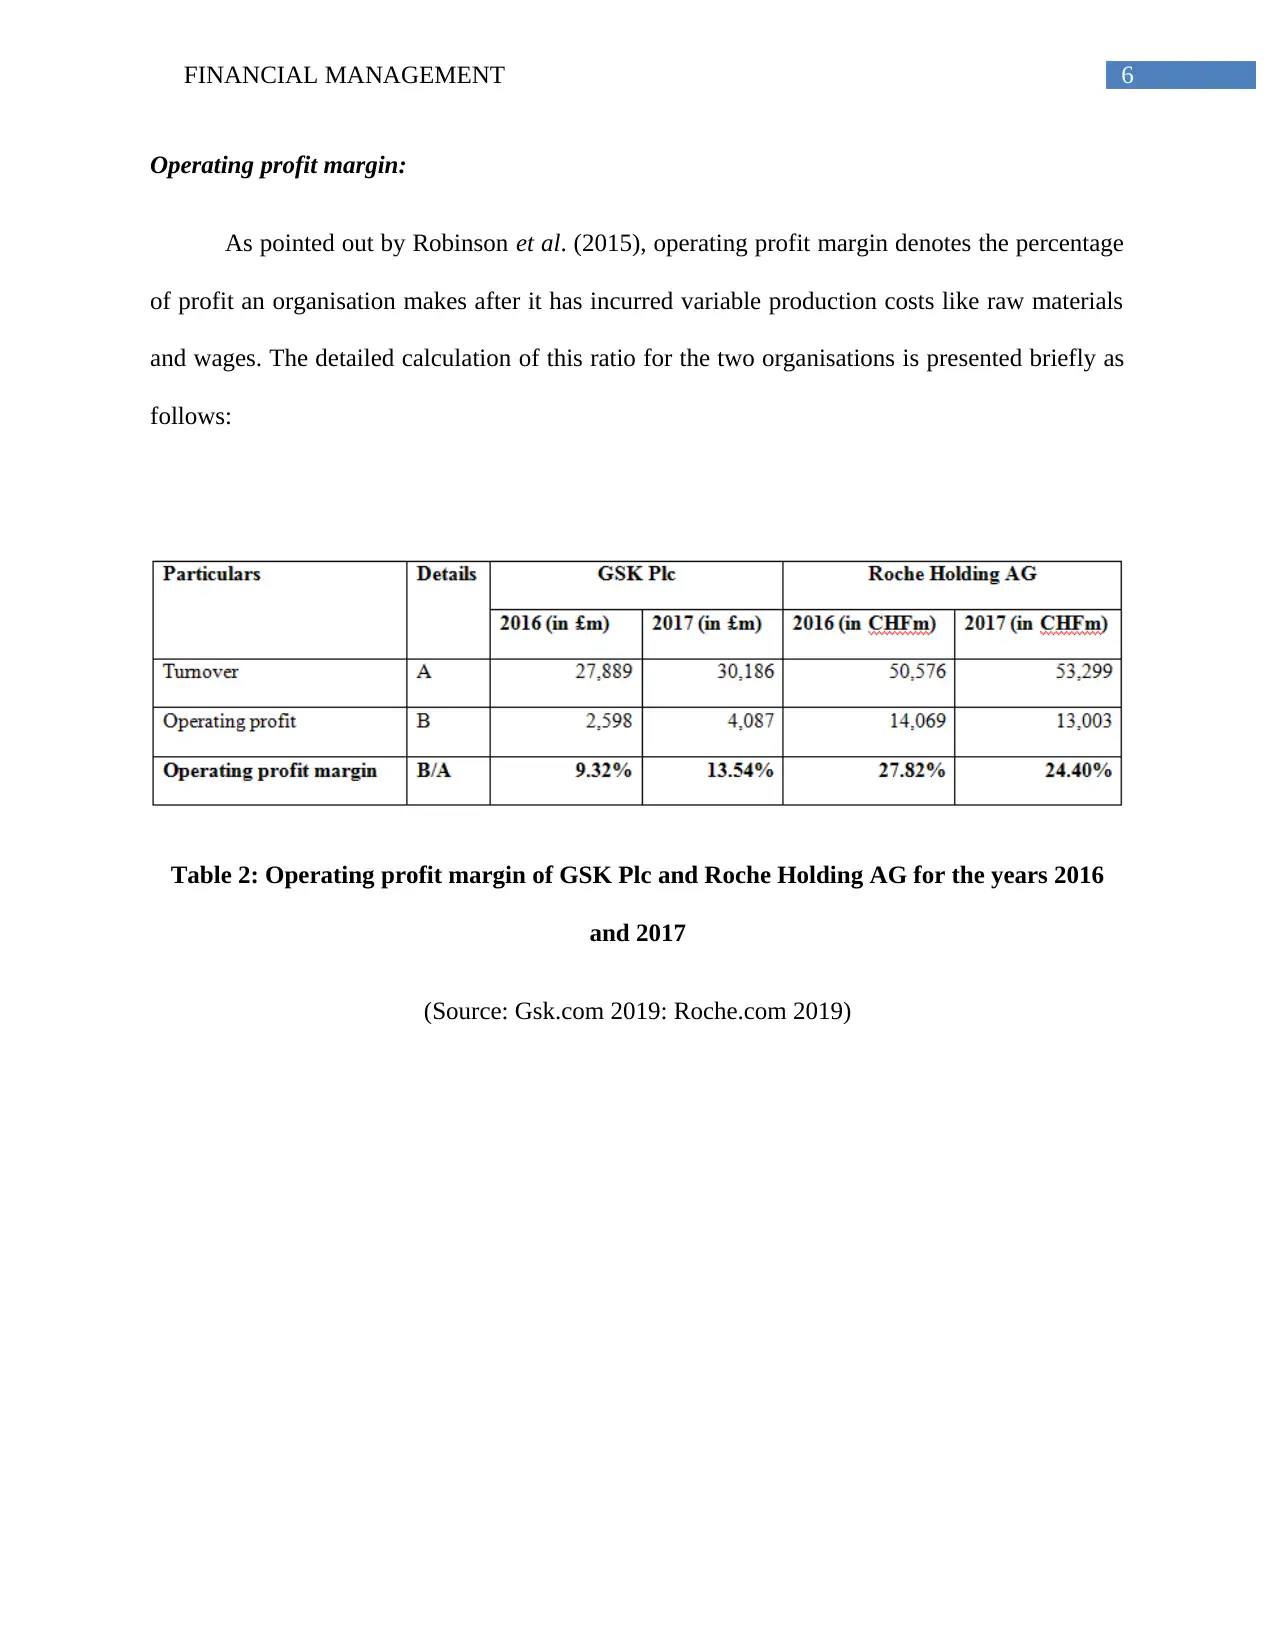
Operating profit margin:
As pointed out by Robinson et al. (2015), operating profit margin denotes the percentage
of profit an organisation makes after it has incurred variable production costs like raw materials
and wages. The detailed calculation of this ratio for the two organisations is presented briefly as
follows:
Table 2: Operating profit margin of GSK Plc and Roche Holding AG for the years 2016
and 2017
(Source: Gsk.com 2019: Roche.com 2019)
Paraphrase This Document
Need a fresh take? Get an instant paraphrase of this document with our AI Paraphraser
7FINANCIAL MANAGEMENT
2016 2017 2016 2017
GSK Plc Roche Holding AG
0.00%
5.00%
10.00%
15.00%
20.00%
25.00%
30.00%
9.32%
13.54%
27.82%
24.40%
Operating profit margin
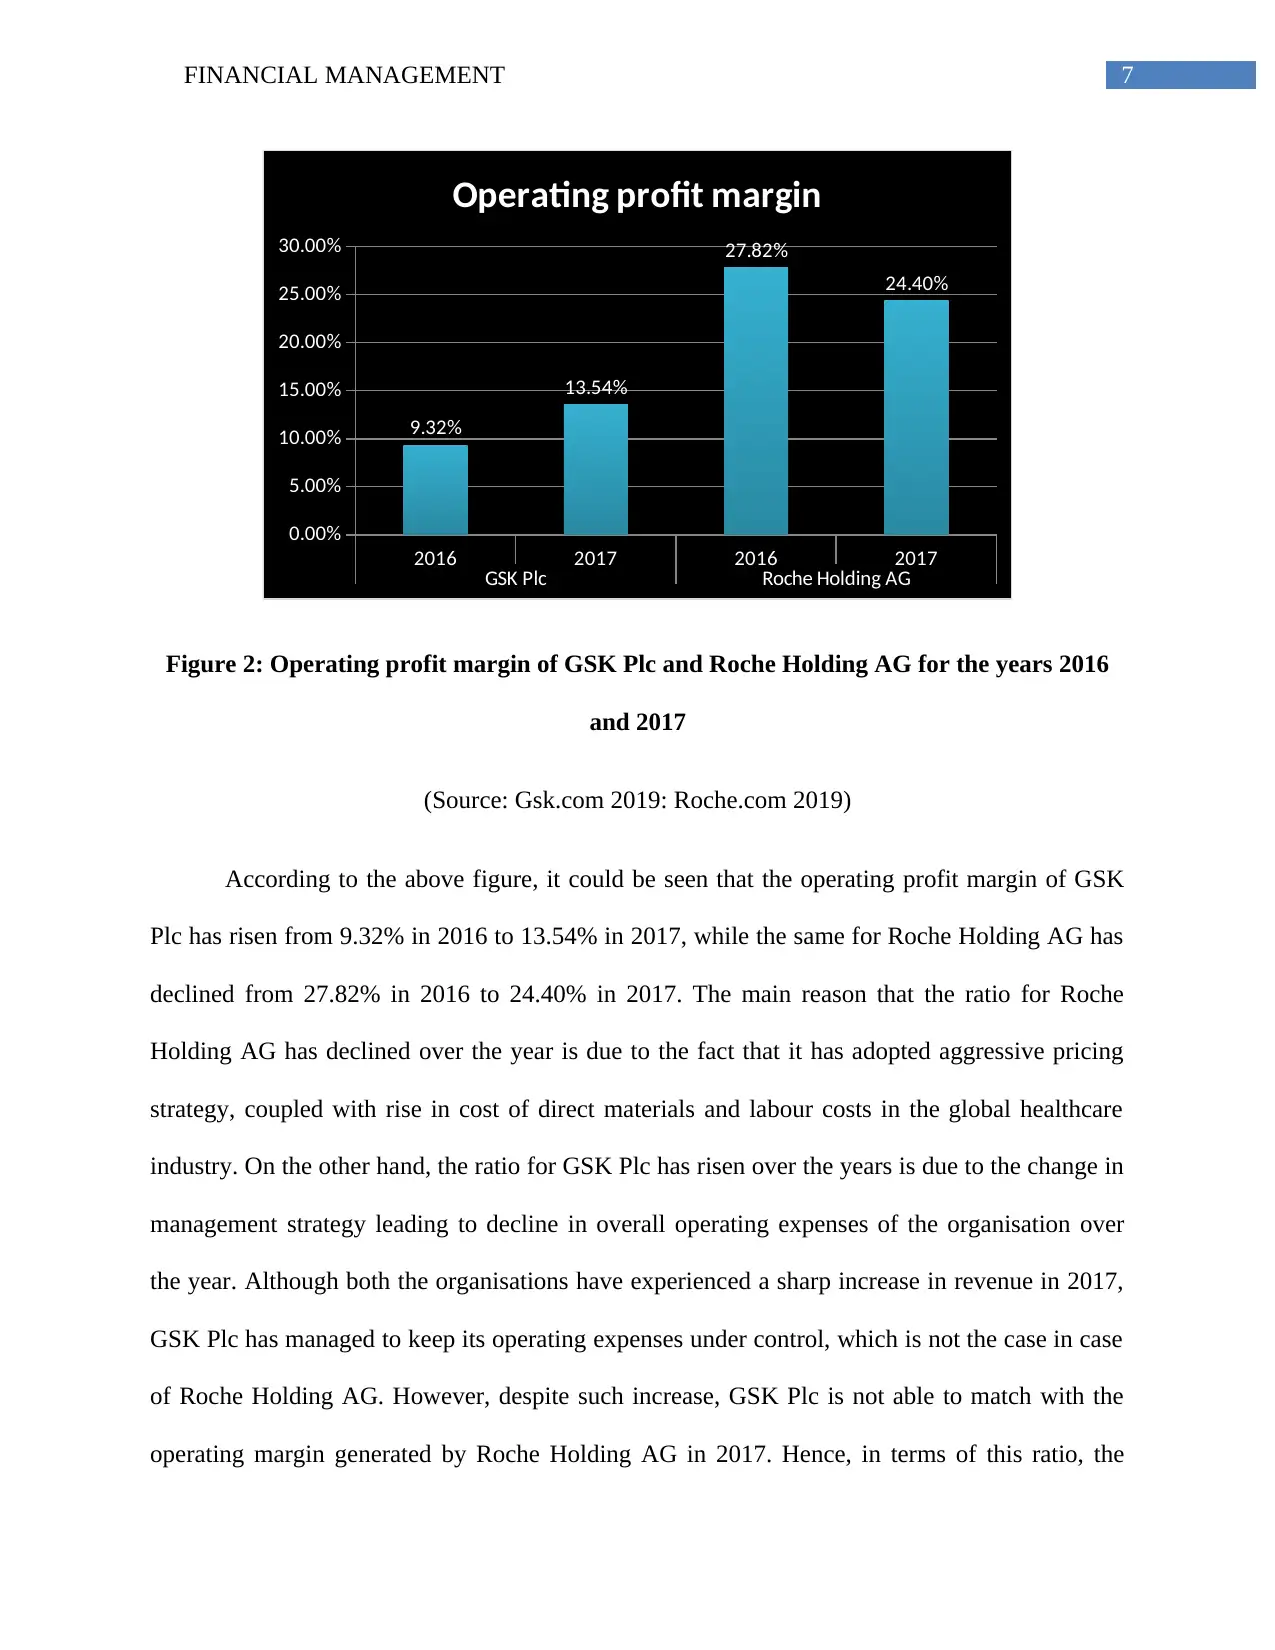
Figure 2: Operating profit margin of GSK Plc and Roche Holding AG for the years 2016
and 2017
(Source: Gsk.com 2019: Roche.com 2019)
According to the above figure, it could be seen that the operating profit margin of GSK
Plc has risen from 9.32% in 2016 to 13.54% in 2017, while the same for Roche Holding AG has
declined from 27.82% in 2016 to 24.40% in 2017. The main reason that the ratio for Roche
Holding AG has declined over the year is due to the fact that it has adopted aggressive pricing
strategy, coupled with rise in cost of direct materials and labour costs in the global healthcare
industry. On the other hand, the ratio for GSK Plc has risen over the years is due to the change in
management strategy leading to decline in overall operating expenses of the organisation over
the year. Although both the organisations have experienced a sharp increase in revenue in 2017,
GSK Plc has managed to keep its operating expenses under control, which is not the case in case
of Roche Holding AG. However, despite such increase, GSK Plc is not able to match with the
operating margin generated by Roche Holding AG in 2017. Hence, in terms of this ratio, the
2016 2017 2016 2017
GSK Plc Roche Holding AG
0.00%
5.00%
10.00%
15.00%
20.00%
25.00%
30.00%
9.32%
13.54%
27.82%
24.40%
Operating profit margin
Figure 2: Operating profit margin of GSK Plc and Roche Holding AG for the years 2016
and 2017
(Source: Gsk.com 2019: Roche.com 2019)
According to the above figure, it could be seen that the operating profit margin of GSK
Plc has risen from 9.32% in 2016 to 13.54% in 2017, while the same for Roche Holding AG has
declined from 27.82% in 2016 to 24.40% in 2017. The main reason that the ratio for Roche
Holding AG has declined over the year is due to the fact that it has adopted aggressive pricing
strategy, coupled with rise in cost of direct materials and labour costs in the global healthcare
industry. On the other hand, the ratio for GSK Plc has risen over the years is due to the change in
management strategy leading to decline in overall operating expenses of the organisation over
the year. Although both the organisations have experienced a sharp increase in revenue in 2017,
GSK Plc has managed to keep its operating expenses under control, which is not the case in case
of Roche Holding AG. However, despite such increase, GSK Plc is not able to match with the
operating margin generated by Roche Holding AG in 2017. Hence, in terms of this ratio, the
8FINANCIAL MANAGEMENT
competitive position of Roche Holding AG is better in comparison to GSK Plc in the global
healthcare industry.
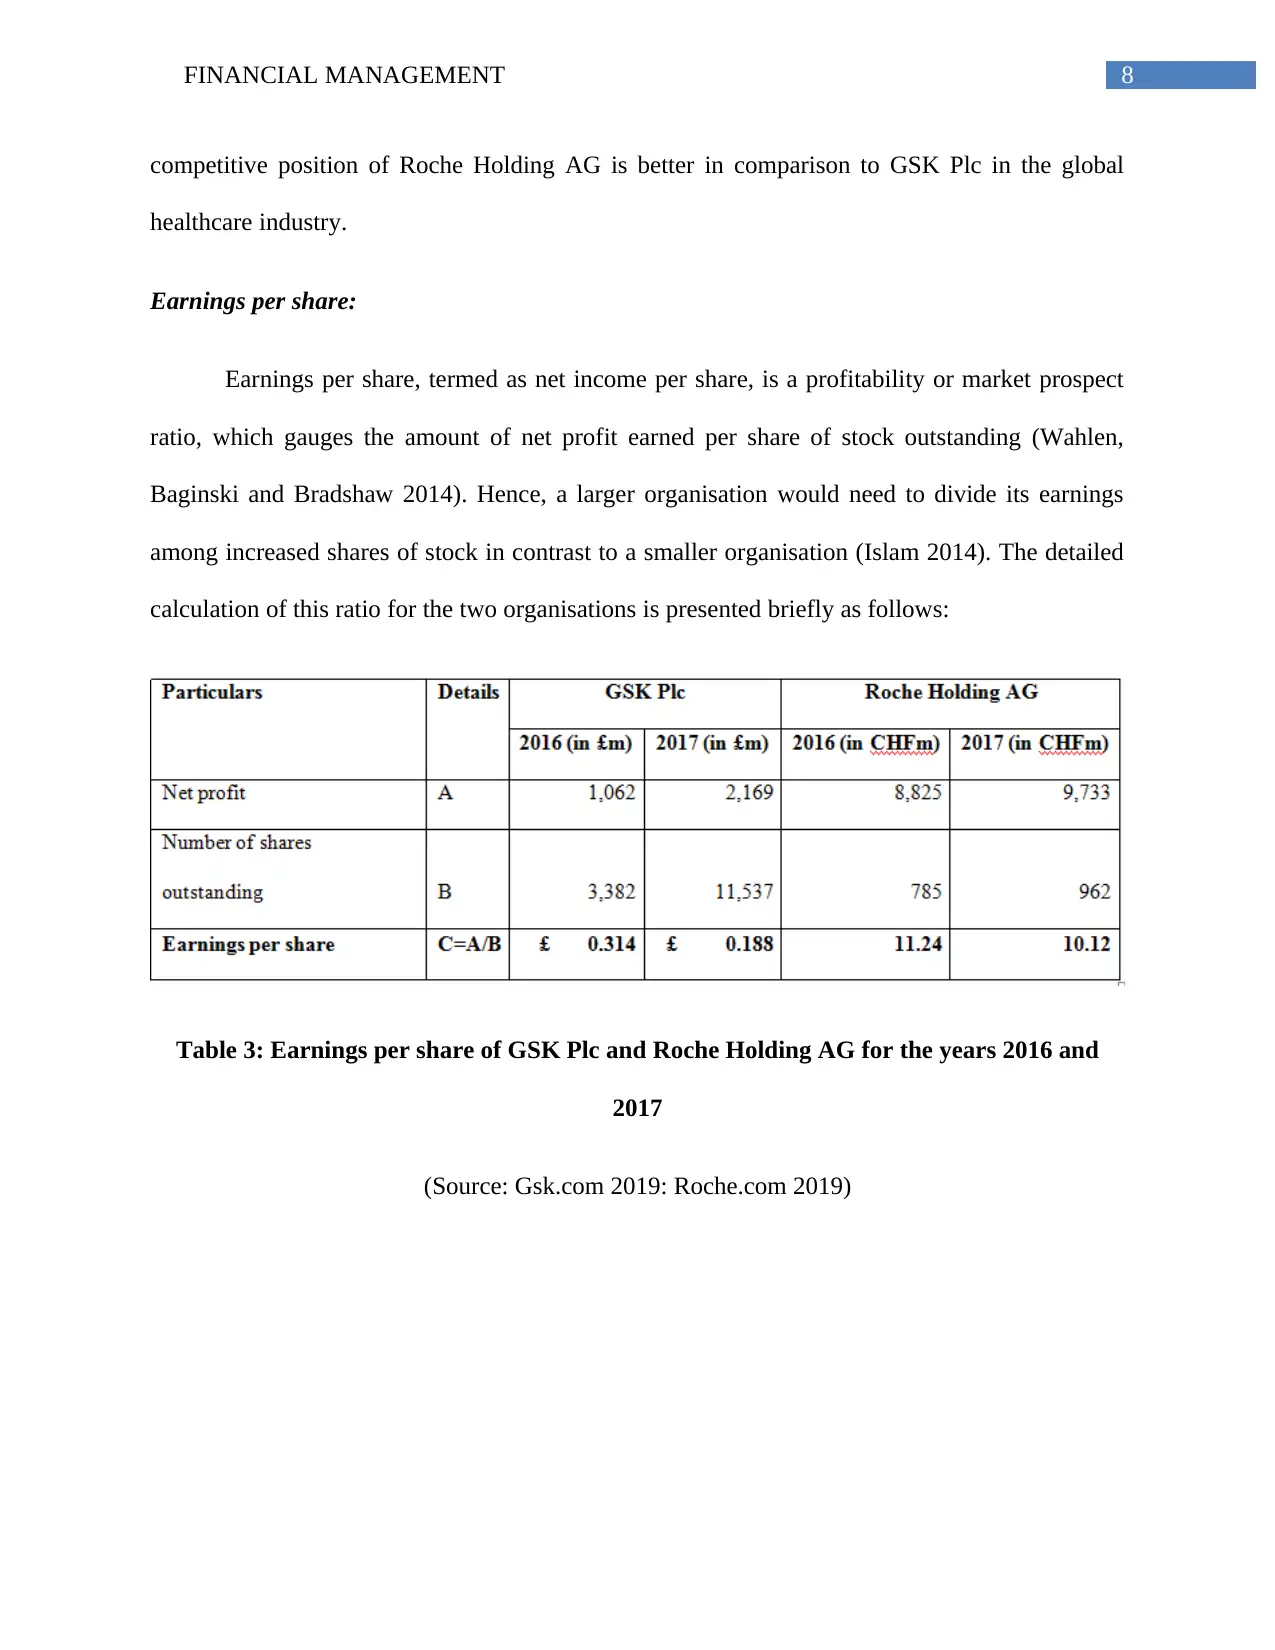
Earnings per share:
Earnings per share, termed as net income per share, is a profitability or market prospect
ratio, which gauges the amount of net profit earned per share of stock outstanding (Wahlen,
Baginski and Bradshaw 2014). Hence, a larger organisation would need to divide its earnings
among increased shares of stock in contrast to a smaller organisation (Islam 2014). The detailed
calculation of this ratio for the two organisations is presented briefly as follows:
Table 3: Earnings per share of GSK Plc and Roche Holding AG for the years 2016 and
2017
(Source: Gsk.com 2019: Roche.com 2019)
competitive position of Roche Holding AG is better in comparison to GSK Plc in the global
healthcare industry.
Earnings per share:
Earnings per share, termed as net income per share, is a profitability or market prospect
ratio, which gauges the amount of net profit earned per share of stock outstanding (Wahlen,
Baginski and Bradshaw 2014). Hence, a larger organisation would need to divide its earnings
among increased shares of stock in contrast to a smaller organisation (Islam 2014). The detailed
calculation of this ratio for the two organisations is presented briefly as follows:
Table 3: Earnings per share of GSK Plc and Roche Holding AG for the years 2016 and
2017
(Source: Gsk.com 2019: Roche.com 2019)
⊘ This is a preview!⊘
Do you want full access?
Subscribe today to unlock all pages.
Trusted by 1+ million students worldwide
9FINANCIAL MANAGEMENT
2016 2017 2016 2017
GSK Plc Roche Holding AG
£-
£2.000
£4.000
£6.000
£8.000
£10.000
£12.000
£0.314 £0.188
£11.242
£10.117
Earnings per share
Figure 3: Earnings per share of GSK Plc and Roche Holding AG for the years 2016 and
2017
(Source: Gsk.com 2019: Roche.com 2019)
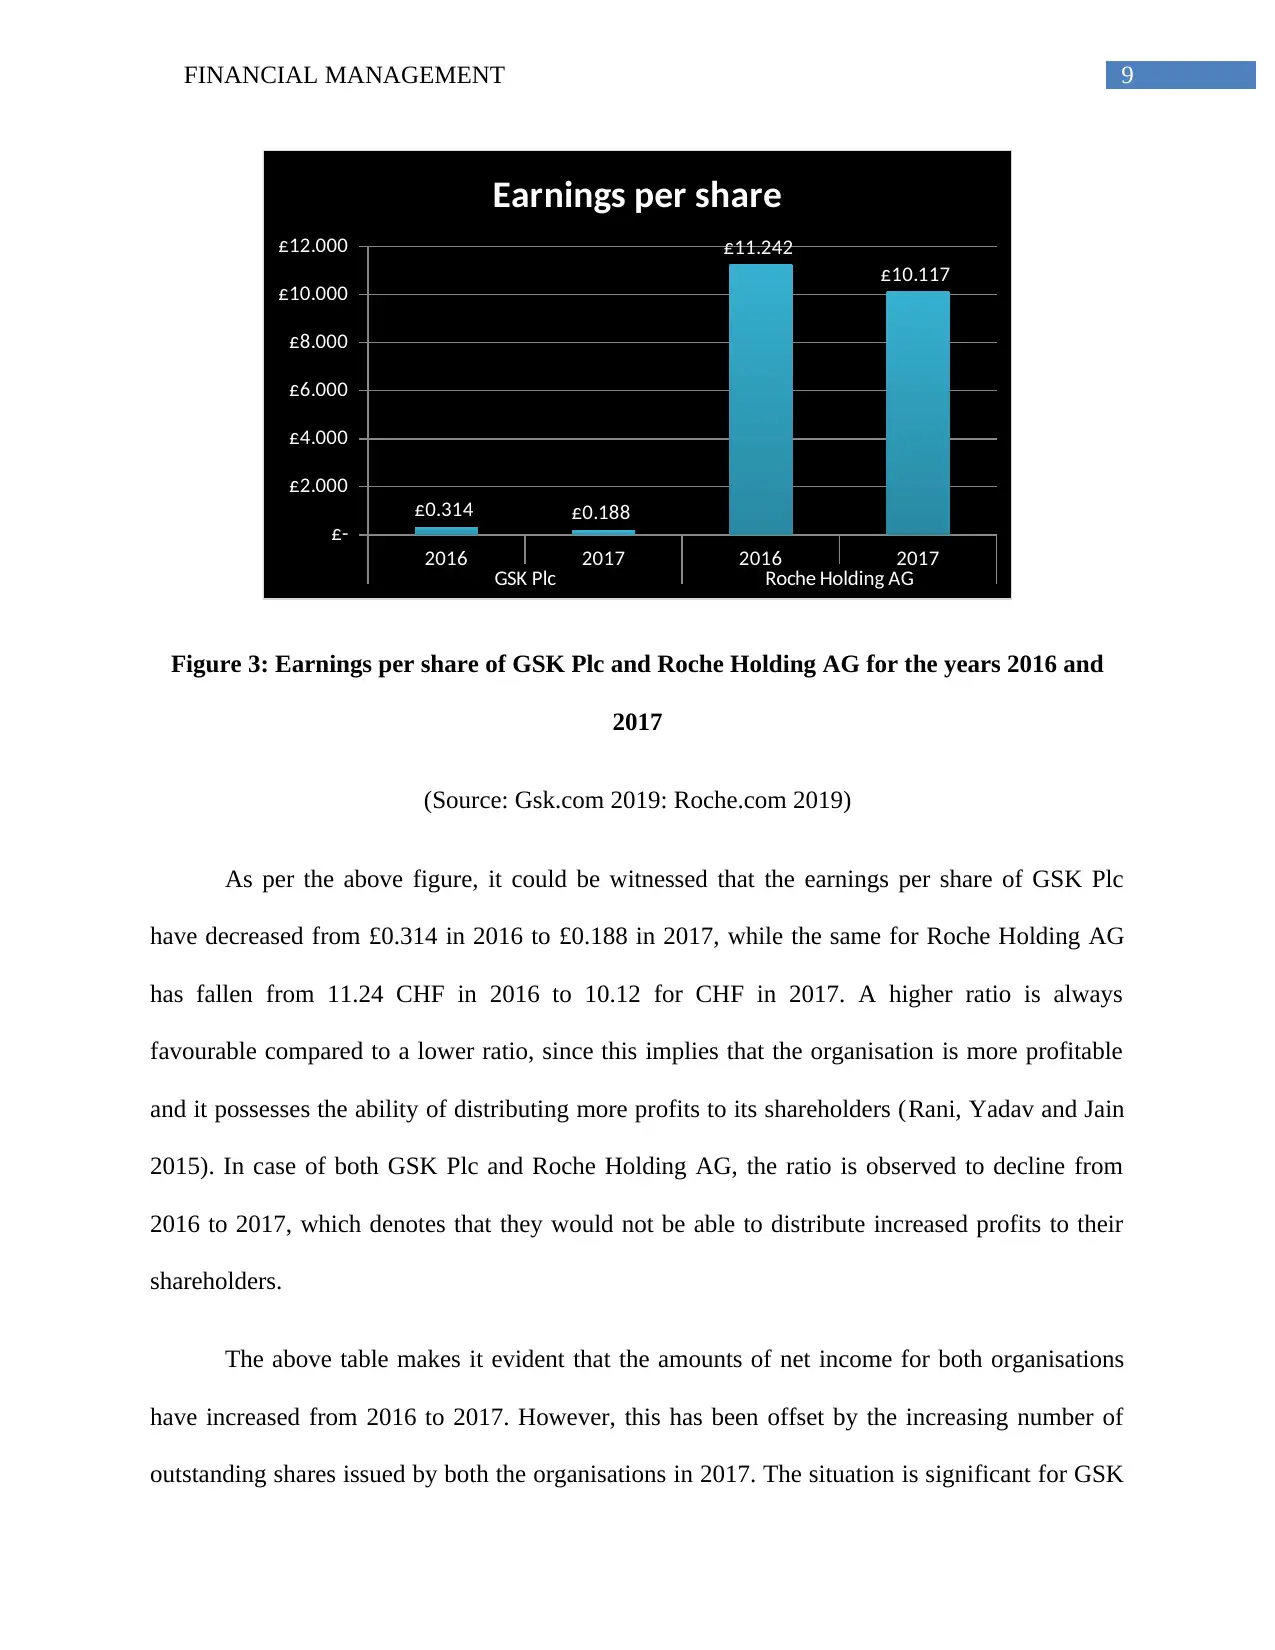
As per the above figure, it could be witnessed that the earnings per share of GSK Plc
have decreased from £0.314 in 2016 to £0.188 in 2017, while the same for Roche Holding AG
has fallen from 11.24 CHF in 2016 to 10.12 for CHF in 2017. A higher ratio is always
favourable compared to a lower ratio, since this implies that the organisation is more profitable
and it possesses the ability of distributing more profits to its shareholders (Rani, Yadav and Jain
2015). In case of both GSK Plc and Roche Holding AG, the ratio is observed to decline from
2016 to 2017, which denotes that they would not be able to distribute increased profits to their
shareholders.
The above table makes it evident that the amounts of net income for both organisations
have increased from 2016 to 2017. However, this has been offset by the increasing number of
outstanding shares issued by both the organisations in 2017. The situation is significant for GSK
2016 2017 2016 2017
GSK Plc Roche Holding AG
£-
£2.000
£4.000
£6.000
£8.000
£10.000
£12.000
£0.314 £0.188
£11.242
£10.117
Earnings per share
Figure 3: Earnings per share of GSK Plc and Roche Holding AG for the years 2016 and
2017
(Source: Gsk.com 2019: Roche.com 2019)
As per the above figure, it could be witnessed that the earnings per share of GSK Plc
have decreased from £0.314 in 2016 to £0.188 in 2017, while the same for Roche Holding AG
has fallen from 11.24 CHF in 2016 to 10.12 for CHF in 2017. A higher ratio is always
favourable compared to a lower ratio, since this implies that the organisation is more profitable
and it possesses the ability of distributing more profits to its shareholders (Rani, Yadav and Jain
2015). In case of both GSK Plc and Roche Holding AG, the ratio is observed to decline from
2016 to 2017, which denotes that they would not be able to distribute increased profits to their
shareholders.
The above table makes it evident that the amounts of net income for both organisations
have increased from 2016 to 2017. However, this has been offset by the increasing number of
outstanding shares issued by both the organisations in 2017. The situation is significant for GSK
Paraphrase This Document
Need a fresh take? Get an instant paraphrase of this document with our AI Paraphraser
10FINANCIAL MANAGEMENT
Plc, as the number of shares issued has increased from 3,382 in 2016 to 11,537 in 2017, while
the same has increased from 785 in 2016 to 962 in 2017 for Roche Holding AG. Due to this, the
earnings per share of the two organisations have declined in 2017. However, it is noteworthy to
mention that the ratio still seems to be better for Roche Holding AG compared to GSK Plc and
hence, investing in the shares of the former would be a profitable option for the investors (Faello
2015).
Conclusion:
From the above discussion, it is apparent that for conducting the profitability analysis of
GSK Plc and Roche Holding AG, return on capital employed, operating profit margin and
earnings per share have been taken into consideration. In terms of all the ratios, it has been found
that the position of Roche Holding AG is found to be more favourable compared to GSK Plc
because of increased revenue and controlled operating expenses over the year. Over the years, it
has been projected that the trend for few medicines would continue to lose exclusivity in US and
Europe markets, which would affect the operating income of Roche Holding AG as well in
future. Moreover, Roche Holding AG has not issued too much additional equity shares in the
market owing to which earnings per share have not declined significantly, as in the case of GSK
Plc. Hence, it could be inferred that Roche Holding AG is enjoying competitive edge over GSK
Plc in the global healthcare market in terms of profitability.
Part 2:
Introduction:
The current study discusses the concept of zero based budgeting (ZBB). The ZBB is a
process of budgeting where all the expenditures need to be rationalised for every new financial
period. The method of ZBB begins from "zero base" and each activity within a company is
11FINANCIAL MANAGEMENT
examined for its requirements and expenditures. Then the Budget is prepared for the upcoming
period, disregarding the fact that the current budget could be either higher or lower than the
earlier period (Miller 2018). The first part of this study introduces the features of ZBB, followed
by the advantages and disadvantages of ZBB and finally we take a look on the best way to
implement ZBB based on different aspects, which are related to it.
Advantages and disadvantages of Zero Based Budgeting:
The advantages are discussed below -
Accuracy -
As opposed to the traditional budgeting process, in which just some random variations
are being made to the budget of the earlier years, ZBB makes each sector to overview each and
every commodity cash flow and calculate the operational expenses (Lin and 2017). This would
help in reducing the expenditures as it would clearly give an overview of these expenses against
the anticipated performance.
Efficiency -
ZBB assists in allotment of resources (sector wise), as it does not pay any attention to the
past figures. However, it pays a close attention to the real figures.
Reduction of unnecessary functionalities -
This process allows to recognise those events, which would allow the activities to take
place in a (cost effective) manner that would lead to the reduction of (unproductive) and
unnecessary functionalities.
Budget inflation -
⊘ This is a preview!⊘
Do you want full access?
Subscribe today to unlock all pages.
Trusted by 1+ million students worldwide
1 out of 27
Related Documents


Your All-in-One AI-Powered Toolkit for Academic Success.
+13062052269
info@desklib.com
Available 24*7 on WhatsApp / Email
![[object Object]](/_next/static/media/star-bottom.7253800d.svg)
Unlock your academic potential
Copyright © 2020–2026 A2Z Services. All Rights Reserved. Developed and managed by ZUCOL.