Financial Performance Report: BENDIGO & ADELAIDE BANK vs. QUEENSLAND
VerifiedAdded on 2021/06/14
|24
|6983
|19
Report
AI Summary
This report provides a detailed financial analysis of BENDIGO AND ADELAIDE BANK LTD and BANK OF QUEENSLAND LTD, focusing on their financial performance and position. It utilizes ratio analysis to evaluate short-term solvency, long-term solvency, asset utilization, profitability, and market value. The analysis reveals that BANK OF QUEENSLAND LTD generally exhibits better financial performance and lower risk compared to BENDIGO AND ADELAIDE BANK LTD, making it a potentially better investment option. The report includes calculations and comparisons of key financial ratios such as current ratio, acid-test ratio, gearing ratio, and interest coverage ratio, drawing conclusions based on the data from 2016 and 2017.
Running Head: Business Finance
1
Project Report: Business Finance
1
Project Report: Business Finance
Paraphrase This Document
Need a fresh take? Get an instant paraphrase of this document with our AI Paraphraser
Business Finance
2
Executive summary
Financial analysis is a process to evaluate the financial performance and the position of
an organization. It is essential for the internal management of the company as well as the
external parties of the company to evaluate the performance of the company. The report has
been prepared to evaluate the financial performance of BENDIGO AND ADELAIDE BANK
LTD and BANK OF QUEENSLAND LTD. BANK OF QUEENSLAND LTD and
BENDIGO AND ADELAIDE BANK LTD are operating their business in Australian market
in the same industry. The financial analysis study on both the company explains that the
performance of the bank, BANK OF QUEENSLAND LTD is better than the other bank and
thus the investment into the company would be a better option.
Business Finance
3
Contents
Introduction.......................................................................................................................5
Company overview...........................................................................................................5
BENDIGO AND ADELAIDE BANK LTD................................................................5
BANK OF QUEENSLAND LTD................................................................................5
Financial analysis (ratio analysis).....................................................................................6
Short term solvency position........................................................................................6
Long term solvency position........................................................................................7
Asset utilization............................................................................................................9
Profitability ratios.......................................................................................................11
Market value ratios.....................................................................................................13
Recommendation............................................................................................................14
Conclusion......................................................................................................................15
References.......................................................................................................................16
Annual report. 2017........................................................................................................16
Annual report. 2018........................................................................................................16
Bloomberg. 2018............................................................................................................16
Bloomberg. 2018............................................................................................................16
Home. 2018.....................................................................................................................17
Home. 2018.....................................................................................................................17
Morningstar. 2018...........................................................................................................17
Morningstar. 2018...........................................................................................................17
Yahoo finance. 2018.......................................................................................................17
Appendix.........................................................................................................................18
⊘ This is a preview!⊘
Do you want full access?
Subscribe today to unlock all pages.
Trusted by 1+ million students worldwide

Business Finance
4
4
Paraphrase This Document
Need a fresh take? Get an instant paraphrase of this document with our AI Paraphraser
Business Finance
5
Introduction:
Business finance is a branch of finance which is used to evaluate the fund of the
company. Business finance evaluates the financial statement and the transaction of an
organization to evaluate the performance of the company and make a conclusion about the
process of the company. Business finance follows process of financial analysis to evaluate the
financial performance and the position of an organization (Bierman, 2010). Financial
performance evaluation makes it easy for the stakeholders of the company to analyze that
whether the company is performing well in the market or not. It is essential for the internal
management of the company as well as the external parties of the company to evaluate the
performance of the company (Baker and Nofsinger, 2010). This offers a good base to the
parties to make better decisions. The report has been prepared to evaluate the financial
performance of BENDIGO AND ADELAIDE BANK LTD and BANK OF QUEENSLAND
LTD.
Company overview:
BENDIGO AND ADELAIDE BANK LTD:
It is an Australian financial institution which is operating its business in retail sector
of Australia. The company is a result f merger of Bendigo bank and Adelaide bank. The
merger has taken place in 2007. Headquarter of the bank is in Bendigo, Australia. The main
products of the bank are banking services, financial services and other services which are
related to banking (Home, 2018). The bank is currently serving its services through 400
outlets in Australia. The merger has helped the company to grow the market as well as the
market base of the company has also been enhanced (Bloomberg, 2018).
BANK OF QUEENSLAND LTD:
The bank of Queensland is an Australian financial institution which is operating its
business in retail sector of Australia. The company is one of the oldest financial institutions in
the market of Queensland (Home, 2018). The company has been established in 1874 and
currently, it has a network of 252 branched which includes the 166 owner managed branches
and 78 corporate branches. Headquarter of the bank is in Queensland, Australia. The main
products of the bank are consumer banking, finance and insurance, commercial banking,
credit cards etc. The bank has surveyed and it has been found that 88% customers of the
Business Finance
6
company are satisfied with the services of the company (Bloomberg, 2018). The total revenue
of the company briefs about the better performance of the company.
Financial analysis (ratio analysis):
In the report, performance of both the banks, BENDIGO AND ADELAIDE BANK
LTD and BANK OF QUEENSLAND LTD have been identified to evaluate the investment
position of the company. The financial performance of the company has been evaluated on
the basis of ratio analysis study. Ratio analysis is a process to evaluate the quantitative
position of an organization. It is used to analyze the related factors of financial position of an
organization. It also helps an investor to evaluate 2 or more companies together to reach over
a conclusion about the better investment choice. Ratio analysis evaluates the liquidity,
profitability, efficiency, market value and the long term solvency position of an organization
and offers information about the financial position of an organization (Gibson, 2011).
In the report, ratio analysis study has been performed on BENDIGO AND
ADELAIDE BANK LTD and BANK OF QUEENSLAND LTD to make a conclusion about
the better investment choice. Liquidity position, profitability position, efficiency position,
market value position and the long term solvency position has been calculated of both the
companies to recognize the performance of the company. Following is the study of ratio
analysis over both the companies:
Short term solvency position:
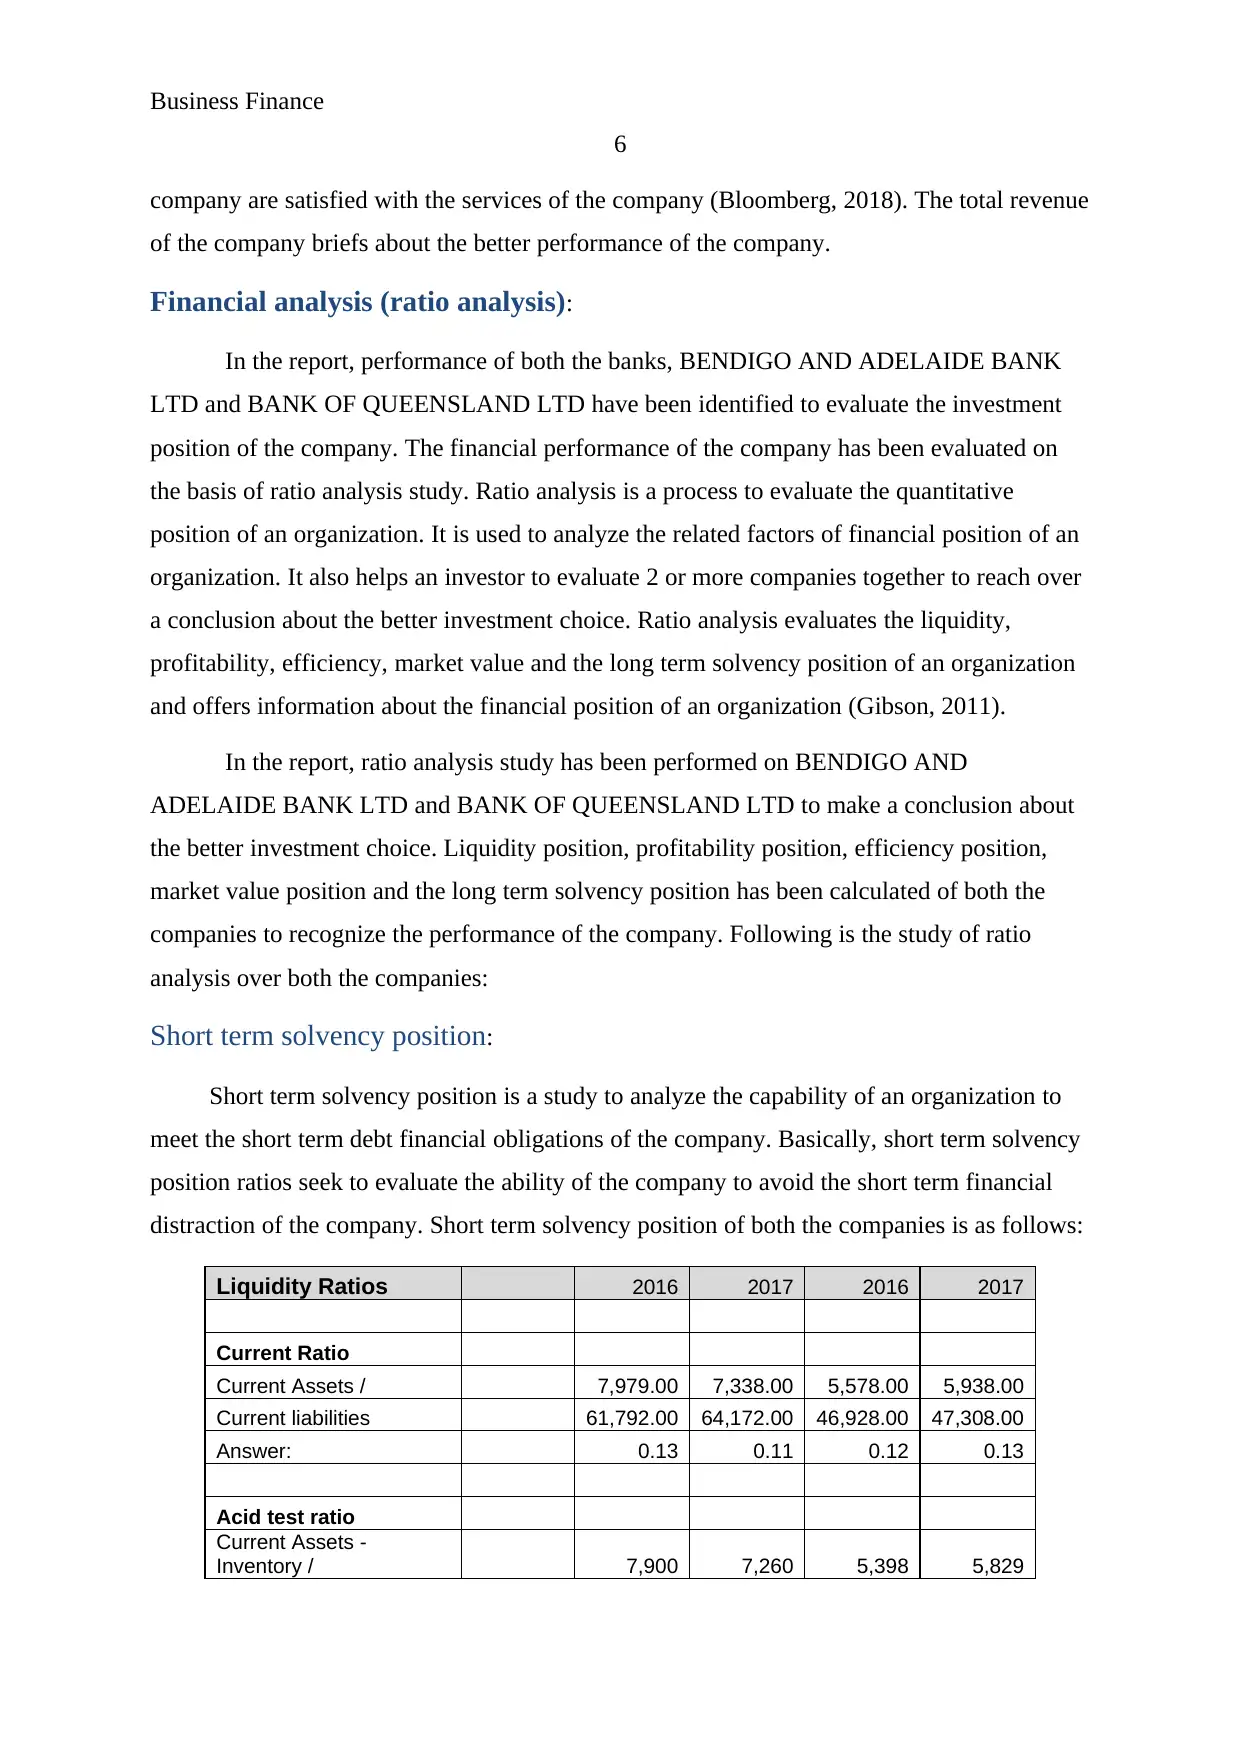
Short term solvency position is a study to analyze the capability of an organization to
meet the short term debt financial obligations of the company. Basically, short term solvency
position ratios seek to evaluate the ability of the company to avoid the short term financial
distraction of the company. Short term solvency position of both the companies is as follows:
Liquidity Ratios 2016 2017 2016 2017
Current Ratio
Current Assets / 7,979.00 7,338.00 5,578.00 5,938.00
Current liabilities 61,792.00 64,172.00 46,928.00 47,308.00
Answer: 0.13 0.11 0.12 0.13
Acid test ratio
Current Assets -
Inventory / 7,900 7,260 5,398 5,829
6
company are satisfied with the services of the company (Bloomberg, 2018). The total revenue
of the company briefs about the better performance of the company.
Financial analysis (ratio analysis):
In the report, performance of both the banks, BENDIGO AND ADELAIDE BANK
LTD and BANK OF QUEENSLAND LTD have been identified to evaluate the investment
position of the company. The financial performance of the company has been evaluated on
the basis of ratio analysis study. Ratio analysis is a process to evaluate the quantitative
position of an organization. It is used to analyze the related factors of financial position of an
organization. It also helps an investor to evaluate 2 or more companies together to reach over
a conclusion about the better investment choice. Ratio analysis evaluates the liquidity,
profitability, efficiency, market value and the long term solvency position of an organization
and offers information about the financial position of an organization (Gibson, 2011).
In the report, ratio analysis study has been performed on BENDIGO AND
ADELAIDE BANK LTD and BANK OF QUEENSLAND LTD to make a conclusion about
the better investment choice. Liquidity position, profitability position, efficiency position,
market value position and the long term solvency position has been calculated of both the
companies to recognize the performance of the company. Following is the study of ratio
analysis over both the companies:
Short term solvency position:
Short term solvency position is a study to analyze the capability of an organization to
meet the short term debt financial obligations of the company. Basically, short term solvency
position ratios seek to evaluate the ability of the company to avoid the short term financial
distraction of the company. Short term solvency position of both the companies is as follows:
Liquidity Ratios 2016 2017 2016 2017
Current Ratio
Current Assets / 7,979.00 7,338.00 5,578.00 5,938.00
Current liabilities 61,792.00 64,172.00 46,928.00 47,308.00
Answer: 0.13 0.11 0.12 0.13
Acid test ratio
Current Assets -
Inventory / 7,900 7,260 5,398 5,829
⊘ This is a preview!⊘
Do you want full access?
Subscribe today to unlock all pages.
Trusted by 1+ million students worldwide
Business Finance
7
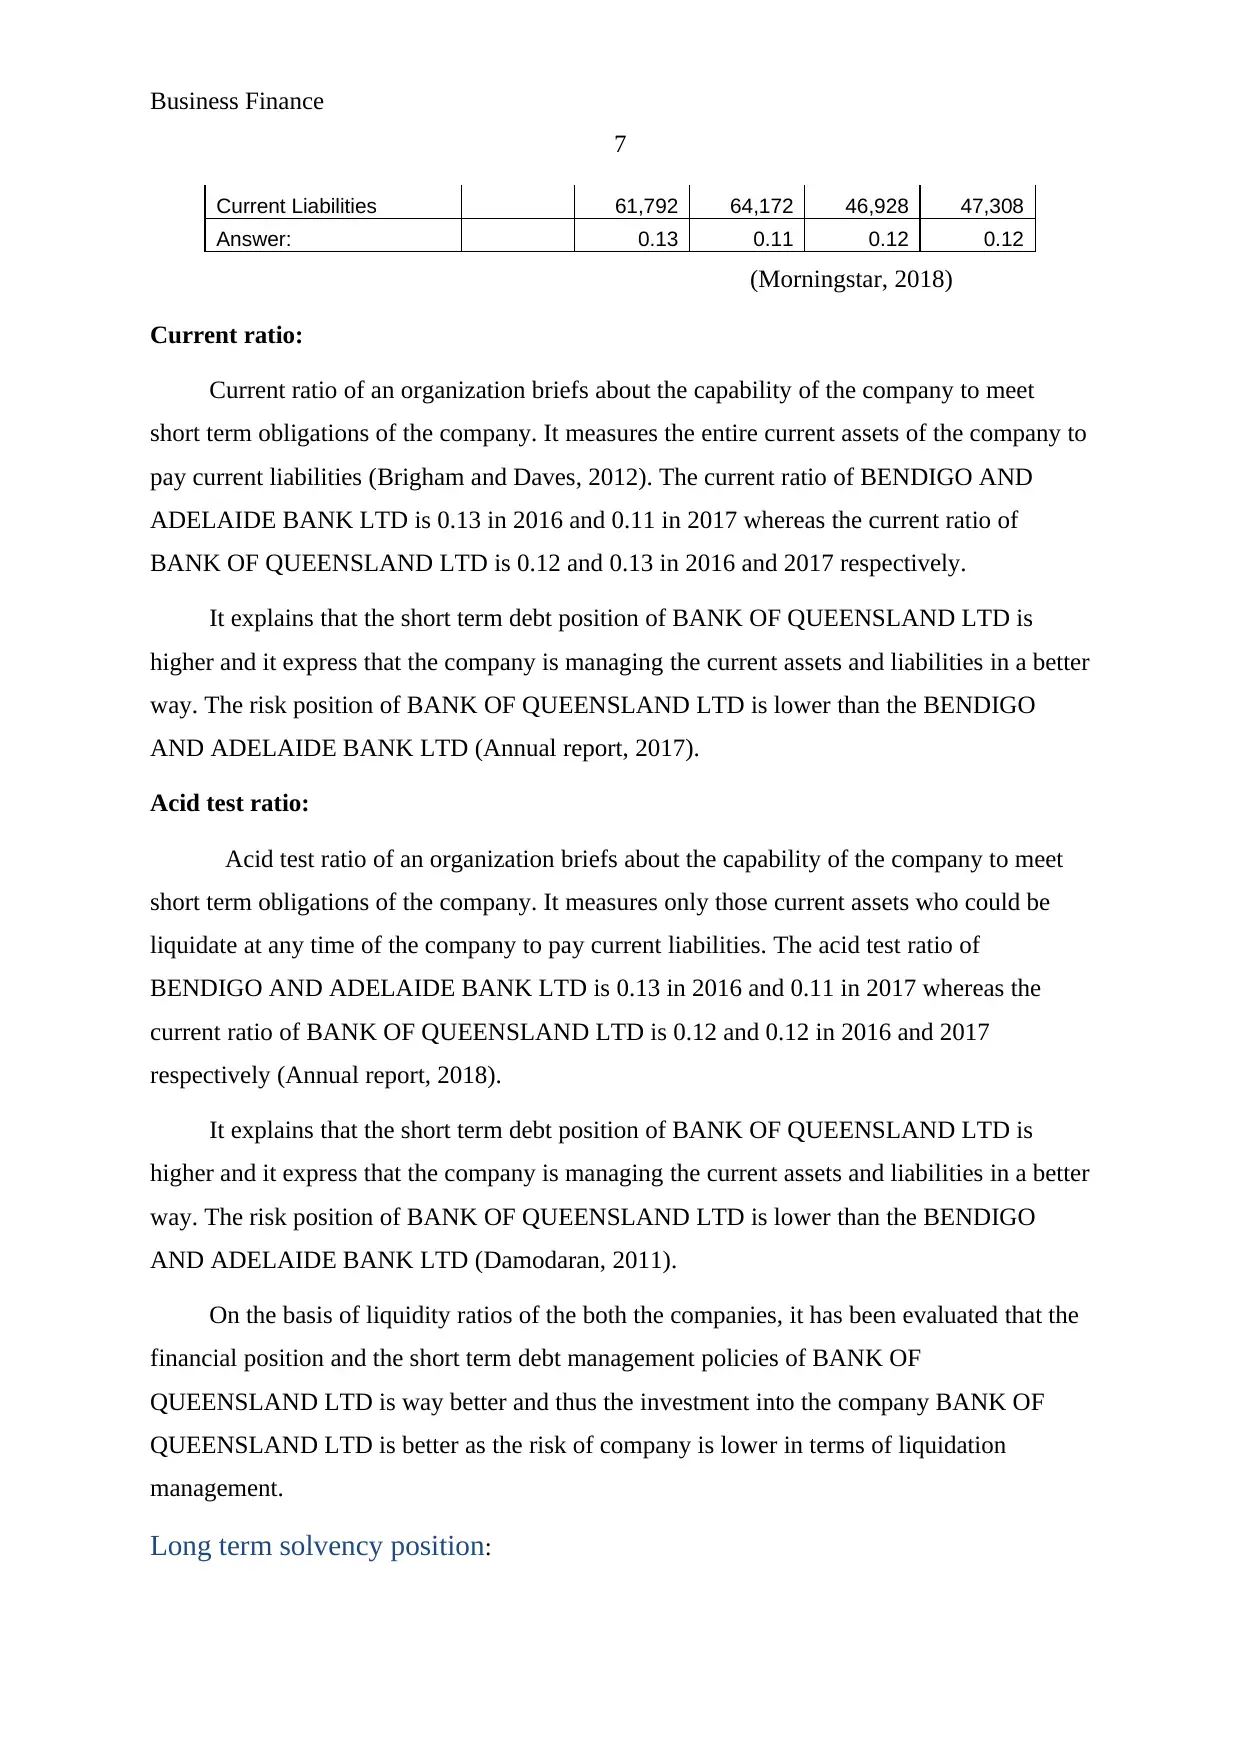
Current Liabilities 61,792 64,172 46,928 47,308
Answer: 0.13 0.11 0.12 0.12
(Morningstar, 2018)
Current ratio:
Current ratio of an organization briefs about the capability of the company to meet
short term obligations of the company. It measures the entire current assets of the company to
pay current liabilities (Brigham and Daves, 2012). The current ratio of BENDIGO AND
ADELAIDE BANK LTD is 0.13 in 2016 and 0.11 in 2017 whereas the current ratio of
BANK OF QUEENSLAND LTD is 0.12 and 0.13 in 2016 and 2017 respectively.
It explains that the short term debt position of BANK OF QUEENSLAND LTD is
higher and it express that the company is managing the current assets and liabilities in a better
way. The risk position of BANK OF QUEENSLAND LTD is lower than the BENDIGO
AND ADELAIDE BANK LTD (Annual report, 2017).
Acid test ratio:
Acid test ratio of an organization briefs about the capability of the company to meet
short term obligations of the company. It measures only those current assets who could be
liquidate at any time of the company to pay current liabilities. The acid test ratio of
BENDIGO AND ADELAIDE BANK LTD is 0.13 in 2016 and 0.11 in 2017 whereas the
current ratio of BANK OF QUEENSLAND LTD is 0.12 and 0.12 in 2016 and 2017
respectively (Annual report, 2018).
It explains that the short term debt position of BANK OF QUEENSLAND LTD is
higher and it express that the company is managing the current assets and liabilities in a better
way. The risk position of BANK OF QUEENSLAND LTD is lower than the BENDIGO
AND ADELAIDE BANK LTD (Damodaran, 2011).
On the basis of liquidity ratios of the both the companies, it has been evaluated that the
financial position and the short term debt management policies of BANK OF
QUEENSLAND LTD is way better and thus the investment into the company BANK OF
QUEENSLAND LTD is better as the risk of company is lower in terms of liquidation
management.
Long term solvency position:
7
Current Liabilities 61,792 64,172 46,928 47,308
Answer: 0.13 0.11 0.12 0.12
(Morningstar, 2018)
Current ratio:
Current ratio of an organization briefs about the capability of the company to meet
short term obligations of the company. It measures the entire current assets of the company to
pay current liabilities (Brigham and Daves, 2012). The current ratio of BENDIGO AND
ADELAIDE BANK LTD is 0.13 in 2016 and 0.11 in 2017 whereas the current ratio of
BANK OF QUEENSLAND LTD is 0.12 and 0.13 in 2016 and 2017 respectively.
It explains that the short term debt position of BANK OF QUEENSLAND LTD is
higher and it express that the company is managing the current assets and liabilities in a better
way. The risk position of BANK OF QUEENSLAND LTD is lower than the BENDIGO
AND ADELAIDE BANK LTD (Annual report, 2017).
Acid test ratio:
Acid test ratio of an organization briefs about the capability of the company to meet
short term obligations of the company. It measures only those current assets who could be
liquidate at any time of the company to pay current liabilities. The acid test ratio of
BENDIGO AND ADELAIDE BANK LTD is 0.13 in 2016 and 0.11 in 2017 whereas the
current ratio of BANK OF QUEENSLAND LTD is 0.12 and 0.12 in 2016 and 2017
respectively (Annual report, 2018).
It explains that the short term debt position of BANK OF QUEENSLAND LTD is
higher and it express that the company is managing the current assets and liabilities in a better
way. The risk position of BANK OF QUEENSLAND LTD is lower than the BENDIGO
AND ADELAIDE BANK LTD (Damodaran, 2011).
On the basis of liquidity ratios of the both the companies, it has been evaluated that the
financial position and the short term debt management policies of BANK OF
QUEENSLAND LTD is way better and thus the investment into the company BANK OF
QUEENSLAND LTD is better as the risk of company is lower in terms of liquidation
management.
Long term solvency position:
Paraphrase This Document
Need a fresh take? Get an instant paraphrase of this document with our AI Paraphraser
Business Finance
8
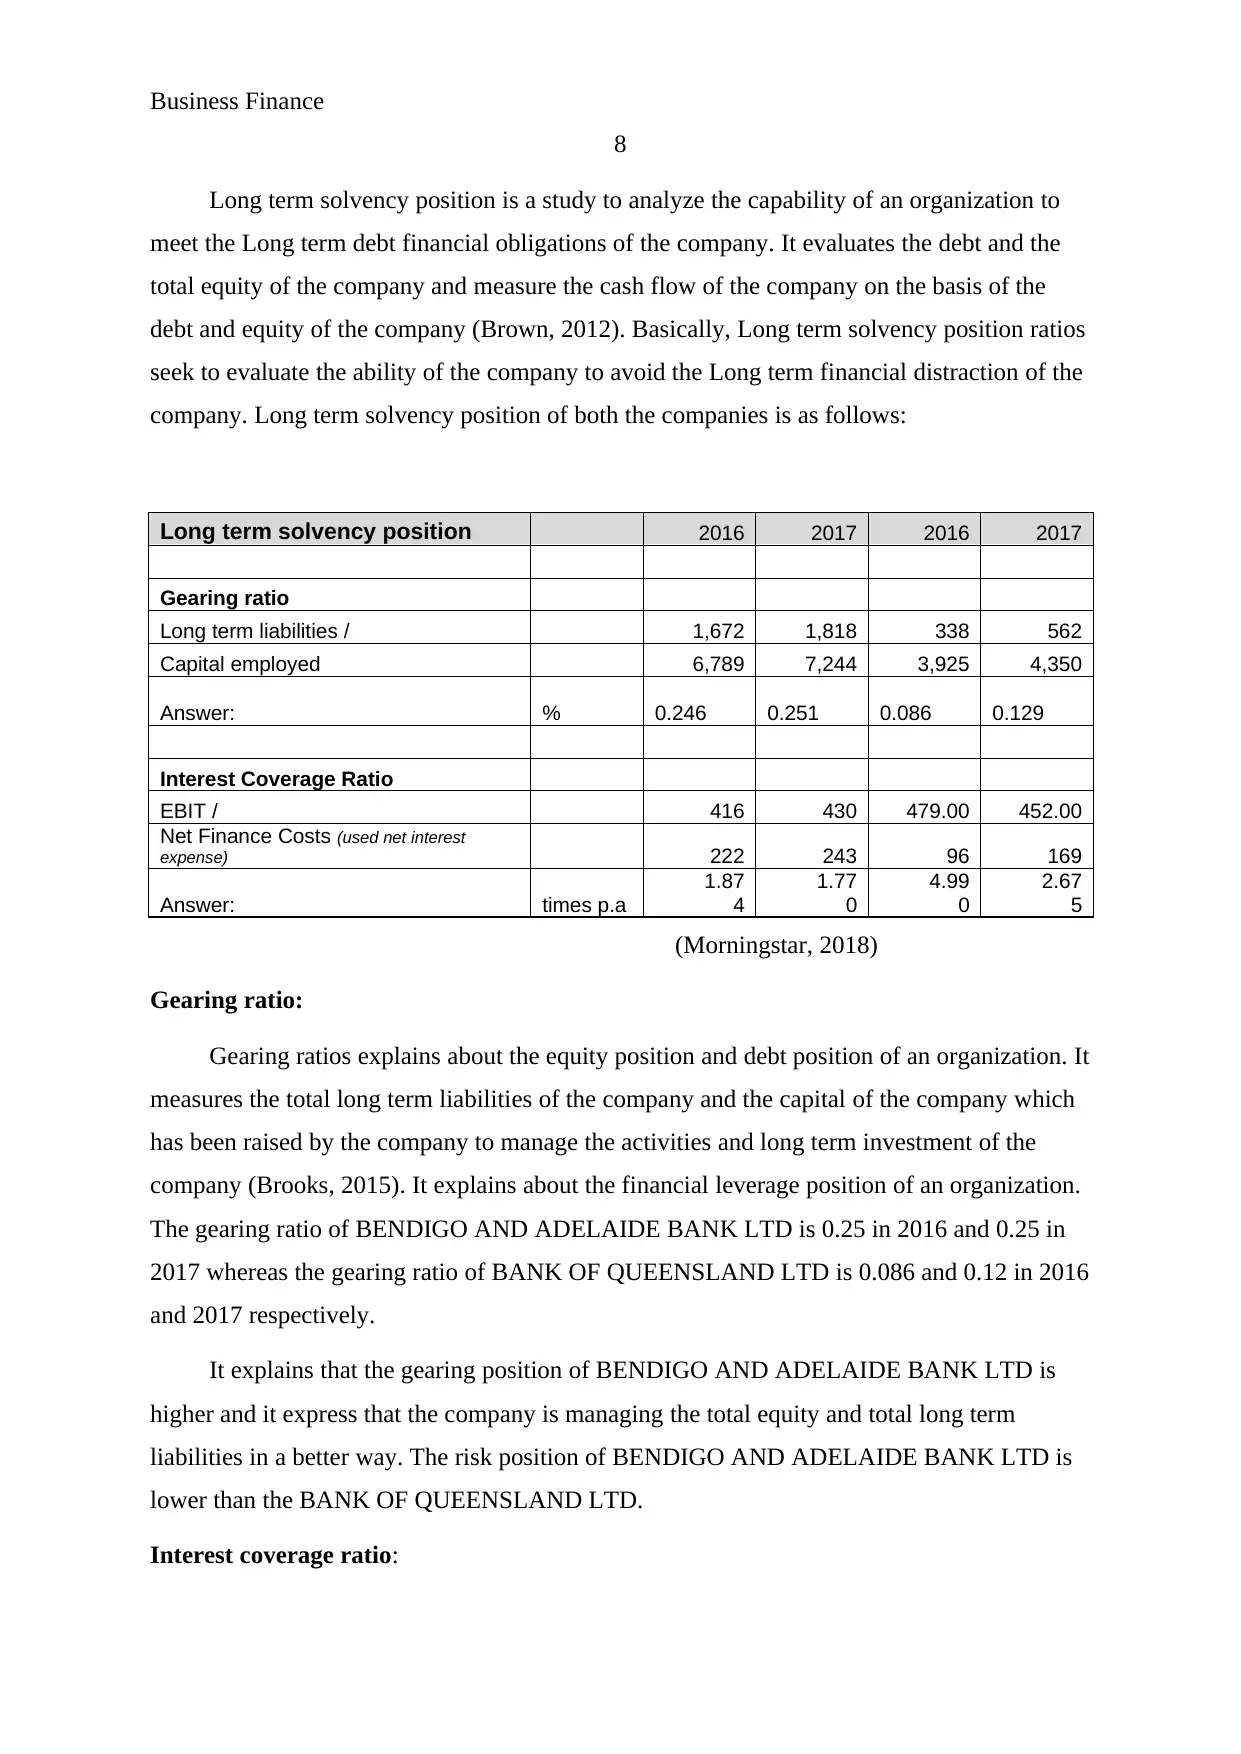
Long term solvency position is a study to analyze the capability of an organization to
meet the Long term debt financial obligations of the company. It evaluates the debt and the
total equity of the company and measure the cash flow of the company on the basis of the
debt and equity of the company (Brown, 2012). Basically, Long term solvency position ratios
seek to evaluate the ability of the company to avoid the Long term financial distraction of the
company. Long term solvency position of both the companies is as follows:
Long term solvency position 2016 2017 2016 2017
Gearing ratio
Long term liabilities / 1,672 1,818 338 562
Capital employed 6,789 7,244 3,925 4,350
Answer: % 0.246 0.251 0.086 0.129
Interest Coverage Ratio
EBIT / 416 430 479.00 452.00
Net Finance Costs (used net interest
expense) 222 243 96 169
Answer: times p.a
1.87
4
1.77
0
4.99
0
2.67
5
(Morningstar, 2018)
Gearing ratio:
Gearing ratios explains about the equity position and debt position of an organization. It
measures the total long term liabilities of the company and the capital of the company which
has been raised by the company to manage the activities and long term investment of the
company (Brooks, 2015). It explains about the financial leverage position of an organization.
The gearing ratio of BENDIGO AND ADELAIDE BANK LTD is 0.25 in 2016 and 0.25 in
2017 whereas the gearing ratio of BANK OF QUEENSLAND LTD is 0.086 and 0.12 in 2016
and 2017 respectively.
It explains that the gearing position of BENDIGO AND ADELAIDE BANK LTD is
higher and it express that the company is managing the total equity and total long term
liabilities in a better way. The risk position of BENDIGO AND ADELAIDE BANK LTD is
lower than the BANK OF QUEENSLAND LTD.
Interest coverage ratio:
8
Long term solvency position is a study to analyze the capability of an organization to
meet the Long term debt financial obligations of the company. It evaluates the debt and the
total equity of the company and measure the cash flow of the company on the basis of the
debt and equity of the company (Brown, 2012). Basically, Long term solvency position ratios
seek to evaluate the ability of the company to avoid the Long term financial distraction of the
company. Long term solvency position of both the companies is as follows:
Long term solvency position 2016 2017 2016 2017
Gearing ratio
Long term liabilities / 1,672 1,818 338 562
Capital employed 6,789 7,244 3,925 4,350
Answer: % 0.246 0.251 0.086 0.129
Interest Coverage Ratio
EBIT / 416 430 479.00 452.00
Net Finance Costs (used net interest
expense) 222 243 96 169
Answer: times p.a
1.87
4
1.77
0
4.99
0
2.67
5
(Morningstar, 2018)
Gearing ratio:
Gearing ratios explains about the equity position and debt position of an organization. It
measures the total long term liabilities of the company and the capital of the company which
has been raised by the company to manage the activities and long term investment of the
company (Brooks, 2015). It explains about the financial leverage position of an organization.
The gearing ratio of BENDIGO AND ADELAIDE BANK LTD is 0.25 in 2016 and 0.25 in
2017 whereas the gearing ratio of BANK OF QUEENSLAND LTD is 0.086 and 0.12 in 2016
and 2017 respectively.
It explains that the gearing position of BENDIGO AND ADELAIDE BANK LTD is
higher and it express that the company is managing the total equity and total long term
liabilities in a better way. The risk position of BENDIGO AND ADELAIDE BANK LTD is
lower than the BANK OF QUEENSLAND LTD.
Interest coverage ratio:
Business Finance
9
Interest coverage ratio is used to determine the interest expenses and the debt of an
organization. It explains about the interest expenses and EBIT of an organization. It measures
the total interest amount which would be paid by the company from the operating profits. It
explains about the financial leverage position of an organization. The interest coverage ratio
of BENDIGO AND ADELAIDE BANK LTD is 1.87 in 2016 and 1.77 in 2017 whereas the
gearing ratio of BANK OF QUEENSLAND LTD is 4.9 and 2.67 in 2016 and 2017
respectively (Yahoo finance, 2018).
It explains that the gearing position of BANK OF QUEENSLAND LTD is quite higher
and it express that the company has managed the long term solvency position in a better way.
The company is enough capable to pay all the interest expenses to the debt holders of the
company.
On the basis of long term solvency ratios of the both the companies, it has been
evaluated that the financial position and the long term debt management policies of BANK
OF QUEENSLAND LTD is way better and thus the investment into the company BANK OF
QUEENSLAND LTD is better as the risk of company is lower in terms of paying the
expenses to the related parties.
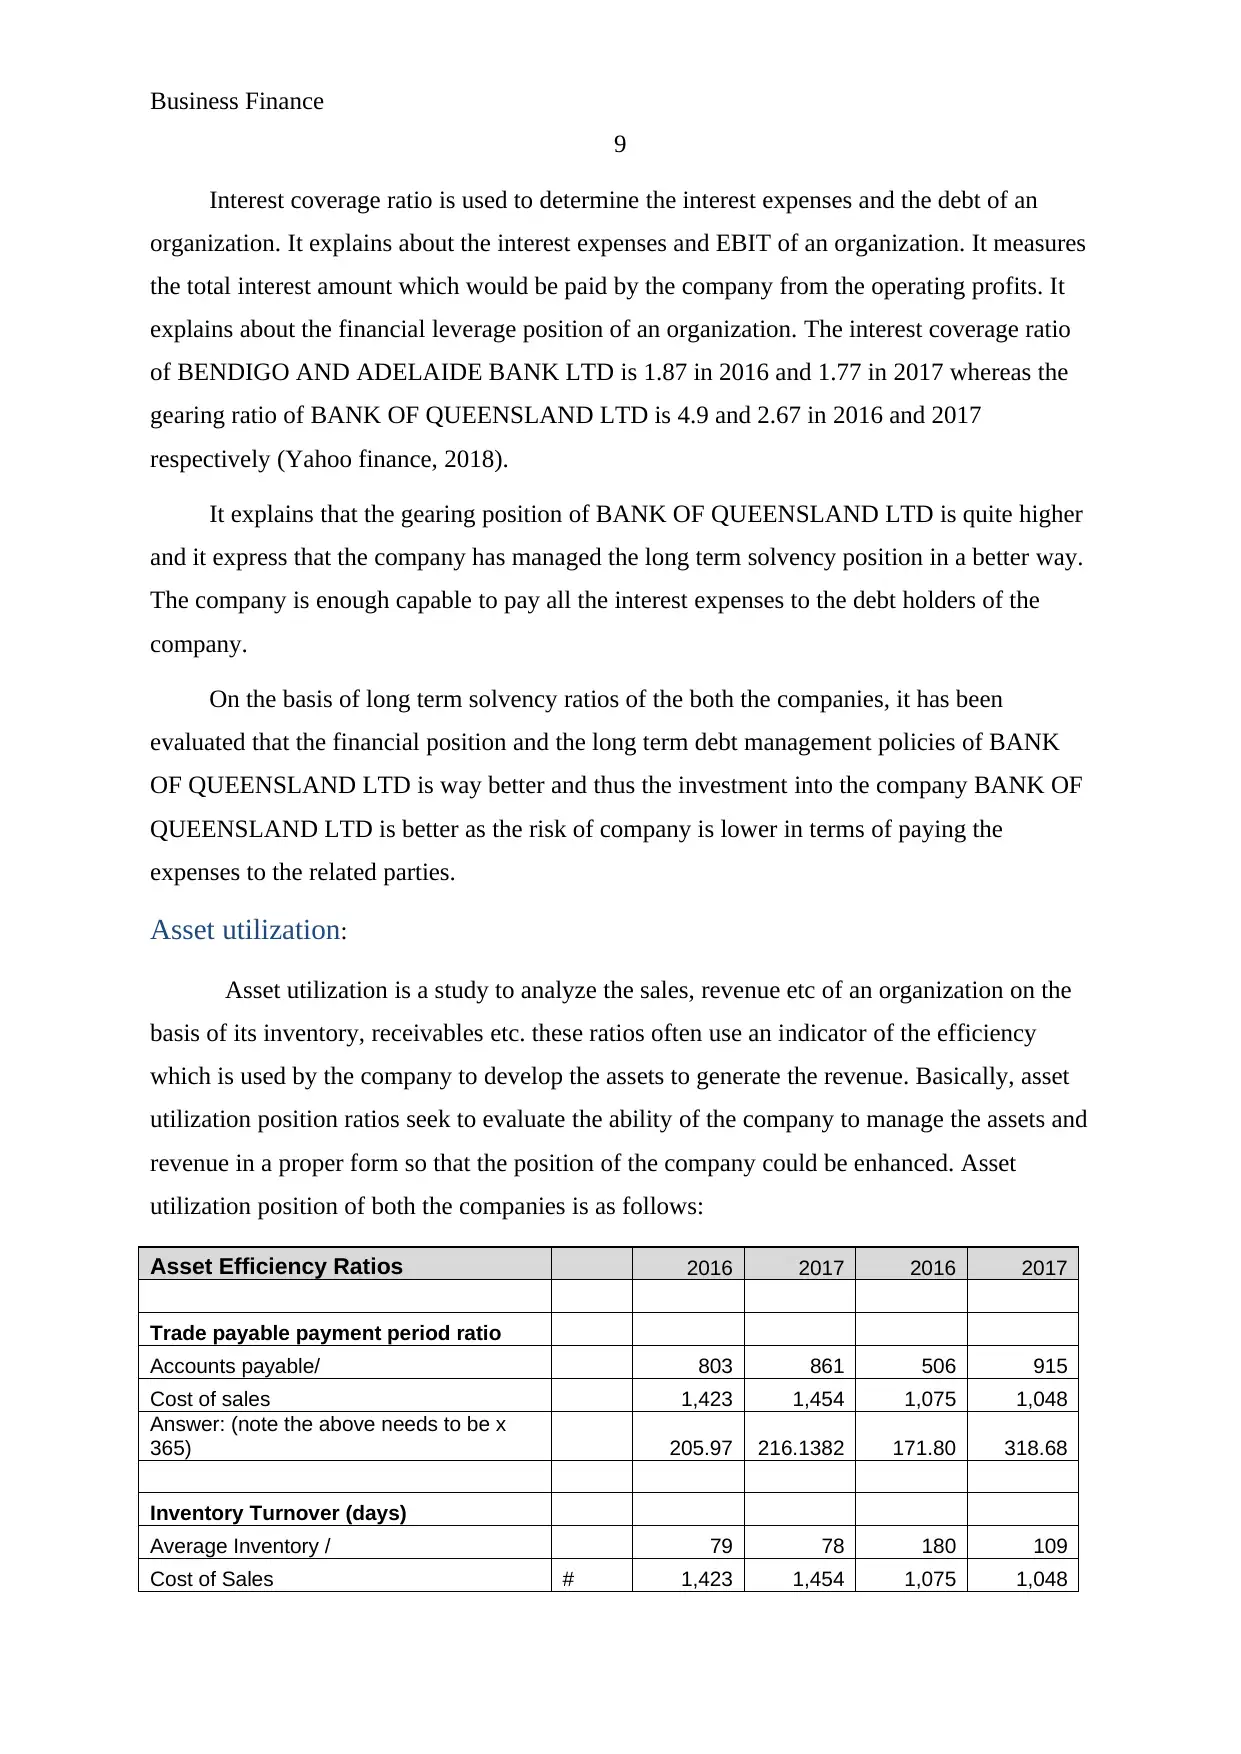
Asset utilization:
Asset utilization is a study to analyze the sales, revenue etc of an organization on the
basis of its inventory, receivables etc. these ratios often use an indicator of the efficiency
which is used by the company to develop the assets to generate the revenue. Basically, asset
utilization position ratios seek to evaluate the ability of the company to manage the assets and
revenue in a proper form so that the position of the company could be enhanced. Asset
utilization position of both the companies is as follows:
Asset Efficiency Ratios 2016 2017 2016 2017
Trade payable payment period ratio
Accounts payable/ 803 861 506 915
Cost of sales 1,423 1,454 1,075 1,048
Answer: (note the above needs to be x
365) 205.97 216.1382 171.80 318.68
Inventory Turnover (days)
Average Inventory / 79 78 180 109
Cost of Sales # 1,423 1,454 1,075 1,048
9
Interest coverage ratio is used to determine the interest expenses and the debt of an
organization. It explains about the interest expenses and EBIT of an organization. It measures
the total interest amount which would be paid by the company from the operating profits. It
explains about the financial leverage position of an organization. The interest coverage ratio
of BENDIGO AND ADELAIDE BANK LTD is 1.87 in 2016 and 1.77 in 2017 whereas the
gearing ratio of BANK OF QUEENSLAND LTD is 4.9 and 2.67 in 2016 and 2017
respectively (Yahoo finance, 2018).
It explains that the gearing position of BANK OF QUEENSLAND LTD is quite higher
and it express that the company has managed the long term solvency position in a better way.
The company is enough capable to pay all the interest expenses to the debt holders of the
company.
On the basis of long term solvency ratios of the both the companies, it has been
evaluated that the financial position and the long term debt management policies of BANK
OF QUEENSLAND LTD is way better and thus the investment into the company BANK OF
QUEENSLAND LTD is better as the risk of company is lower in terms of paying the
expenses to the related parties.
Asset utilization:
Asset utilization is a study to analyze the sales, revenue etc of an organization on the
basis of its inventory, receivables etc. these ratios often use an indicator of the efficiency
which is used by the company to develop the assets to generate the revenue. Basically, asset
utilization position ratios seek to evaluate the ability of the company to manage the assets and
revenue in a proper form so that the position of the company could be enhanced. Asset
utilization position of both the companies is as follows:
Asset Efficiency Ratios 2016 2017 2016 2017
Trade payable payment period ratio
Accounts payable/ 803 861 506 915
Cost of sales 1,423 1,454 1,075 1,048
Answer: (note the above needs to be x
365) 205.97 216.1382 171.80 318.68
Inventory Turnover (days)
Average Inventory / 79 78 180 109
Cost of Sales # 1,423 1,454 1,075 1,048
⊘ This is a preview!⊘
Do you want full access?
Subscribe today to unlock all pages.
Trusted by 1+ million students worldwide
Business Finance
10
days
Answer: (note the above needs to be x 365) 20.26 19.58 61.12 37.96
Receivables Turnover (days)
Average trade debtors /
1,31
0
1,33
2
18
0
10
9
Sales revenue (note used operating revenue)
#
days
1,42
3
1,45
4
1,07
5
1,04
8
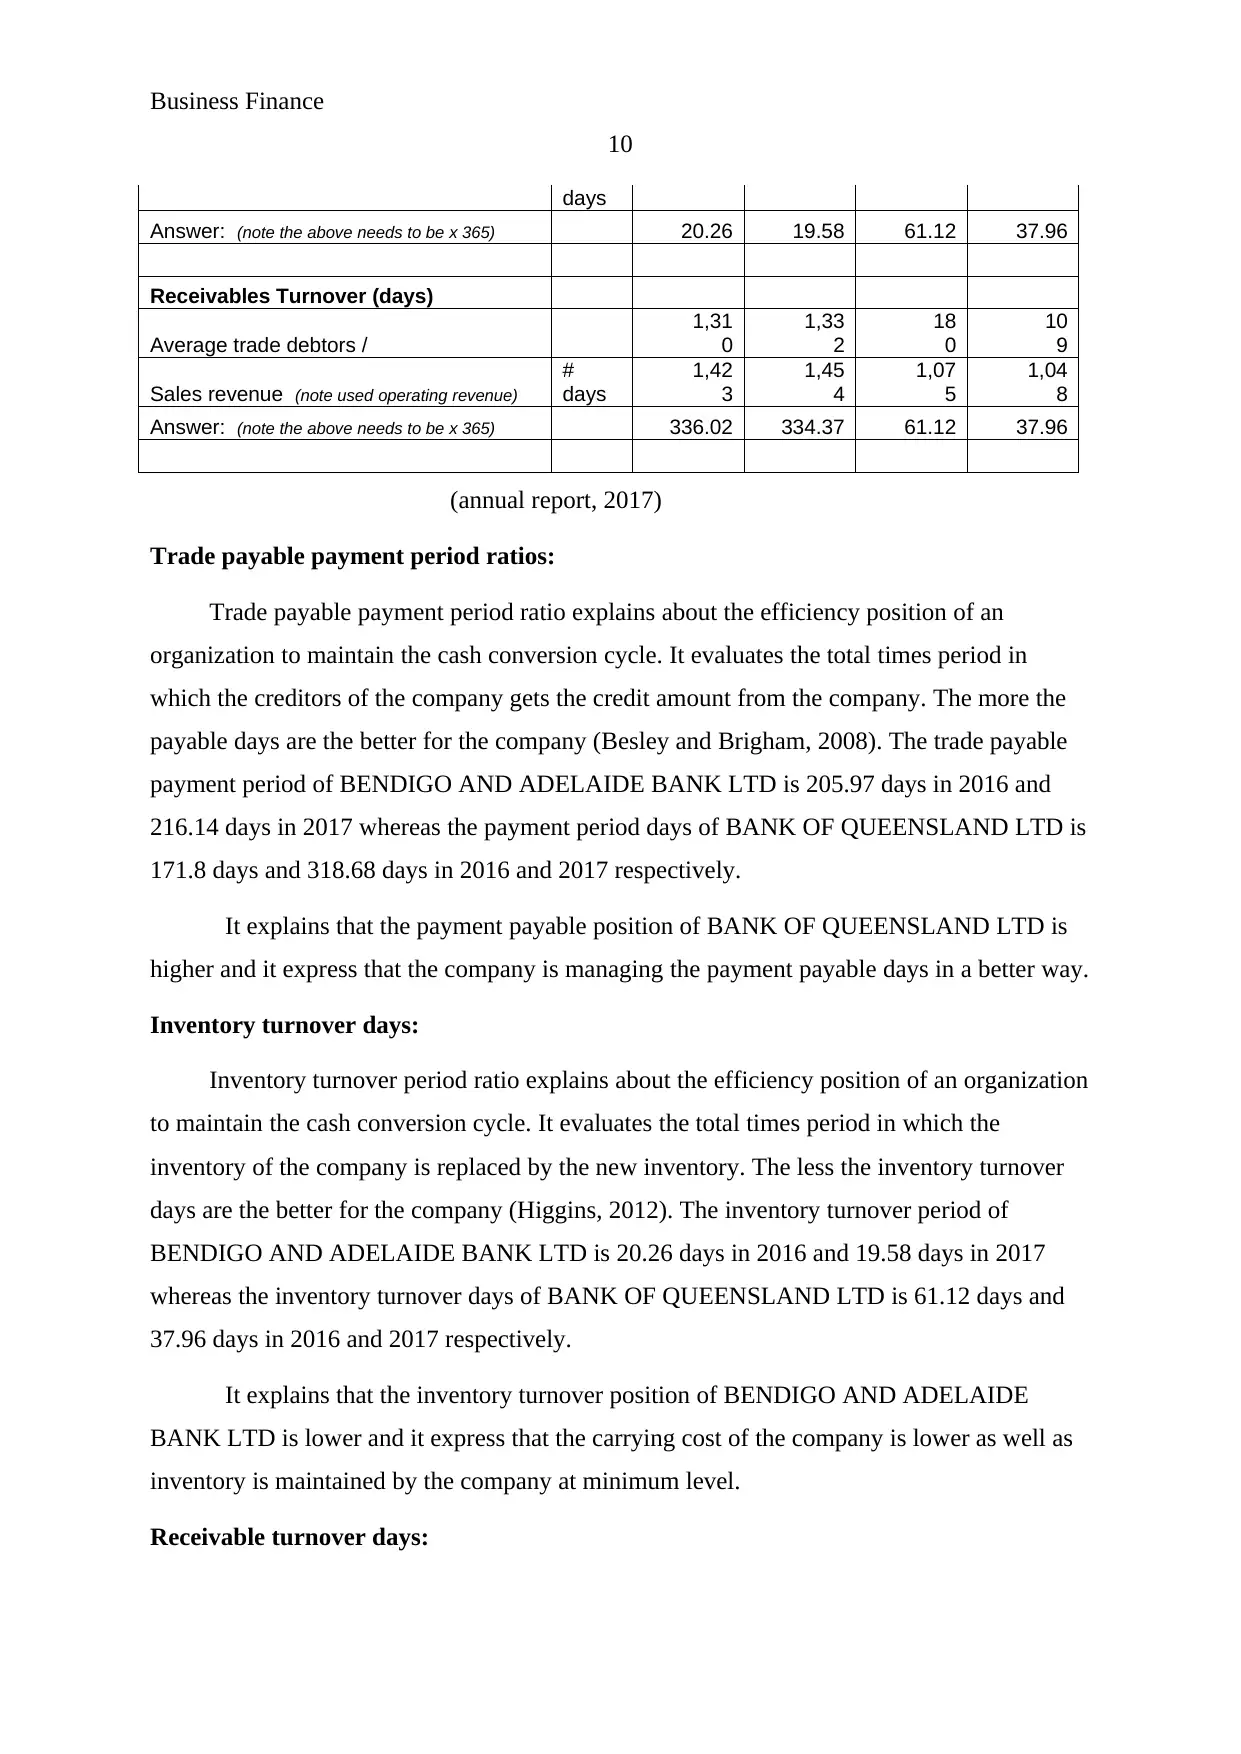
Answer: (note the above needs to be x 365) 336.02 334.37 61.12 37.96
(annual report, 2017)
Trade payable payment period ratios:
Trade payable payment period ratio explains about the efficiency position of an
organization to maintain the cash conversion cycle. It evaluates the total times period in
which the creditors of the company gets the credit amount from the company. The more the
payable days are the better for the company (Besley and Brigham, 2008). The trade payable
payment period of BENDIGO AND ADELAIDE BANK LTD is 205.97 days in 2016 and
216.14 days in 2017 whereas the payment period days of BANK OF QUEENSLAND LTD is
171.8 days and 318.68 days in 2016 and 2017 respectively.
It explains that the payment payable position of BANK OF QUEENSLAND LTD is
higher and it express that the company is managing the payment payable days in a better way.
Inventory turnover days:
Inventory turnover period ratio explains about the efficiency position of an organization
to maintain the cash conversion cycle. It evaluates the total times period in which the
inventory of the company is replaced by the new inventory. The less the inventory turnover
days are the better for the company (Higgins, 2012). The inventory turnover period of
BENDIGO AND ADELAIDE BANK LTD is 20.26 days in 2016 and 19.58 days in 2017
whereas the inventory turnover days of BANK OF QUEENSLAND LTD is 61.12 days and
37.96 days in 2016 and 2017 respectively.
It explains that the inventory turnover position of BENDIGO AND ADELAIDE
BANK LTD is lower and it express that the carrying cost of the company is lower as well as
inventory is maintained by the company at minimum level.
Receivable turnover days:
10
days
Answer: (note the above needs to be x 365) 20.26 19.58 61.12 37.96
Receivables Turnover (days)
Average trade debtors /
1,31
0
1,33
2
18
0
10
9
Sales revenue (note used operating revenue)
#
days
1,42
3
1,45
4
1,07
5
1,04
8
Answer: (note the above needs to be x 365) 336.02 334.37 61.12 37.96
(annual report, 2017)
Trade payable payment period ratios:
Trade payable payment period ratio explains about the efficiency position of an
organization to maintain the cash conversion cycle. It evaluates the total times period in
which the creditors of the company gets the credit amount from the company. The more the
payable days are the better for the company (Besley and Brigham, 2008). The trade payable
payment period of BENDIGO AND ADELAIDE BANK LTD is 205.97 days in 2016 and
216.14 days in 2017 whereas the payment period days of BANK OF QUEENSLAND LTD is
171.8 days and 318.68 days in 2016 and 2017 respectively.
It explains that the payment payable position of BANK OF QUEENSLAND LTD is
higher and it express that the company is managing the payment payable days in a better way.
Inventory turnover days:
Inventory turnover period ratio explains about the efficiency position of an organization
to maintain the cash conversion cycle. It evaluates the total times period in which the
inventory of the company is replaced by the new inventory. The less the inventory turnover
days are the better for the company (Higgins, 2012). The inventory turnover period of
BENDIGO AND ADELAIDE BANK LTD is 20.26 days in 2016 and 19.58 days in 2017
whereas the inventory turnover days of BANK OF QUEENSLAND LTD is 61.12 days and
37.96 days in 2016 and 2017 respectively.
It explains that the inventory turnover position of BENDIGO AND ADELAIDE
BANK LTD is lower and it express that the carrying cost of the company is lower as well as
inventory is maintained by the company at minimum level.
Receivable turnover days:
Paraphrase This Document
Need a fresh take? Get an instant paraphrase of this document with our AI Paraphraser
Business Finance
11
Receivable turnover period ratio explains about the efficiency position of an
organization to maintain the cash conversion cycle. It evaluates the total times period in
which the debtors of the company would pay the debt amount to the company. The less the
receivable collection days are the better for the company (Bromwich and Bhimani, 2005).
The receivable turnover period ratio of BENDIGO AND ADELAIDE BANK LTD is 336.02
days in 2016 and 334.37 days in 2017 whereas the inventory turnover days of BANK OF
QUEENSLAND LTD is 61.12 days and 37.96 days in 2016 and 2017 respectively.
It explains that the receivable turnover position of BANK OF QUEENSLAND LTD
is lower and it express that the amount would be received by the company quickly. It would
assist the company to maintain the lower working capital for the daily activities of the
company.
On the basis of asset efficiency ratios of the both the companies, it has been evaluated
that the financial position and the working capital management policies of BANK OF
QUEENSLAND LTD is way better and thus the investment into the company BANK OF
QUEENSLAND LTD is better.
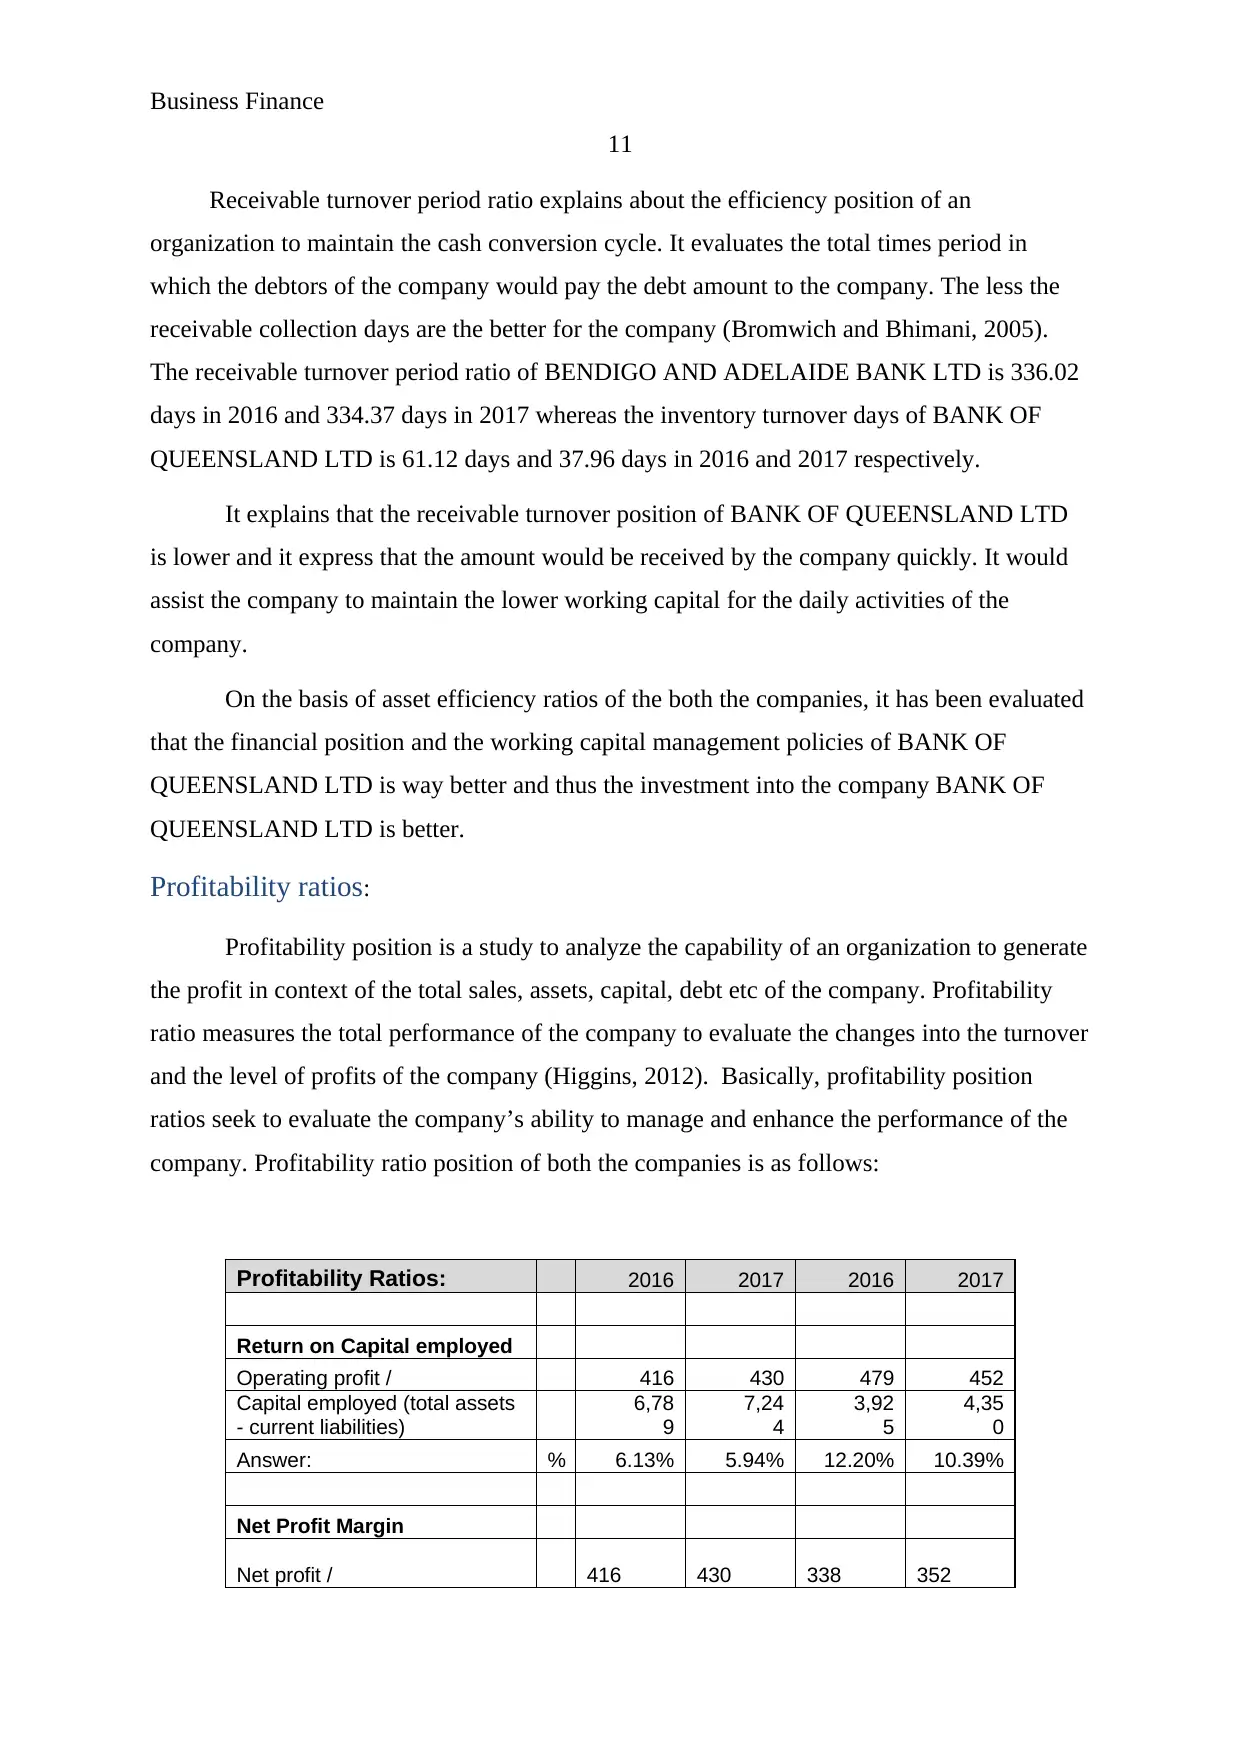
Profitability ratios:
Profitability position is a study to analyze the capability of an organization to generate
the profit in context of the total sales, assets, capital, debt etc of the company. Profitability
ratio measures the total performance of the company to evaluate the changes into the turnover
and the level of profits of the company (Higgins, 2012). Basically, profitability position
ratios seek to evaluate the company’s ability to manage and enhance the performance of the
company. Profitability ratio position of both the companies is as follows:
Profitability Ratios: 2016 2017 2016 2017
Return on Capital employed
Operating profit / 416 430 479 452
Capital employed (total assets
- current liabilities)
6,78
9
7,24
4
3,92
5
4,35
0
Answer: % 6.13% 5.94% 12.20% 10.39%
Net Profit Margin
Net profit / 416 430 338 352
11
Receivable turnover period ratio explains about the efficiency position of an
organization to maintain the cash conversion cycle. It evaluates the total times period in
which the debtors of the company would pay the debt amount to the company. The less the
receivable collection days are the better for the company (Bromwich and Bhimani, 2005).
The receivable turnover period ratio of BENDIGO AND ADELAIDE BANK LTD is 336.02
days in 2016 and 334.37 days in 2017 whereas the inventory turnover days of BANK OF
QUEENSLAND LTD is 61.12 days and 37.96 days in 2016 and 2017 respectively.
It explains that the receivable turnover position of BANK OF QUEENSLAND LTD
is lower and it express that the amount would be received by the company quickly. It would
assist the company to maintain the lower working capital for the daily activities of the
company.
On the basis of asset efficiency ratios of the both the companies, it has been evaluated
that the financial position and the working capital management policies of BANK OF
QUEENSLAND LTD is way better and thus the investment into the company BANK OF
QUEENSLAND LTD is better.
Profitability ratios:
Profitability position is a study to analyze the capability of an organization to generate
the profit in context of the total sales, assets, capital, debt etc of the company. Profitability
ratio measures the total performance of the company to evaluate the changes into the turnover
and the level of profits of the company (Higgins, 2012). Basically, profitability position
ratios seek to evaluate the company’s ability to manage and enhance the performance of the
company. Profitability ratio position of both the companies is as follows:
Profitability Ratios: 2016 2017 2016 2017
Return on Capital employed
Operating profit / 416 430 479 452
Capital employed (total assets
- current liabilities)
6,78
9
7,24
4
3,92
5
4,35
0
Answer: % 6.13% 5.94% 12.20% 10.39%
Net Profit Margin
Net profit / 416 430 338 352
Business Finance
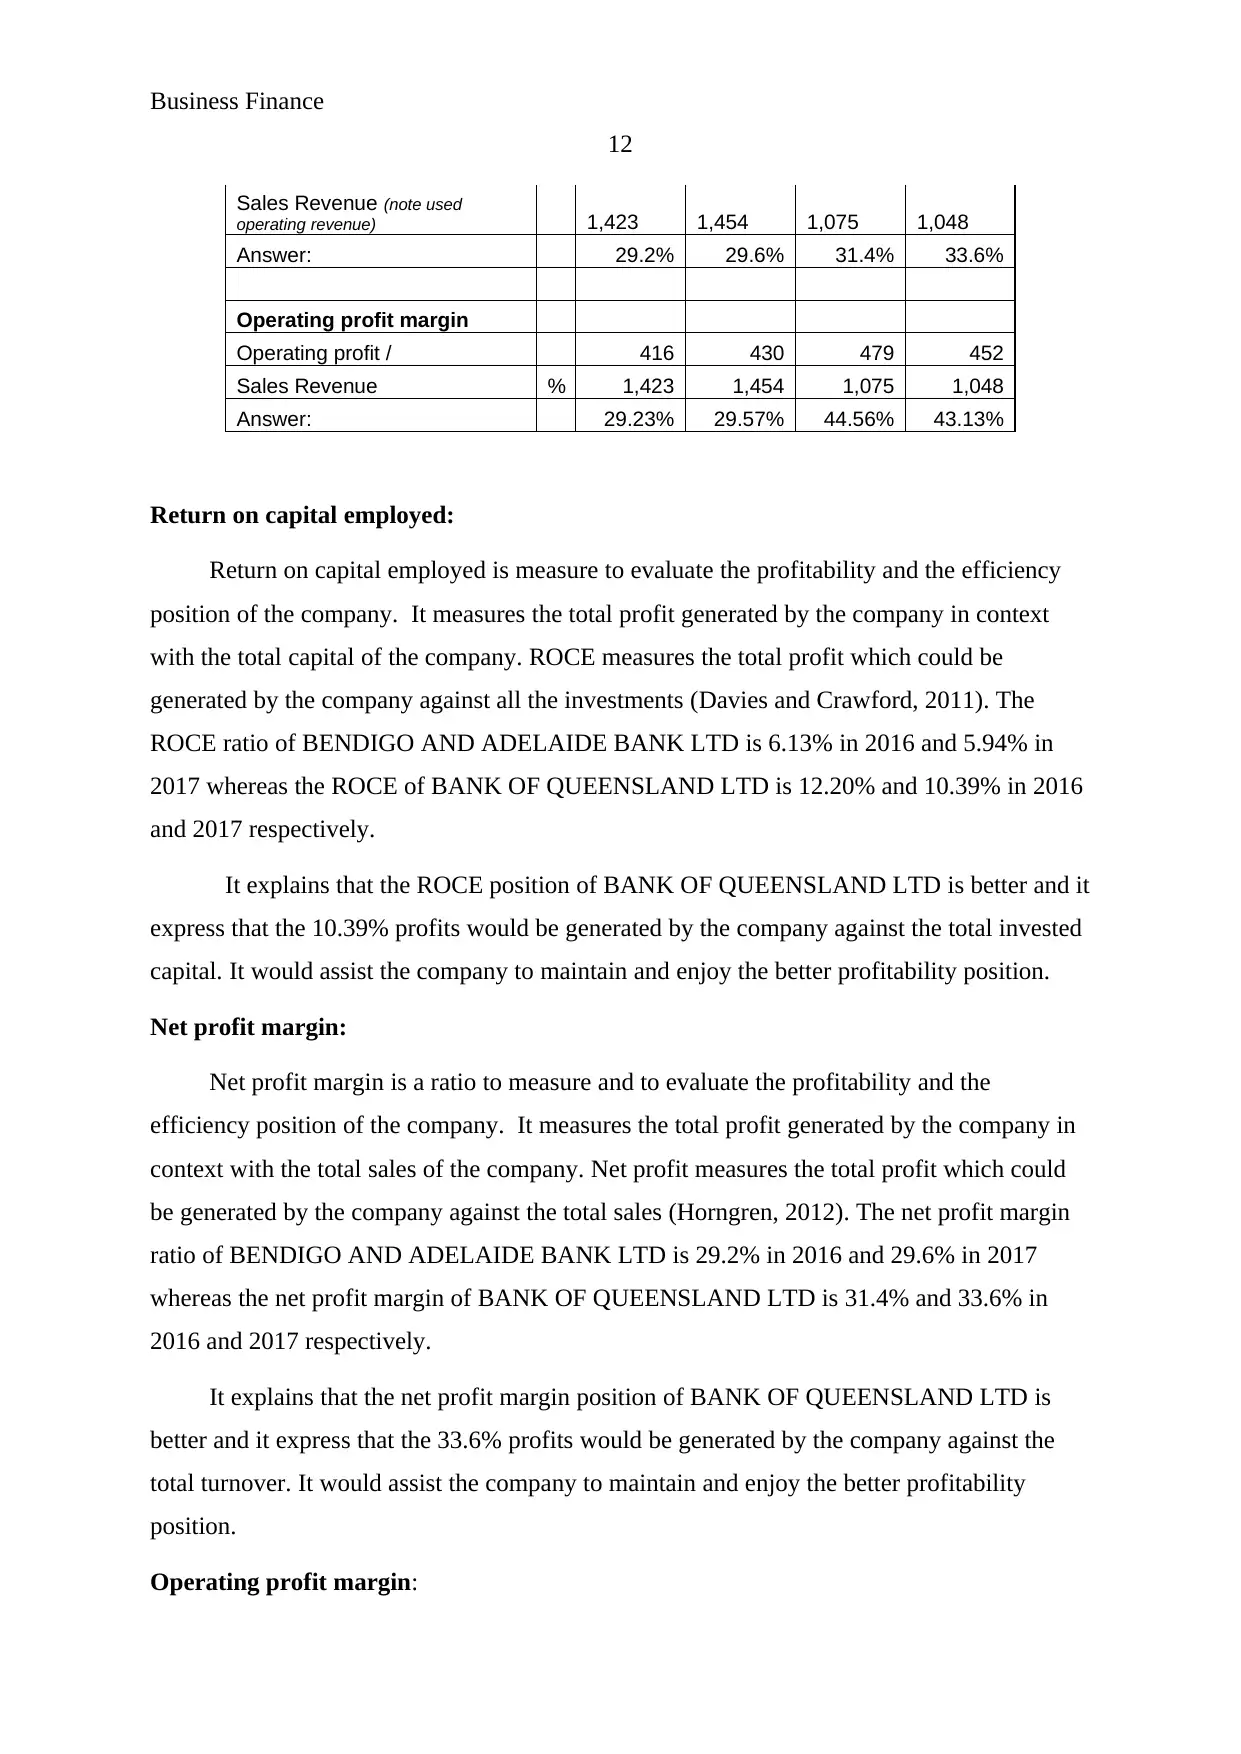
12
Sales Revenue (note used
operating revenue) 1,423 1,454 1,075 1,048
Answer: 29.2% 29.6% 31.4% 33.6%
Operating profit margin
Operating profit / 416 430 479 452
Sales Revenue % 1,423 1,454 1,075 1,048
Answer: 29.23% 29.57% 44.56% 43.13%
Return on capital employed:
Return on capital employed is measure to evaluate the profitability and the efficiency
position of the company. It measures the total profit generated by the company in context
with the total capital of the company. ROCE measures the total profit which could be
generated by the company against all the investments (Davies and Crawford, 2011). The
ROCE ratio of BENDIGO AND ADELAIDE BANK LTD is 6.13% in 2016 and 5.94% in
2017 whereas the ROCE of BANK OF QUEENSLAND LTD is 12.20% and 10.39% in 2016
and 2017 respectively.
It explains that the ROCE position of BANK OF QUEENSLAND LTD is better and it
express that the 10.39% profits would be generated by the company against the total invested
capital. It would assist the company to maintain and enjoy the better profitability position.
Net profit margin:
Net profit margin is a ratio to measure and to evaluate the profitability and the
efficiency position of the company. It measures the total profit generated by the company in
context with the total sales of the company. Net profit measures the total profit which could
be generated by the company against the total sales (Horngren, 2012). The net profit margin
ratio of BENDIGO AND ADELAIDE BANK LTD is 29.2% in 2016 and 29.6% in 2017
whereas the net profit margin of BANK OF QUEENSLAND LTD is 31.4% and 33.6% in
2016 and 2017 respectively.
It explains that the net profit margin position of BANK OF QUEENSLAND LTD is
better and it express that the 33.6% profits would be generated by the company against the
total turnover. It would assist the company to maintain and enjoy the better profitability
position.
Operating profit margin:
⊘ This is a preview!⊘
Do you want full access?
Subscribe today to unlock all pages.
Trusted by 1+ million students worldwide
1 out of 24
Related Documents


Your All-in-One AI-Powered Toolkit for Academic Success.
+13062052269
info@desklib.com
Available 24*7 on WhatsApp / Email
![[object Object]](/_next/static/media/star-bottom.7253800d.svg)
Unlock your academic potential
Copyright © 2020–2026 A2Z Services. All Rights Reserved. Developed and managed by ZUCOL.