ACC60008 - Financial Analysis & Assessment of Bapcor Limited S1 2019
VerifiedAdded on 2023/03/21
|20
|4956
|90
Report
AI Summary
This assignment provides a comprehensive financial analysis of Bapcor Limited over three years, covering the company's profile, profitability, efficiency, liquidity, solvency, and share market performance. The analysis reveals Bapcor's financial stability, high gross profit margin, and efficient management of equity and assets. Key findings include positive net margin, ROE, and ROA, indicating strong profitability. The report also highlights the company's ability to manage debt effectively and meet market expectations, leading to a recommendation for potential investors. Desklib offers similar solved assignments and past papers for students.
Financial Analysis And Assessment Of Bapcor Limited1
GROUP ASSIGNMENT: FINANCIAL ANALYSIS AND ASSESSMENT OF
BAPCOR LIMITED
Name and Student ID Number
Unit Code – ACC60008
Unit Name
Lecturers
Word Count: 3620 word
GROUP ASSIGNMENT: FINANCIAL ANALYSIS AND ASSESSMENT OF
BAPCOR LIMITED
Name and Student ID Number
Unit Code – ACC60008
Unit Name
Lecturers
Word Count: 3620 word
Paraphrase This Document
Need a fresh take? Get an instant paraphrase of this document with our AI Paraphraser
Financial Analysis And Assessment Of Bapcor Limited2
Table of Contents
Executive Summary................................................................................................................3
Bapcor Overview.....................................................................................................................4
Financial Ratio Analysis.........................................................................................................4
Profitability...........................................................................................................................5
Gross Margin.....................................................................................................................5
Net margin.........................................................................................................................6
ROA...................................................................................................................................7
ROE...................................................................................................................................7
Efficiency.............................................................................................................................8
Asset turnover....................................................................................................................8
Inventory Turnover............................................................................................................9
Receivable turnover.........................................................................................................10
Liquidity.............................................................................................................................10
Current ratio....................................................................................................................11
Quick ratio......................................................................................................................11
Solvency.............................................................................................................................12
Debt to equity ratio........................................................................................................12
Debt ratio........................................................................................................................13
Interest coverage............................................................................................................14
Share market performance................................................................................................14
Earnings per share..........................................................................................................15
P/E ratio..........................................................................................................................15
Conclusion.............................................................................................................................16
Recommendation....................................................................................................................17
REFERENCES......................................................................................................................19
Financial Analysis And Assessment Of Bapcor Limited3
Executive Summary
The assignment encompassed thorough financial analysis of Bapcor Limited over
the past three years. It entails assessment of the company profile in terms of history,
strategy, current market, current size as well as its current products. It also presents
assessment of the company’s profitability, efficiency, liquidity, solvency, as well as
share market performance over the past three years. Basically, based on the analysis,
it was found out that Bapcor was financially stable over the past three years. This
was signified by its increased and relatively high gross profit margin. In essence,
was found out that Bapcor was profitable enough in the last three years starting
2016. This is based on its relatively high net margin, ROE and ROA over the years.
Additionally, it was found out that Bapcor management are efficient enough on how
they handle and utilizes the company equity and assets as well as how they collect
money from debtors on time. Further, it was found out that Bapcor is financially
stable and is able to settle its long-term as well as its short-term debts without any
difficulties once they are due. This is due to relatively the company’s low debt and
debt to equity ratios as well as it significantly high interest turnover ratio. Generally,
based on the financial analysis, it was established that Bapcor is financially stable
and is performing in consistent with the market expectations. Therefore, it is
recommendable for potential investors willing to get value for their money to invest
in the company.
⊘ This is a preview!⊘
Do you want full access?
Subscribe today to unlock all pages.
Trusted by 1+ million students worldwide
Financial Analysis And Assessment Of Bapcor Limited4
Bapcor Overview
Bapcor is usually the largest Australian provider of the automotive aftermarket
accessories, parts, automotive services and equipment as well as motor vehicle
servicing (Bapcor 2018) . The company has three main segments, that is, specialist
wholesale, trade as well as retail. Trade segment comprises of the Burson Auto Part
as well as Precision Automotive Equipment unit. This division is the chief supplier
of the automotive aftermarket fragments as well as usable to the trade yards for
vehicle servicing and repairs and the automotive yard tools like scanning apparatus
and vehicle hoists (Bapcor 2017) . Retail segment on the other hand comprises of the
commercial divisions which are retail client fixated, and encompasses Autopro, Car
Parts retail stores brand, Autobarn, Sprint Auto Parts, as well as ABS and Midas
workshop service branding. Conversely, specialist wholesale division comprises of
operations which specialize in the automotive aftermarket wholesale and
encompasses Opposite Lock and Bearing Wholesalers as well as AAD business. In
other words, is an Australian automotive firm that deals with distribution of
consumable and automotive aftermarket parts used in repair and servicing of
vehicles. The company also encompasses sales of the maintenance and accessories
products to the vehicle owners across the globe (Bapcor 2016) .
Basically, Bapcor is a publicly listed firm, deriving most of its revenues from
distribution and sale of the aftermarket accessories and parts for vehicles as well as
from vehicle servicing. It operates in Thailand, New Zealand and Australia with it
headquarter being in Preston, Victoria (Bapcor 2018) .
Financial Ratio Analysis
This entails mathematical or quantitative comparison of the items in the financial
Paraphrase This Document
Need a fresh take? Get an instant paraphrase of this document with our AI Paraphraser
Financial Analysis And Assessment Of Bapcor Limited5
statements. Such comparisons assist creditors, investors and shareholders to
understand how well the company is performance as well as areas that need some
improvements (Henry, Robinson & van Greuning 2012) . Basically, ratio analyses are
the widespread and the most common financial metrics used in evaluating an
organization’s financial standing. They allow one compare firms across sectors to
identify their weaknesses and strengths over time (Blocker, Ibendahl & Anderson
2010) . In addition, ratio analysis could be utilized to establish trend for an individual
firm’s outcomes over significant period of their financial reporting (Singh &
Schmidgall 2012) . It could highlight organization changes which would be not patent
in case one is looking at a specific ratio representing just a single point in time. It
could offer early warning of probable deterioration or improvement in
organization’s financial performance or situation (Yahya et al. 2013) . They are
usually divided into profitability, efficiency, liquidity, market performance and
solvency ratios.
Profitability
These compared amount of income with revenues with the aim of measuring
capacity of an entity to generate enough income over time from its daily
undertakings. It usually focuses on organization’s return on the investment as well
as other form of assets (Singh & Schmidgall 2012) . In other words, the ratios indicate
how well entities could accomplish significant income from their daily operations.
Actually, the ratios assess entity’s capability of earning adequate returns over time.
Gross Margin
This is the financial metric that compares organization gross income or profit with its
total sales. It shows pricing decisions as well as product costs of an entity over time
Financial Analysis And Assessment Of Bapcor Limited6
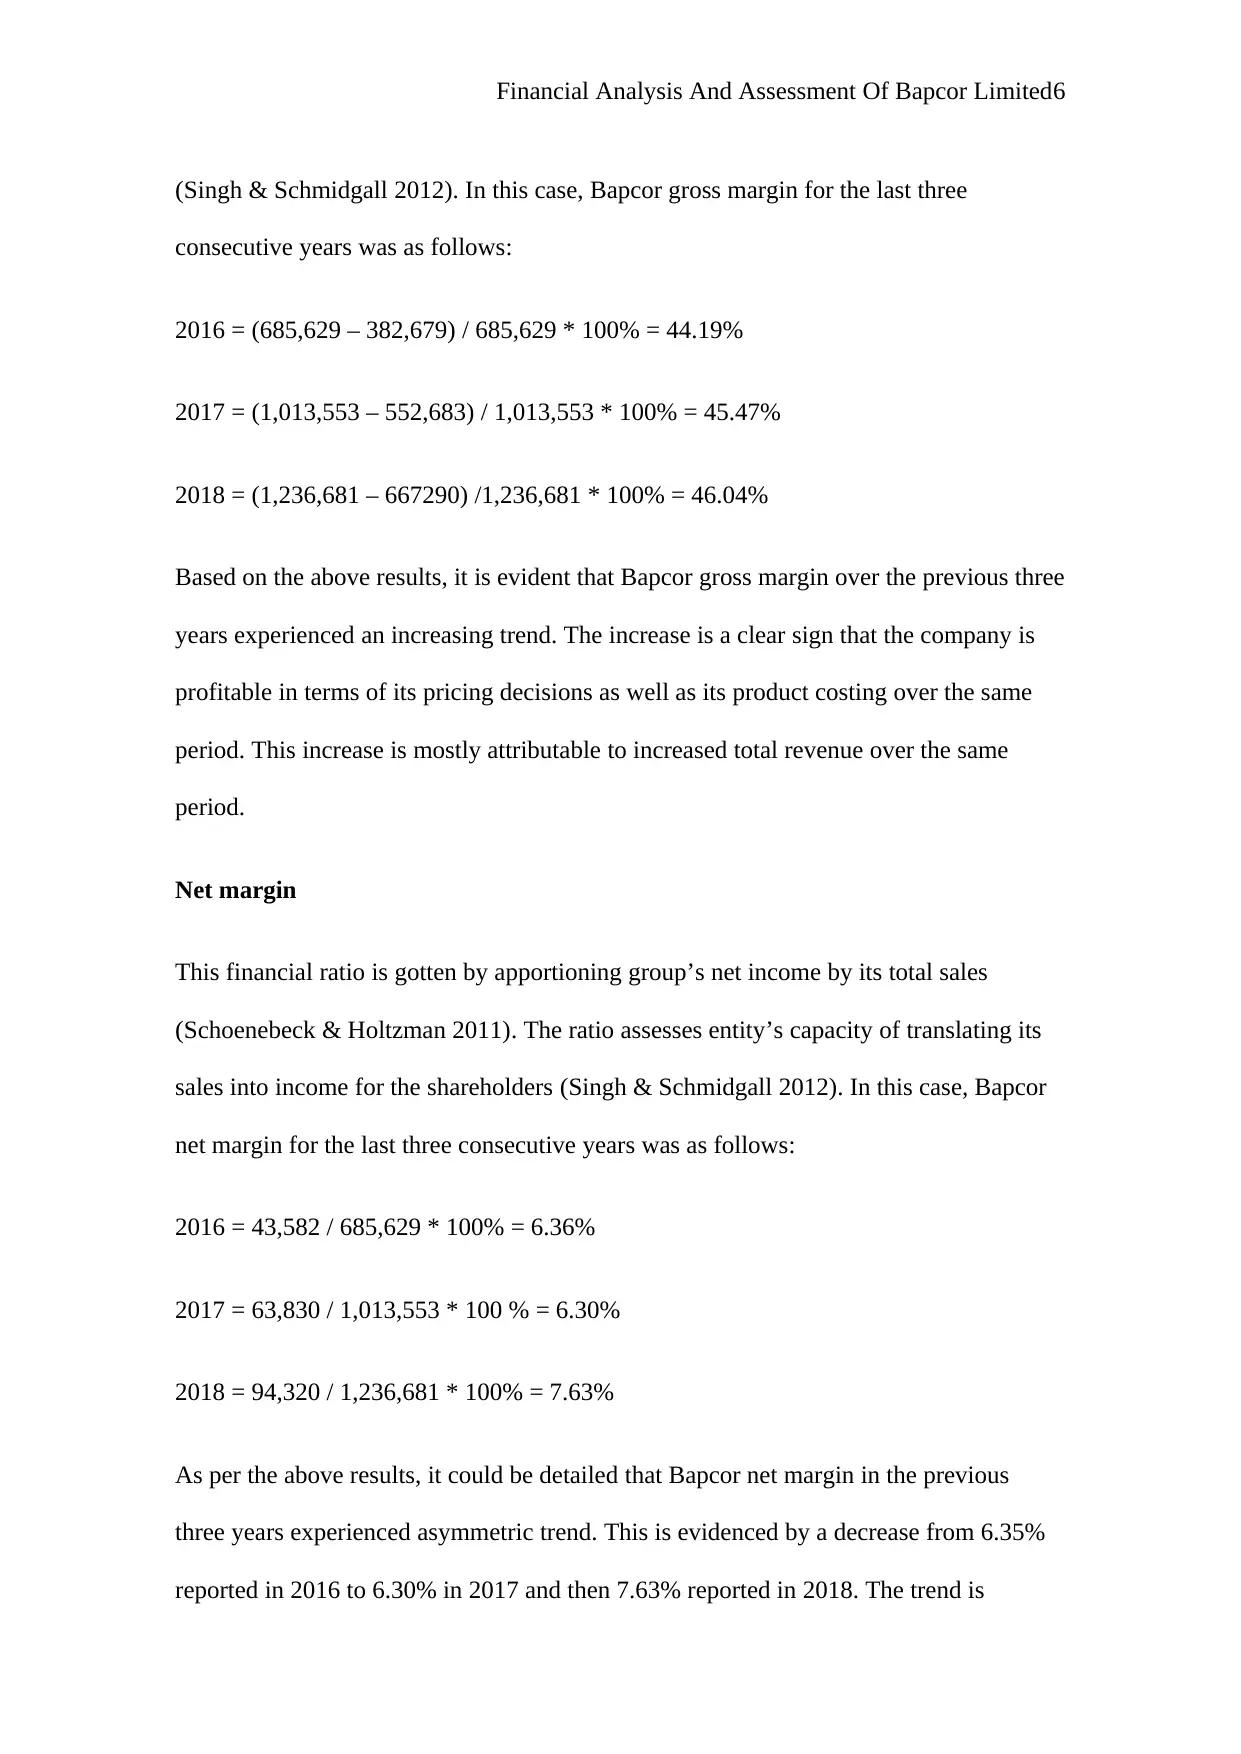
(Singh & Schmidgall 2012). In this case, Bapcor gross margin for the last three
consecutive years was as follows:
2016 = (685,629 – 382,679) / 685,629 * 100% = 44.19%
2017 = (1,013,553 – 552,683) / 1,013,553 * 100% = 45.47%
2018 = (1,236,681 – 667290) /1,236,681 * 100% = 46.04%
Based on the above results, it is evident that Bapcor gross margin over the previous three
years experienced an increasing trend. The increase is a clear sign that the company is
profitable in terms of its pricing decisions as well as its product costing over the same
period. This increase is mostly attributable to increased total revenue over the same
period.
Net margin
This financial ratio is gotten by apportioning group’s net income by its total sales
(Schoenebeck & Holtzman 2011). The ratio assesses entity’s capacity of translating its
sales into income for the shareholders (Singh & Schmidgall 2012). In this case, Bapcor
net margin for the last three consecutive years was as follows:
2016 = 43,582 / 685,629 * 100% = 6.36%
2017 = 63,830 / 1,013,553 * 100 % = 6.30%
2018 = 94,320 / 1,236,681 * 100% = 7.63%
As per the above results, it could be detailed that Bapcor net margin in the previous
three years experienced asymmetric trend. This is evidenced by a decrease from 6.35%
reported in 2016 to 6.30% in 2017 and then 7.63% reported in 2018. The trend is
⊘ This is a preview!⊘
Do you want full access?
Subscribe today to unlock all pages.
Trusted by 1+ million students worldwide
Financial Analysis And Assessment Of Bapcor Limited7
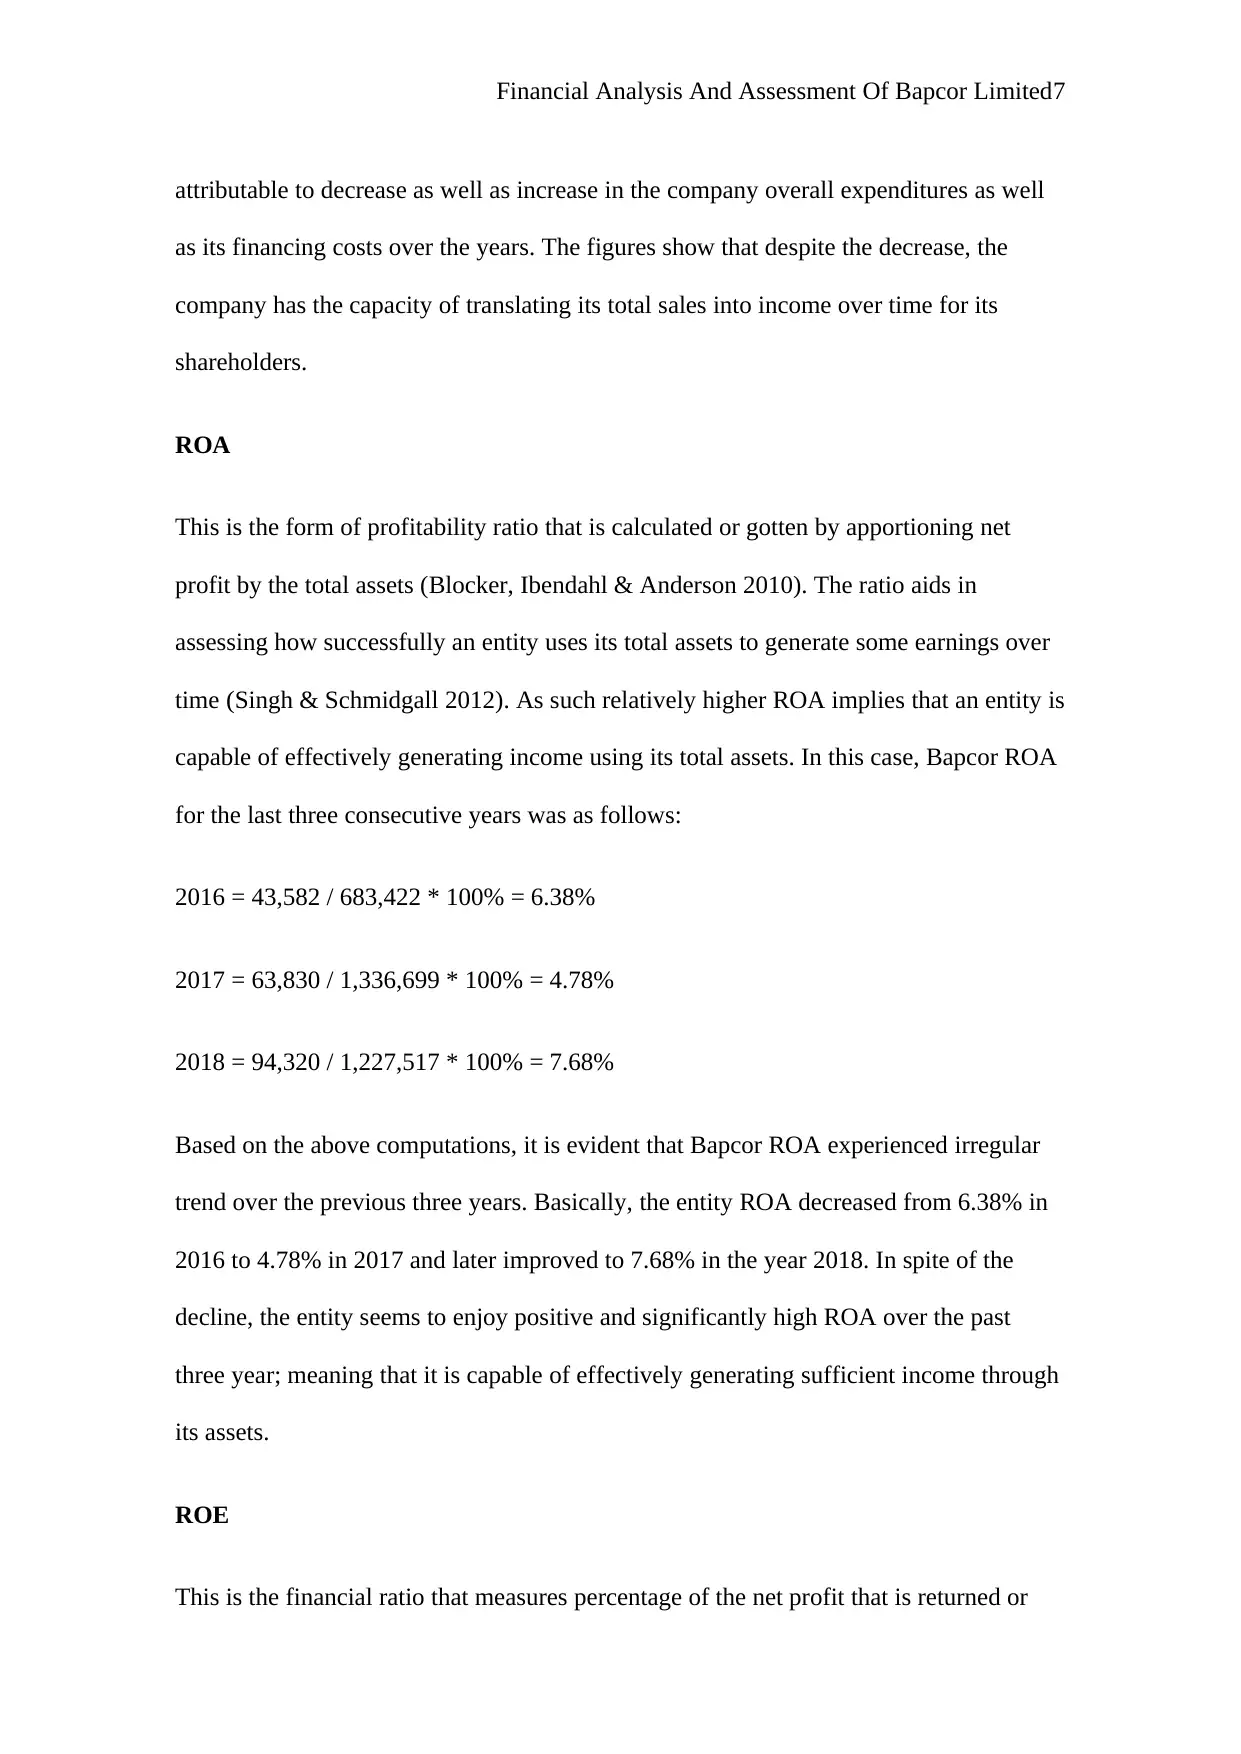
attributable to decrease as well as increase in the company overall expenditures as well
as its financing costs over the years. The figures show that despite the decrease, the
company has the capacity of translating its total sales into income over time for its
shareholders.
ROA
This is the form of profitability ratio that is calculated or gotten by apportioning net
profit by the total assets (Blocker, Ibendahl & Anderson 2010). The ratio aids in
assessing how successfully an entity uses its total assets to generate some earnings over
time (Singh & Schmidgall 2012). As such relatively higher ROA implies that an entity is
capable of effectively generating income using its total assets. In this case, Bapcor ROA
for the last three consecutive years was as follows:
2016 = 43,582 / 683,422 * 100% = 6.38%
2017 = 63,830 / 1,336,699 * 100% = 4.78%
2018 = 94,320 / 1,227,517 * 100% = 7.68%
Based on the above computations, it is evident that Bapcor ROA experienced irregular
trend over the previous three years. Basically, the entity ROA decreased from 6.38% in
2016 to 4.78% in 2017 and later improved to 7.68% in the year 2018. In spite of the
decline, the entity seems to enjoy positive and significantly high ROA over the past
three year; meaning that it is capable of effectively generating sufficient income through
its assets.
ROE
This is the financial ratio that measures percentage of the net profit that is returned or
Paraphrase This Document
Need a fresh take? Get an instant paraphrase of this document with our AI Paraphraser
Financial Analysis And Assessment Of Bapcor Limited8
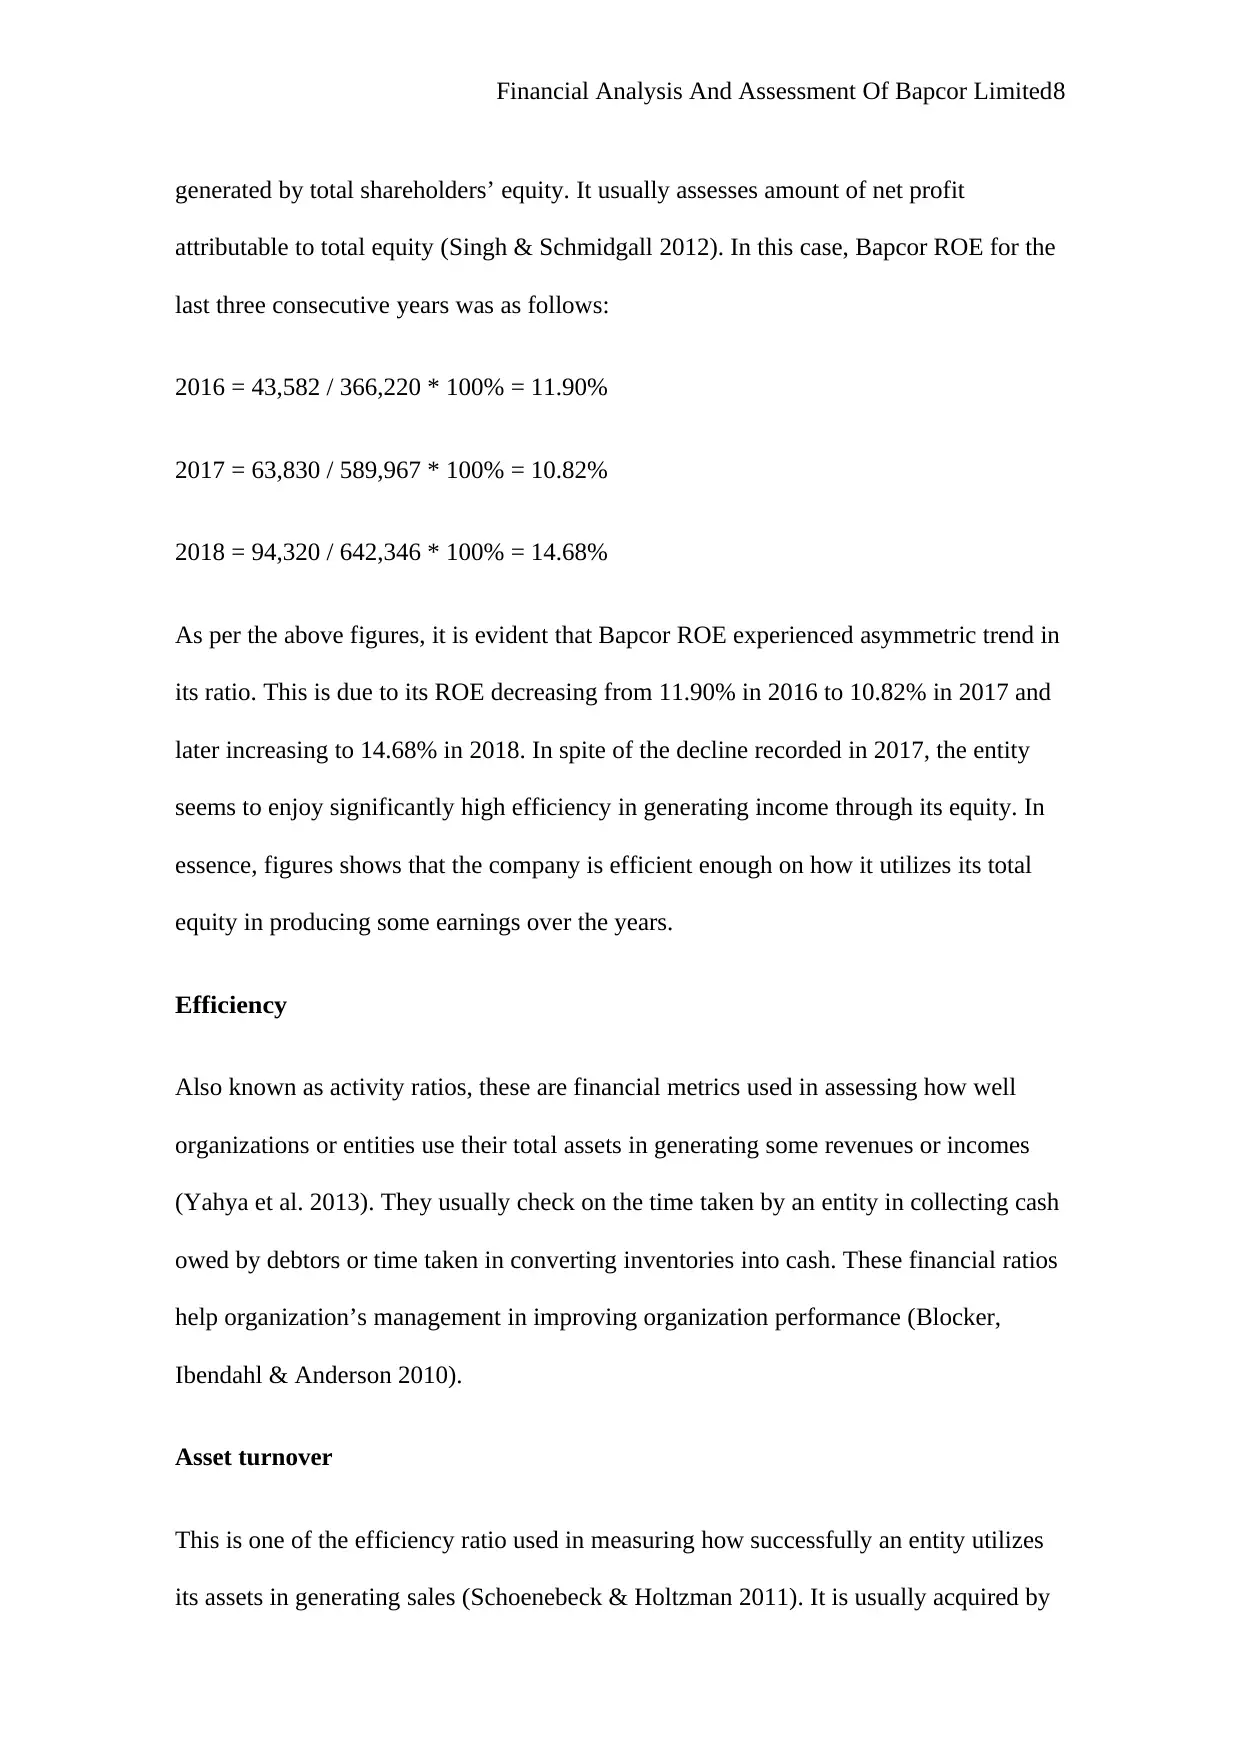
generated by total shareholders’ equity. It usually assesses amount of net profit
attributable to total equity (Singh & Schmidgall 2012). In this case, Bapcor ROE for the
last three consecutive years was as follows:
2016 = 43,582 / 366,220 * 100% = 11.90%
2017 = 63,830 / 589,967 * 100% = 10.82%
2018 = 94,320 / 642,346 * 100% = 14.68%
As per the above figures, it is evident that Bapcor ROE experienced asymmetric trend in
its ratio. This is due to its ROE decreasing from 11.90% in 2016 to 10.82% in 2017 and
later increasing to 14.68% in 2018. In spite of the decline recorded in 2017, the entity
seems to enjoy significantly high efficiency in generating income through its equity. In
essence, figures shows that the company is efficient enough on how it utilizes its total
equity in producing some earnings over the years.
Efficiency
Also known as activity ratios, these are financial metrics used in assessing how well
organizations or entities use their total assets in generating some revenues or incomes
(Yahya et al. 2013). They usually check on the time taken by an entity in collecting cash
owed by debtors or time taken in converting inventories into cash. These financial ratios
help organization’s management in improving organization performance (Blocker,
Ibendahl & Anderson 2010).
Asset turnover
This is one of the efficiency ratio used in measuring how successfully an entity utilizes
its assets in generating sales (Schoenebeck & Holtzman 2011). It is usually acquired by
Financial Analysis And Assessment Of Bapcor Limited9
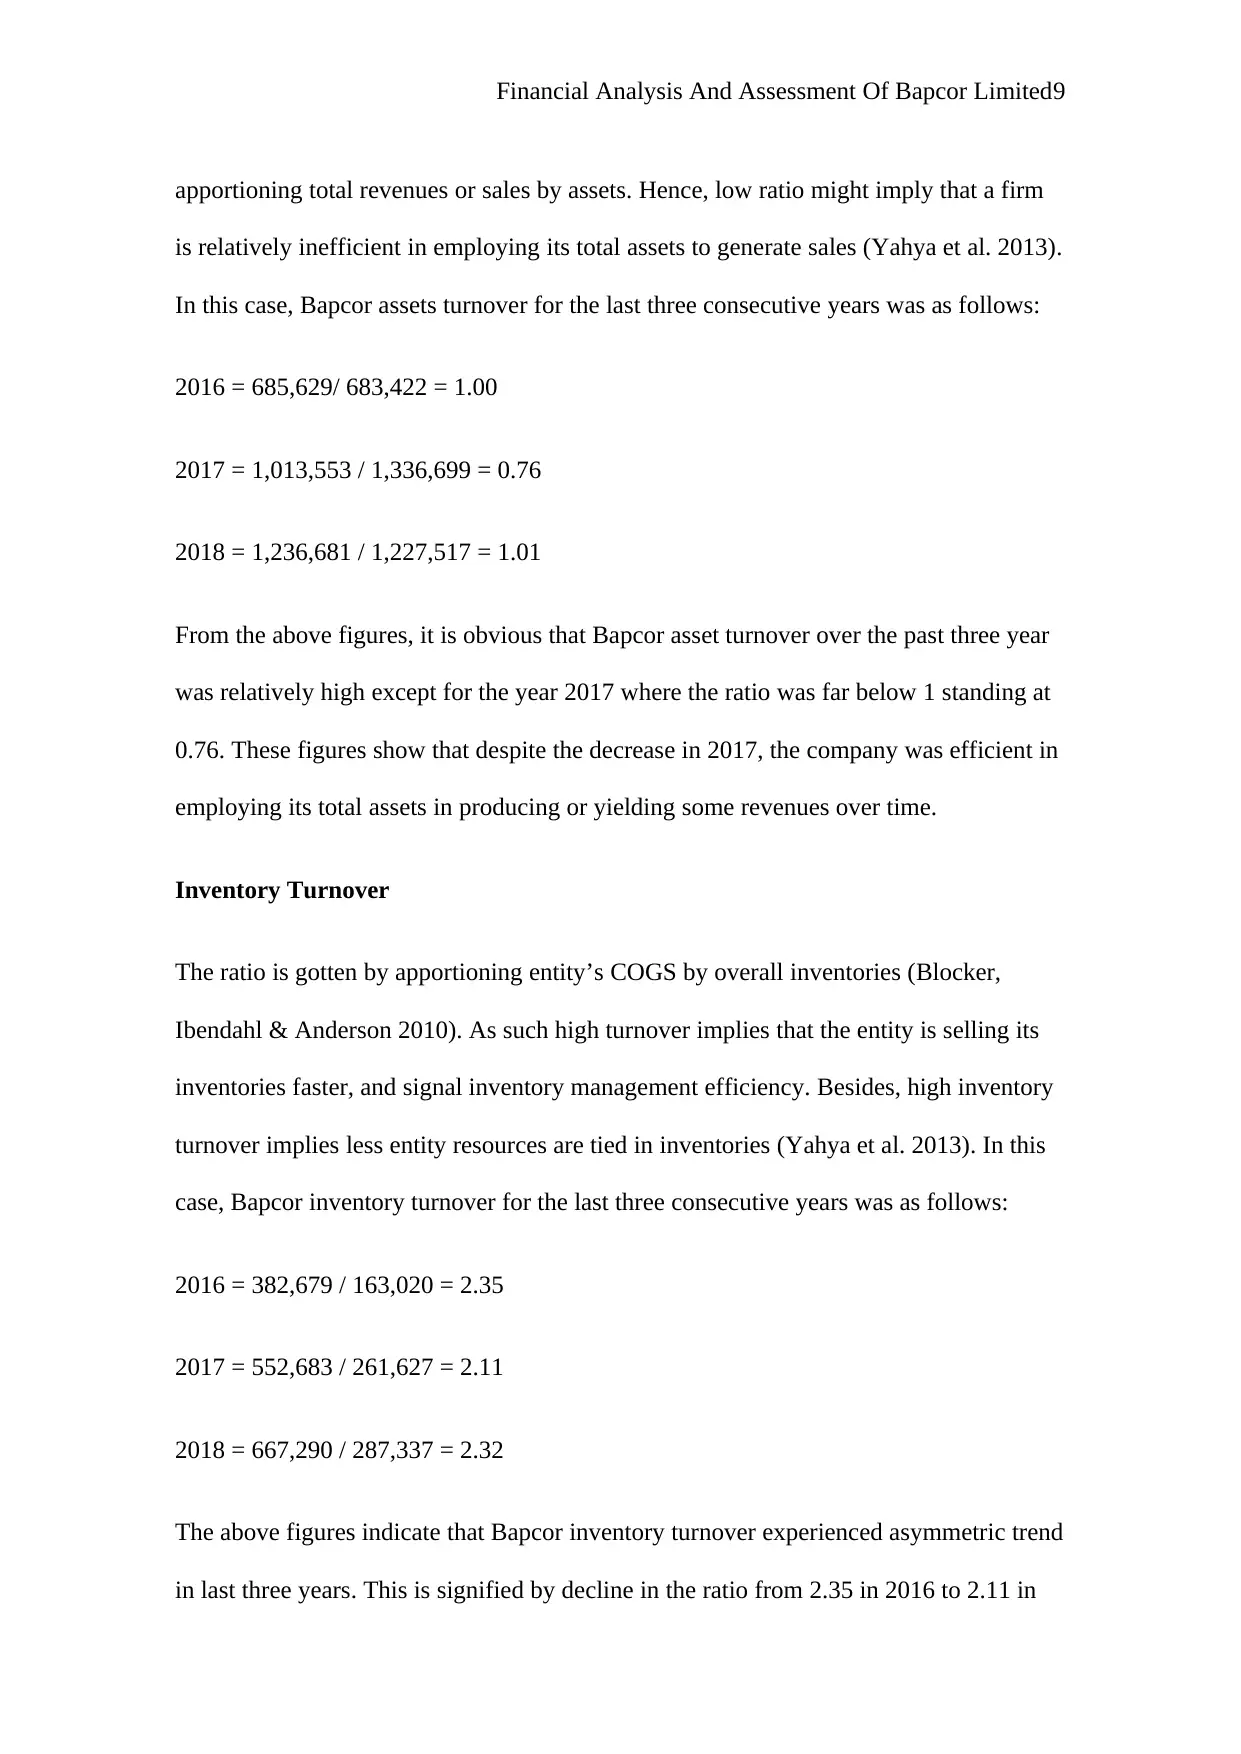
apportioning total revenues or sales by assets. Hence, low ratio might imply that a firm
is relatively inefficient in employing its total assets to generate sales (Yahya et al. 2013).
In this case, Bapcor assets turnover for the last three consecutive years was as follows:
2016 = 685,629/ 683,422 = 1.00
2017 = 1,013,553 / 1,336,699 = 0.76
2018 = 1,236,681 / 1,227,517 = 1.01
From the above figures, it is obvious that Bapcor asset turnover over the past three year
was relatively high except for the year 2017 where the ratio was far below 1 standing at
0.76. These figures show that despite the decrease in 2017, the company was efficient in
employing its total assets in producing or yielding some revenues over time.
Inventory Turnover
The ratio is gotten by apportioning entity’s COGS by overall inventories (Blocker,
Ibendahl & Anderson 2010). As such high turnover implies that the entity is selling its
inventories faster, and signal inventory management efficiency. Besides, high inventory
turnover implies less entity resources are tied in inventories (Yahya et al. 2013). In this
case, Bapcor inventory turnover for the last three consecutive years was as follows:
2016 = 382,679 / 163,020 = 2.35
2017 = 552,683 / 261,627 = 2.11
2018 = 667,290 / 287,337 = 2.32
The above figures indicate that Bapcor inventory turnover experienced asymmetric trend
in last three years. This is signified by decline in the ratio from 2.35 in 2016 to 2.11 in
⊘ This is a preview!⊘
Do you want full access?
Subscribe today to unlock all pages.
Trusted by 1+ million students worldwide
Financial Analysis And Assessment Of Bapcor Limited10
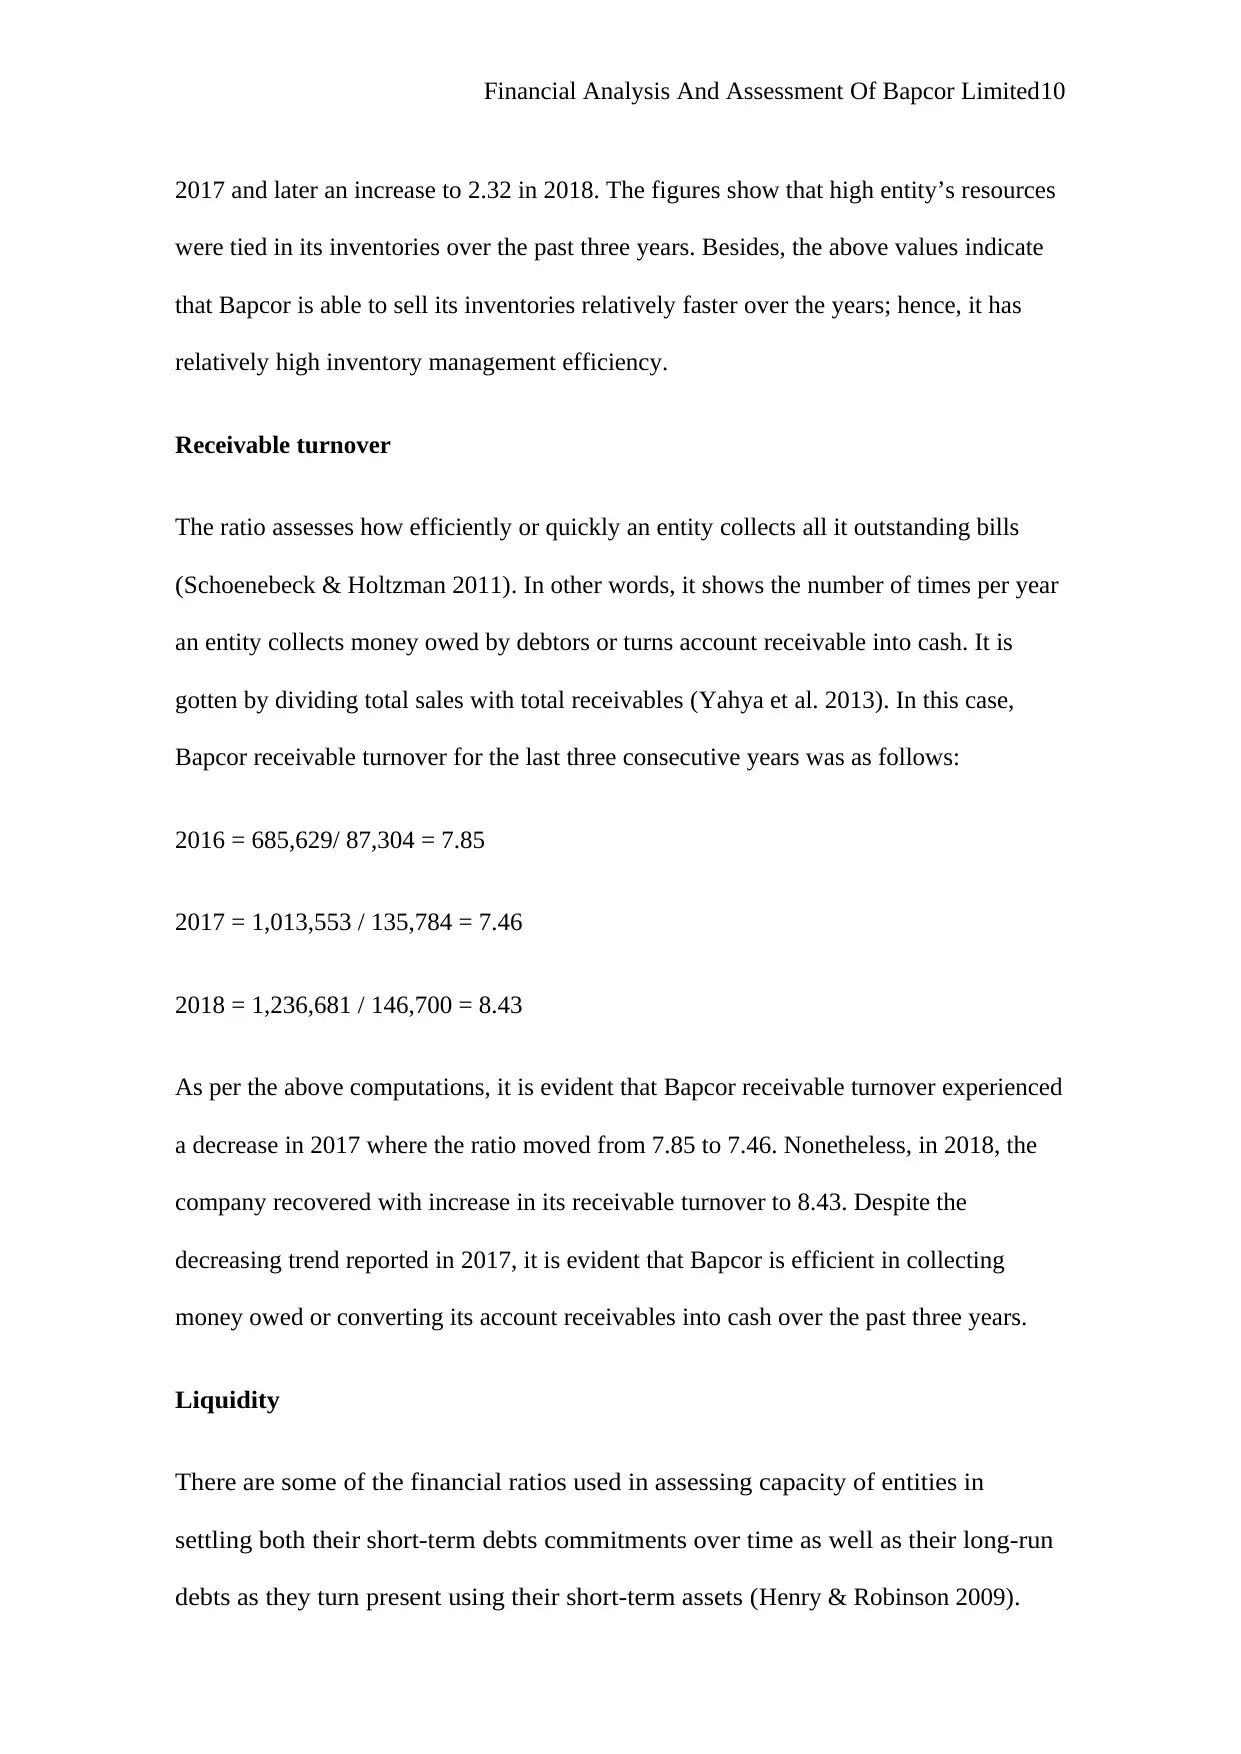
2017 and later an increase to 2.32 in 2018. The figures show that high entity’s resources
were tied in its inventories over the past three years. Besides, the above values indicate
that Bapcor is able to sell its inventories relatively faster over the years; hence, it has
relatively high inventory management efficiency.
Receivable turnover
The ratio assesses how efficiently or quickly an entity collects all it outstanding bills
(Schoenebeck & Holtzman 2011). In other words, it shows the number of times per year
an entity collects money owed by debtors or turns account receivable into cash. It is
gotten by dividing total sales with total receivables (Yahya et al. 2013). In this case,
Bapcor receivable turnover for the last three consecutive years was as follows:
2016 = 685,629/ 87,304 = 7.85
2017 = 1,013,553 / 135,784 = 7.46
2018 = 1,236,681 / 146,700 = 8.43
As per the above computations, it is evident that Bapcor receivable turnover experienced
a decrease in 2017 where the ratio moved from 7.85 to 7.46. Nonetheless, in 2018, the
company recovered with increase in its receivable turnover to 8.43. Despite the
decreasing trend reported in 2017, it is evident that Bapcor is efficient in collecting
money owed or converting its account receivables into cash over the past three years.
Liquidity
There are some of the financial ratios used in assessing capacity of entities in
settling both their short-term debts commitments over time as well as their long-run
debts as they turn present using their short-term assets (Henry & Robinson 2009) .
Paraphrase This Document
Need a fresh take? Get an instant paraphrase of this document with our AI Paraphraser
Financial Analysis And Assessment Of Bapcor Limited11
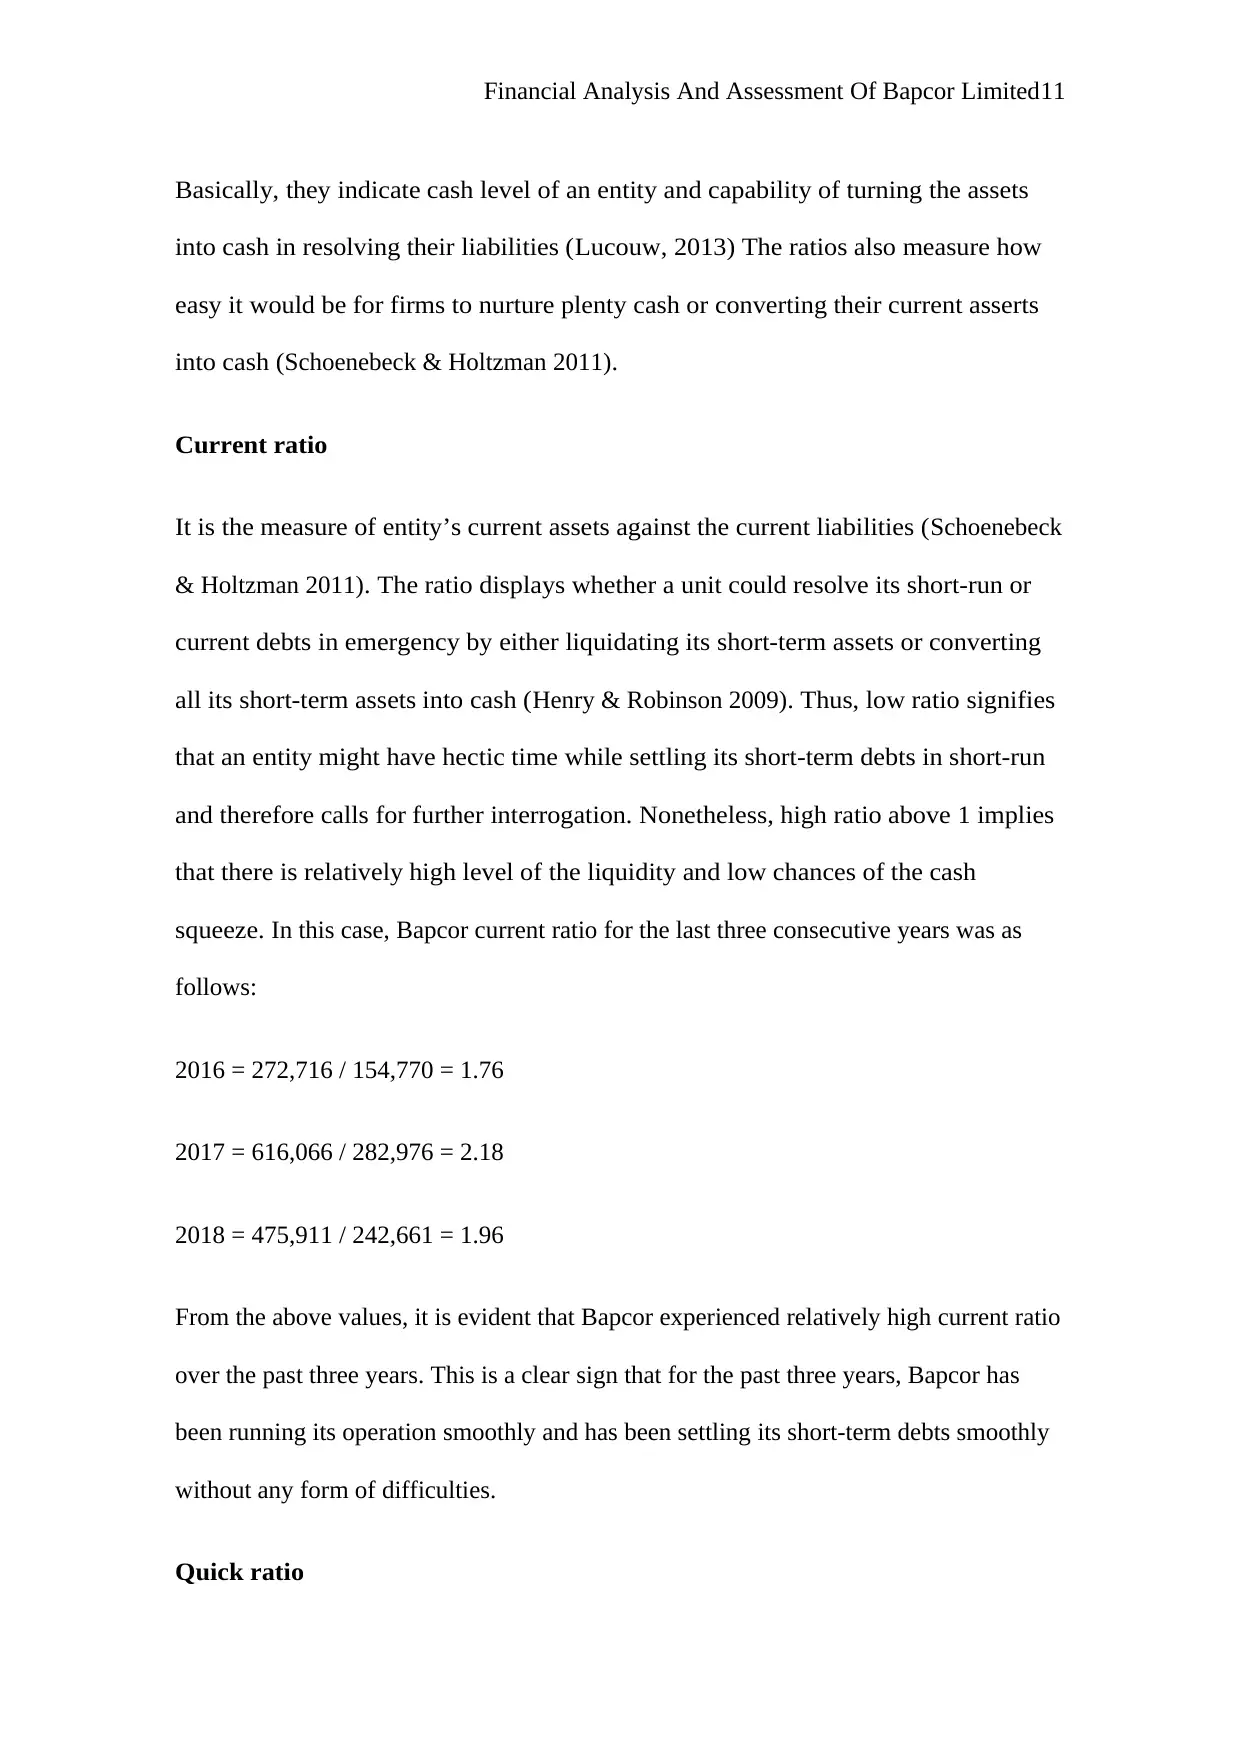
Basically, they indicate cash level of an entity and capability of turning the assets
into cash in resolving their liabilities (Lucouw, 2013) The ratios also measure how
easy it would be for firms to nurture plenty cash or converting their current asserts
into cash (Schoenebeck & Holtzman 2011) .
Current ratio
It is the measure of entity’s current assets against the current liabilities (Schoenebeck
& Holtzman 2011) . The ratio displays whether a unit could resolve its short-run or
current debts in emergency by either liquidating its short-term assets or converting
all its short-term assets into cash (Henry & Robinson 2009) . Thus, low ratio signifies
that an entity might have hectic time while settling its short-term debts in short-run
and therefore calls for further interrogation. Nonetheless, high ratio above 1 implies
that there is relatively high level of the liquidity and low chances of the cash
squeeze. In this case, Bapcor current ratio for the last three consecutive years was as
follows:
2016 = 272,716 / 154,770 = 1.76
2017 = 616,066 / 282,976 = 2.18
2018 = 475,911 / 242,661 = 1.96
From the above values, it is evident that Bapcor experienced relatively high current ratio
over the past three years. This is a clear sign that for the past three years, Bapcor has
been running its operation smoothly and has been settling its short-term debts smoothly
without any form of difficulties.
Quick ratio
Financial Analysis And Assessment Of Bapcor Limited12
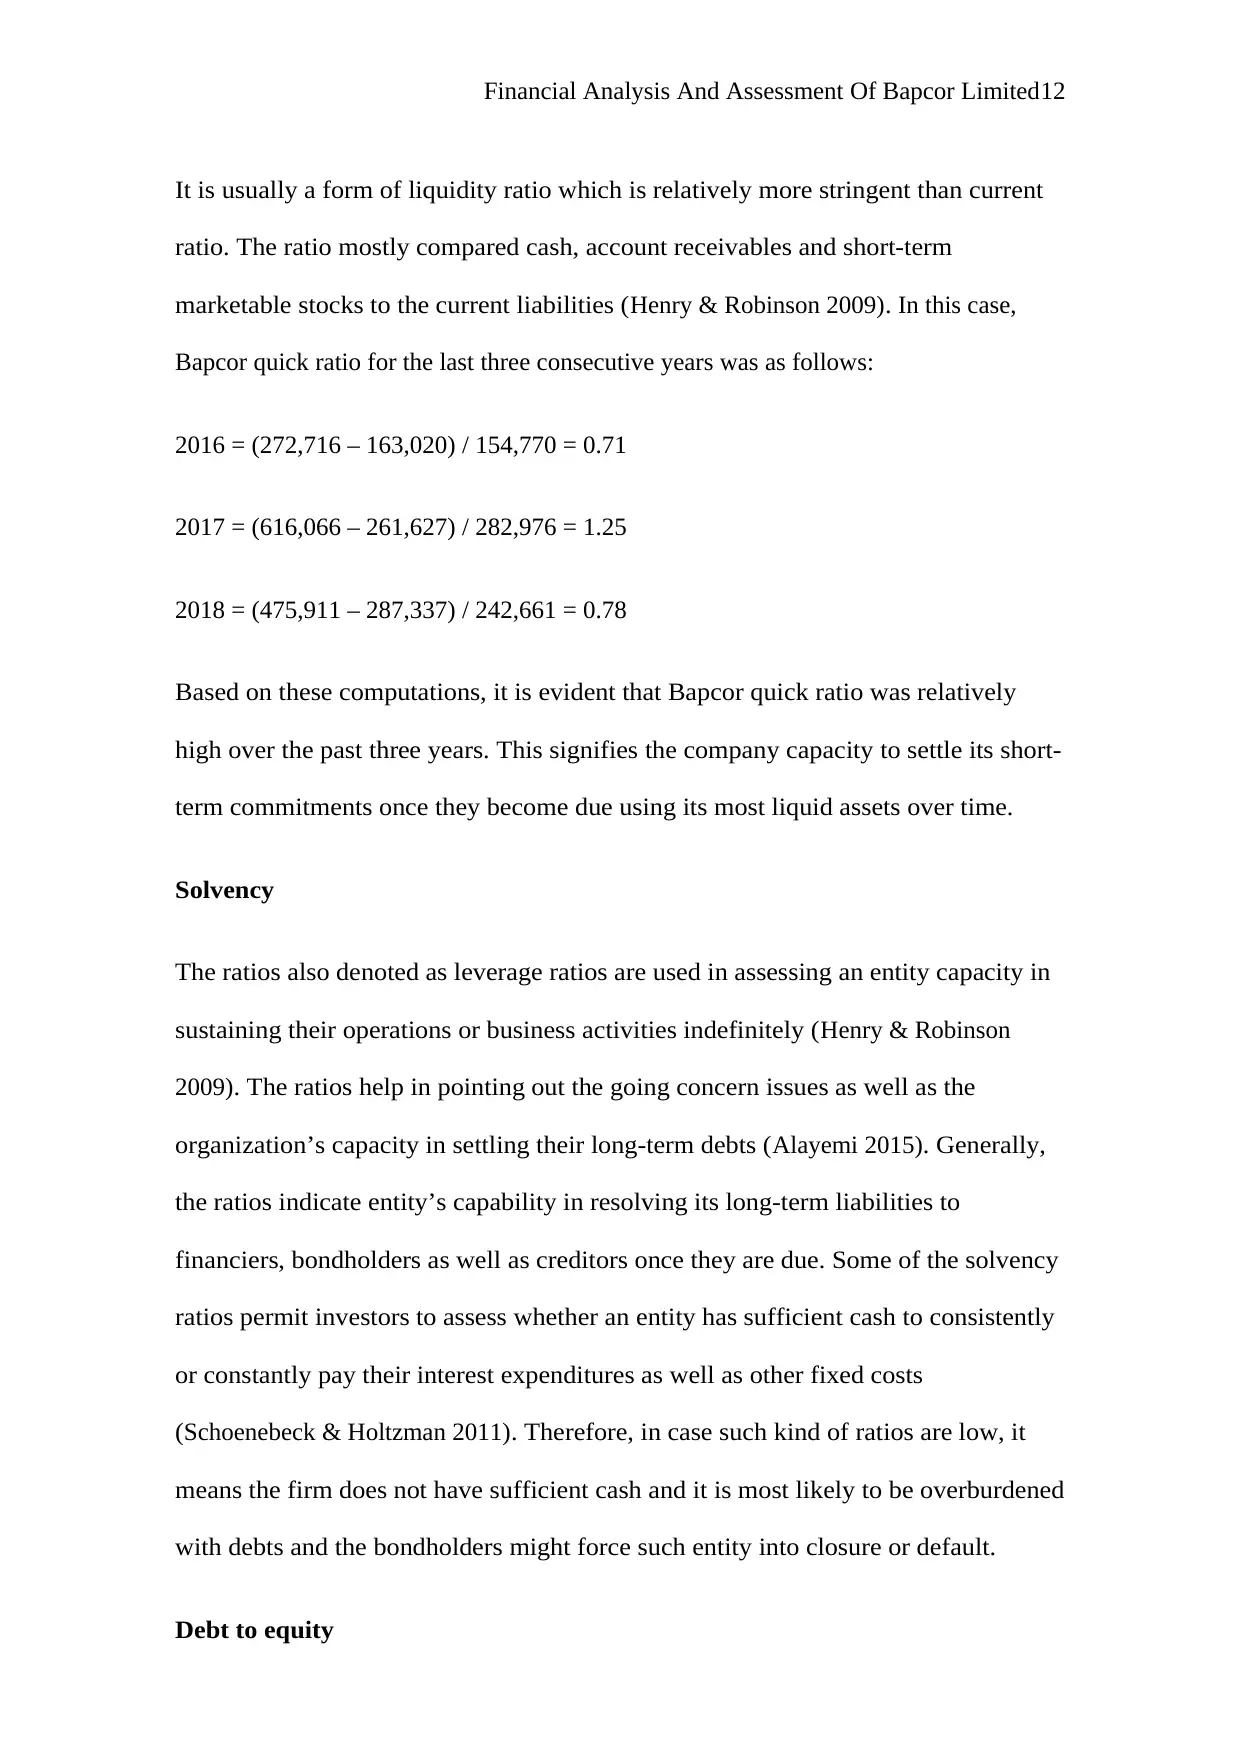
It is usually a form of liquidity ratio which is relatively more stringent than current
ratio. The ratio mostly compared cash, account receivables and short-term
marketable stocks to the current liabilities (Henry & Robinson 2009) . In this case,
Bapcor quick ratio for the last three consecutive years was as follows:
2016 = (272,716 – 163,020) / 154,770 = 0.71
2017 = (616,066 – 261,627) / 282,976 = 1.25
2018 = (475,911 – 287,337) / 242,661 = 0.78
Based on these computations, it is evident that Bapcor quick ratio was relatively
high over the past three years. This signifies the company capacity to settle its short-
term commitments once they become due using its most liquid assets over time.
Solvency
The ratios also denoted as leverage ratios are used in assessing an entity capacity in
sustaining their operations or business activities indefinitely (Henry & Robinson
2009) . The ratios help in pointing out the going concern issues as well as the
organization’s capacity in settling their long-term debts (Alayemi 2015) . Generally,
the ratios indicate entity’s capability in resolving its long-term liabilities to
financiers, bondholders as well as creditors once they are due. Some of the solvency
ratios permit investors to assess whether an entity has sufficient cash to consistently
or constantly pay their interest expenditures as well as other fixed costs
(Schoenebeck & Holtzman 2011) . Therefore, in case such kind of ratios are low, it
means the firm does not have sufficient cash and it is most likely to be overburdened
with debts and the bondholders might force such entity into closure or default.
Debt to equity
⊘ This is a preview!⊘
Do you want full access?
Subscribe today to unlock all pages.
Trusted by 1+ million students worldwide
1 out of 20
Related Documents


Your All-in-One AI-Powered Toolkit for Academic Success.
+13062052269
info@desklib.com
Available 24*7 on WhatsApp / Email
![[object Object]](/_next/static/media/star-bottom.7253800d.svg)
Unlock your academic potential
Copyright © 2020–2026 A2Z Services. All Rights Reserved. Developed and managed by ZUCOL.