Detailed Financial Analysis Report: BCI Minerals Limited - ACC701
VerifiedAdded on 2022/11/19
|15
|4315
|447
Report
AI Summary
This financial analysis report examines the performance of BCI Minerals Limited, a company listed on the Australian Stock Exchange, from 2014 to 2018. The report uses ratio analysis, trend analysis, and vertical analysis to assess the company's financial health. The analysis reveals declining profitability, efficiency, and revenue trends, indicating operational difficulties. The report highlights the company's reliance on in-house funds and suggests exploring new areas of operation. The findings are presented to the board of directors, offering insights into the company's financial position and potential strategies for improvement. The report includes an overview of the company, a detailed financial analysis, and conclusions based on the financial data provided. The report highlights the need for the company to explore other avenues to support its operations.

FINANCIAL ANALYSIS REPORT
BOARD OF DIRECTORS, BCI MINERALS LIMITED
BOARD OF DIRECTORS, BCI MINERALS LIMITED
Paraphrase This Document
Need a fresh take? Get an instant paraphrase of this document with our AI Paraphraser
EXECUTIVE SUMMARY
The company BCI Minerals Limited has been engaged in the business of the metals and
mining industry particularly in potash and iron ore and is publically listed on the Australian
Stock Exchange. It has been observed though the falling share prices of the enterprise that the
business performance of the entity has been consistently deteriorating. In order to understand
the reason behind the same, an evaluation in the form of financial analysis has been
undertaken. Financial analysis of the financial statements refers to the comprehensive
evaluation of the various aspects of the business operations of the enterprise. The popular
techniques of ratio analysis, trend analysis and the common size financial statements have
been used to assess the issues. The ratio analysis highlighted the declining profitability and
efficiency margins of the entity. The fact was further accorded in the trend analysis as visible
in the declining revenue trends. The vertical analysis further suggested that the entity is
currently heavily dependent on the in house funds and savings to sustain and the operations
are considerably declining. As a result of the above issues, the investors are seeking better
stocks than that of this company. The directors of the company are further suggested to
examine a new area of operation incidental to the mining and metal industry to aid the falling
operational performance.
Contents
Introduction................................................................................................................................3
Overview of the company..........................................................................................................3
Financial Analysis......................................................................................................................4
Ratio Analysis.......................................................................................................................4
Horizontal Analysis..............................................................................................................6
Vertical Analysis...................................................................................................................9
Conclusion................................................................................................................................11
References................................................................................................................................13
⊘ This is a preview!⊘
Do you want full access?
Subscribe today to unlock all pages.
Trusted by 1+ million students worldwide
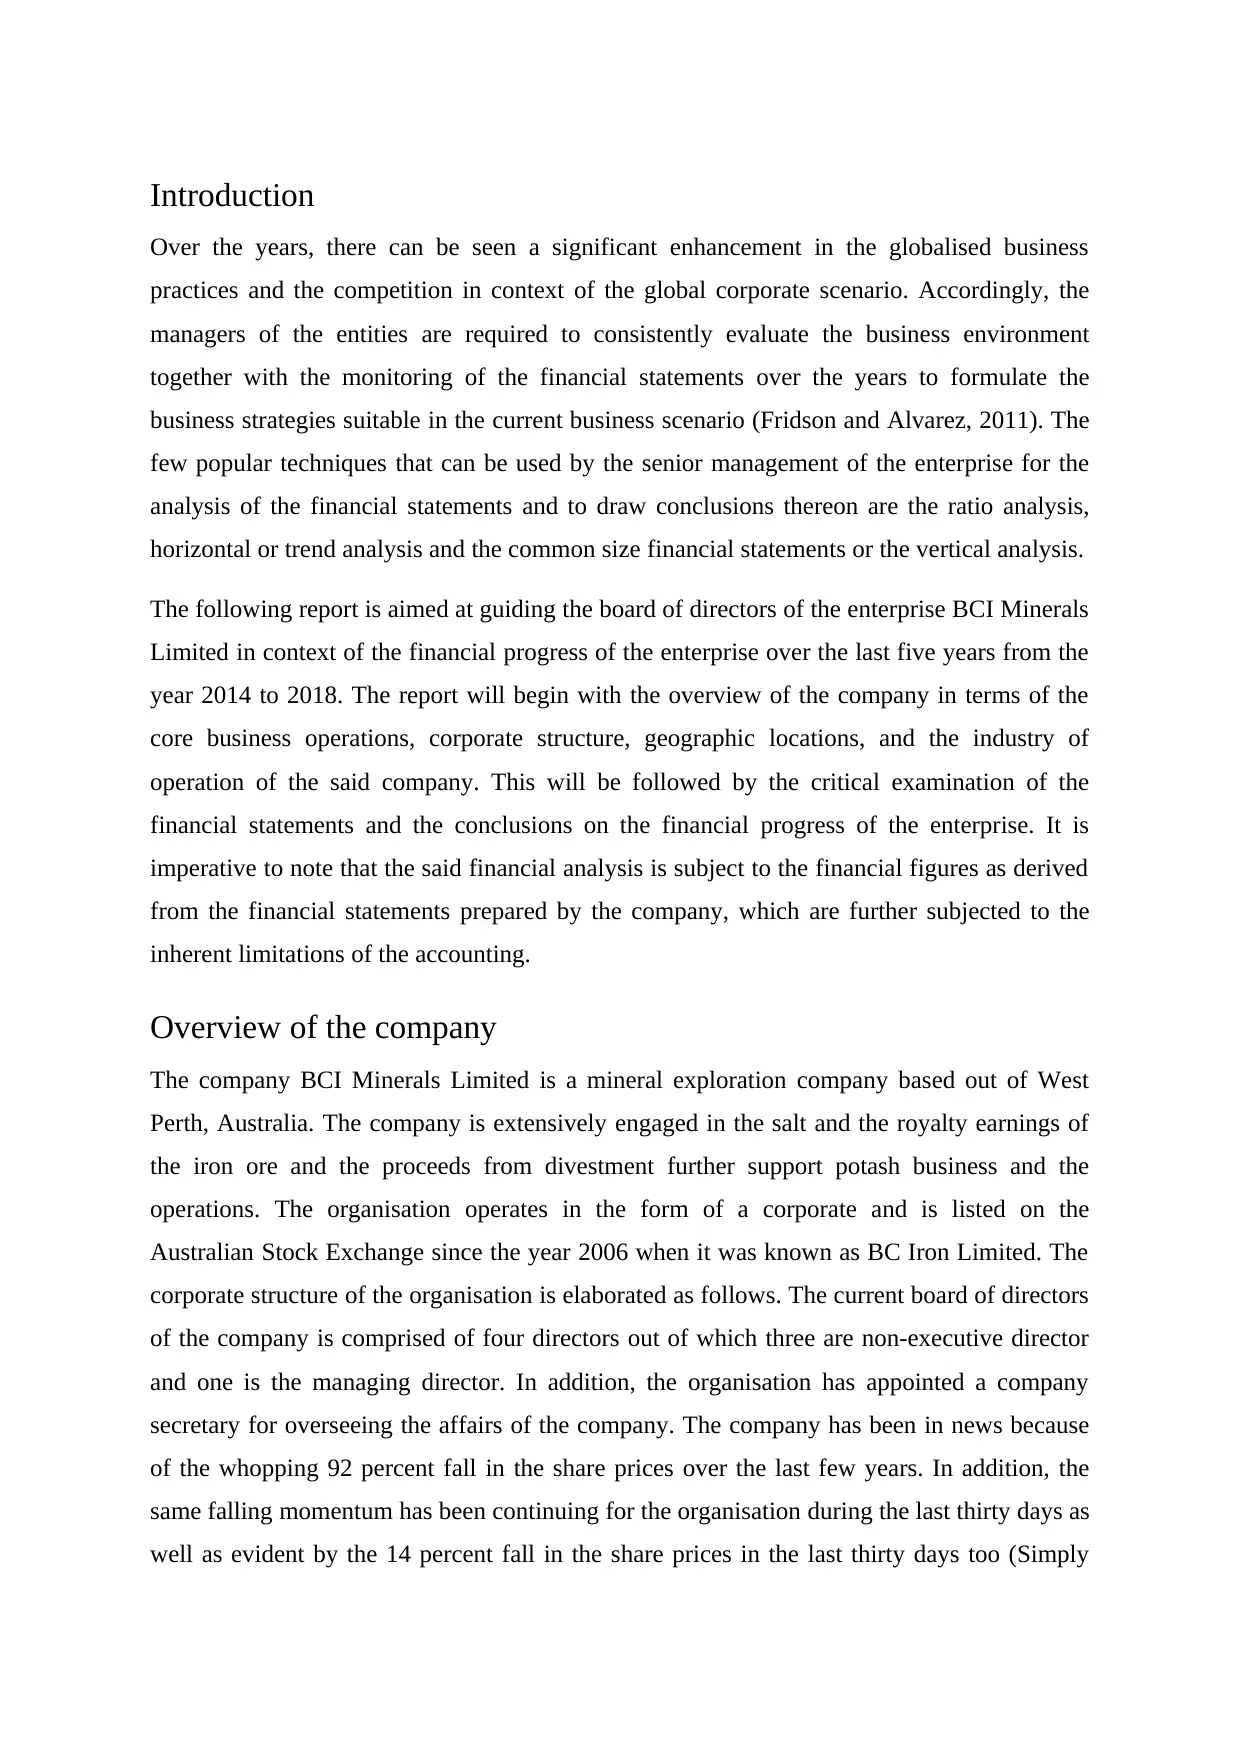
Introduction
Over the years, there can be seen a significant enhancement in the globalised business
practices and the competition in context of the global corporate scenario. Accordingly, the
managers of the entities are required to consistently evaluate the business environment
together with the monitoring of the financial statements over the years to formulate the
business strategies suitable in the current business scenario (Fridson and Alvarez, 2011). The
few popular techniques that can be used by the senior management of the enterprise for the
analysis of the financial statements and to draw conclusions thereon are the ratio analysis,
horizontal or trend analysis and the common size financial statements or the vertical analysis.
The following report is aimed at guiding the board of directors of the enterprise BCI Minerals
Limited in context of the financial progress of the enterprise over the last five years from the
year 2014 to 2018. The report will begin with the overview of the company in terms of the
core business operations, corporate structure, geographic locations, and the industry of
operation of the said company. This will be followed by the critical examination of the
financial statements and the conclusions on the financial progress of the enterprise. It is
imperative to note that the said financial analysis is subject to the financial figures as derived
from the financial statements prepared by the company, which are further subjected to the
inherent limitations of the accounting.
Overview of the company
The company BCI Minerals Limited is a mineral exploration company based out of West
Perth, Australia. The company is extensively engaged in the salt and the royalty earnings of
the iron ore and the proceeds from divestment further support potash business and the
operations. The organisation operates in the form of a corporate and is listed on the
Australian Stock Exchange since the year 2006 when it was known as BC Iron Limited. The
corporate structure of the organisation is elaborated as follows. The current board of directors
of the company is comprised of four directors out of which three are non-executive director
and one is the managing director. In addition, the organisation has appointed a company
secretary for overseeing the affairs of the company. The company has been in news because
of the whopping 92 percent fall in the share prices over the last few years. In addition, the
same falling momentum has been continuing for the organisation during the last thirty days as
well as evident by the 14 percent fall in the share prices in the last thirty days too (Simply
Paraphrase This Document
Need a fresh take? Get an instant paraphrase of this document with our AI Paraphraser
Wall Street, 2019a). It is imperative to note that the industry of Australian Potash in which
the organisation operates has been running on a lower average return on equity of 2.4 percent.
However, the metal and mining industry on an average has been 14 percent (Simply Wall
Street, 2019b). In order to understand the various aspects of the functioning and financial
picture of the organisation, a detailed financial analysis is necessitated, as carried on in the
next segment.
Financial Analysis
The financial analysis denotes the reviewing and analysing a company’s financial statements
by the varied stakeholder groups of the enterprise to facilitate the economic decision making
(Higgins, 2012). A number of techniques are used to gain an insight about the strategic
relationship between the items of the income statement, balance sheet, and other financial
statements. These techniques enable the simplification of the data to interpret the financial
health of the enterprise. The application of the various techniques on the financial statements
of the company BCI Minerals Limited for the period of five years is stated as follows.
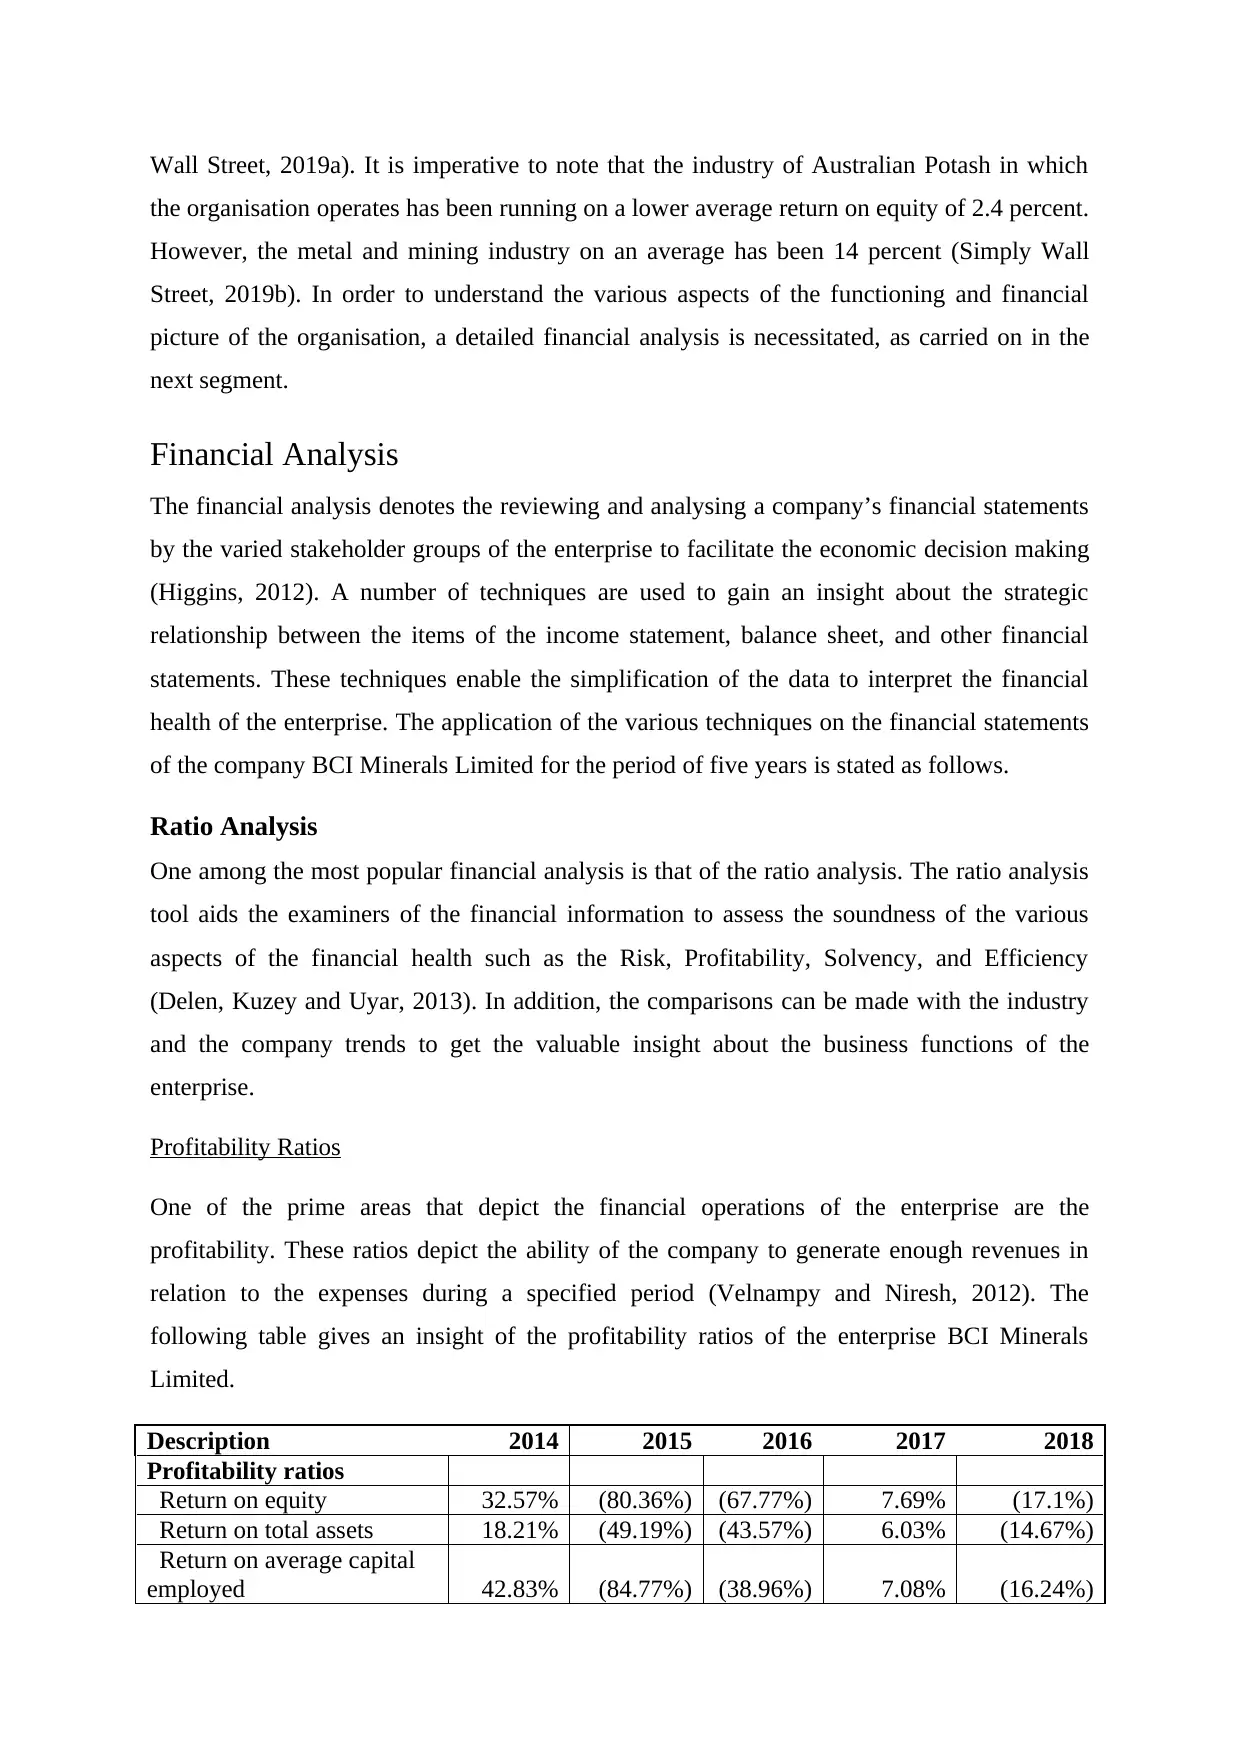
Ratio Analysis
One among the most popular financial analysis is that of the ratio analysis. The ratio analysis
tool aids the examiners of the financial information to assess the soundness of the various
aspects of the financial health such as the Risk, Profitability, Solvency, and Efficiency
(Delen, Kuzey and Uyar, 2013). In addition, the comparisons can be made with the industry
and the company trends to get the valuable insight about the business functions of the
enterprise.
Profitability Ratios
One of the prime areas that depict the financial operations of the enterprise are the
profitability. These ratios depict the ability of the company to generate enough revenues in
relation to the expenses during a specified period (Velnampy and Niresh, 2012). The
following table gives an insight of the profitability ratios of the enterprise BCI Minerals
Limited.
Description 2014 2015 2016 2017 2018
Profitability ratios
Return on equity 32.57% (80.36%) (67.77%) 7.69% (17.1%)
Return on total assets 18.21% (49.19%) (43.57%) 6.03% (14.67%)
Return on average capital
employed 42.83% (84.77%) (38.96%) 7.08% (16.24%)
the organisation operates has been running on a lower average return on equity of 2.4 percent.
However, the metal and mining industry on an average has been 14 percent (Simply Wall
Street, 2019b). In order to understand the various aspects of the functioning and financial
picture of the organisation, a detailed financial analysis is necessitated, as carried on in the
next segment.
Financial Analysis
The financial analysis denotes the reviewing and analysing a company’s financial statements
by the varied stakeholder groups of the enterprise to facilitate the economic decision making
(Higgins, 2012). A number of techniques are used to gain an insight about the strategic
relationship between the items of the income statement, balance sheet, and other financial
statements. These techniques enable the simplification of the data to interpret the financial
health of the enterprise. The application of the various techniques on the financial statements
of the company BCI Minerals Limited for the period of five years is stated as follows.
Ratio Analysis
One among the most popular financial analysis is that of the ratio analysis. The ratio analysis
tool aids the examiners of the financial information to assess the soundness of the various
aspects of the financial health such as the Risk, Profitability, Solvency, and Efficiency
(Delen, Kuzey and Uyar, 2013). In addition, the comparisons can be made with the industry
and the company trends to get the valuable insight about the business functions of the
enterprise.
Profitability Ratios
One of the prime areas that depict the financial operations of the enterprise are the
profitability. These ratios depict the ability of the company to generate enough revenues in
relation to the expenses during a specified period (Velnampy and Niresh, 2012). The
following table gives an insight of the profitability ratios of the enterprise BCI Minerals
Limited.
Description 2014 2015 2016 2017 2018
Profitability ratios
Return on equity 32.57% (80.36%) (67.77%) 7.69% (17.1%)
Return on total assets 18.21% (49.19%) (43.57%) 6.03% (14.67%)
Return on average capital
employed 42.83% (84.77%) (38.96%) 7.08% (16.24%)
Gross margin 41.04% 11.31% 9.12% 25.36% 10.45%
EBIT margin 26.36% (71.09%) (34.32%) 11.03% (50.55%)
Profit from continuing
operations after tax margin 15.62% (56.36%) (52.85%) 11.03% (50.55%)
Net profit margin 15.62% (56.36%) (52.85%) 11.03% (50.55%)
Cash flow from operating
activities/Revenue 31.3% (11.65%) (30.94%) 18.52% (35.75%)
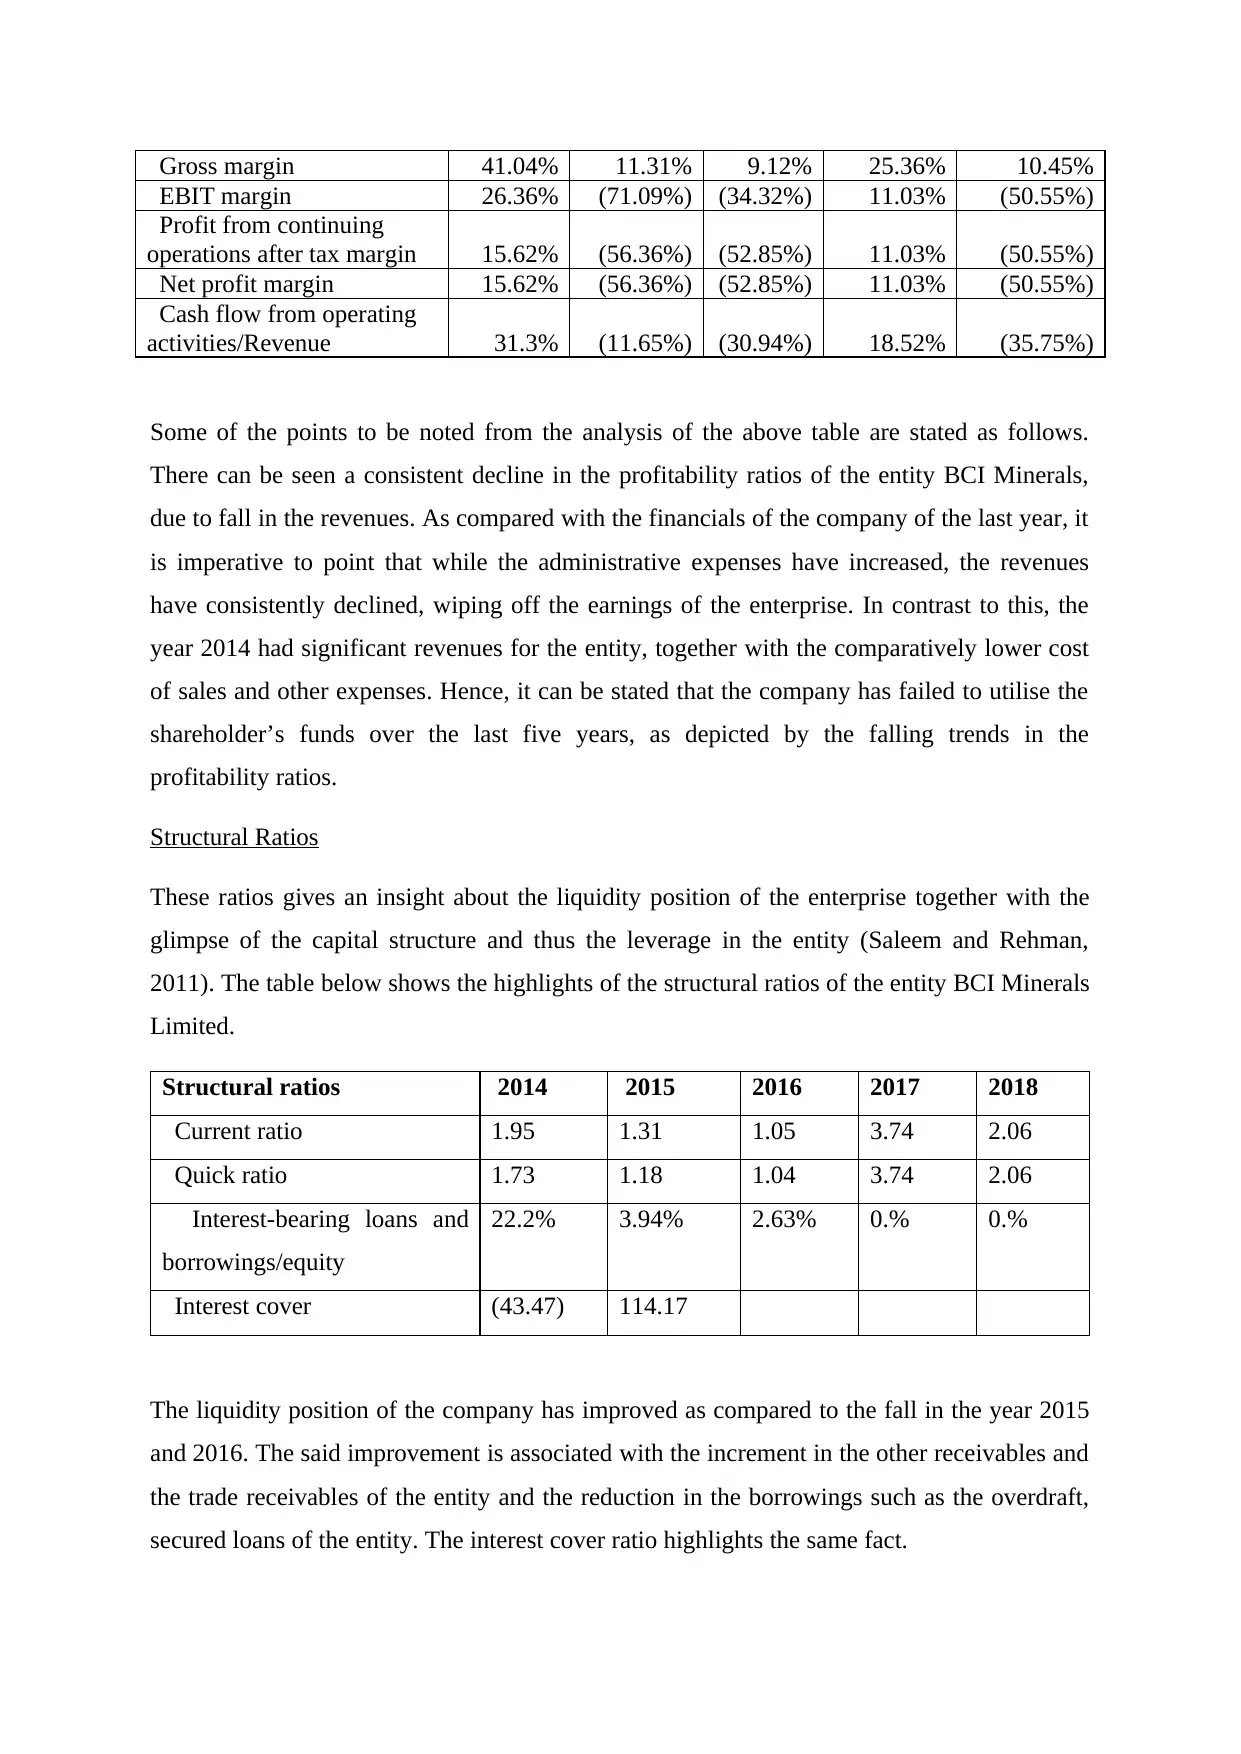
Some of the points to be noted from the analysis of the above table are stated as follows.
There can be seen a consistent decline in the profitability ratios of the entity BCI Minerals,
due to fall in the revenues. As compared with the financials of the company of the last year, it
is imperative to point that while the administrative expenses have increased, the revenues
have consistently declined, wiping off the earnings of the enterprise. In contrast to this, the
year 2014 had significant revenues for the entity, together with the comparatively lower cost
of sales and other expenses. Hence, it can be stated that the company has failed to utilise the
shareholder’s funds over the last five years, as depicted by the falling trends in the
profitability ratios.
Structural Ratios
These ratios gives an insight about the liquidity position of the enterprise together with the
glimpse of the capital structure and thus the leverage in the entity (Saleem and Rehman,
2011). The table below shows the highlights of the structural ratios of the entity BCI Minerals
Limited.
Structural ratios 2014 2015 2016 2017 2018
Current ratio 1.95 1.31 1.05 3.74 2.06
Quick ratio 1.73 1.18 1.04 3.74 2.06
Interest-bearing loans and
borrowings/equity
22.2% 3.94% 2.63% 0.% 0.%
Interest cover (43.47) 114.17
The liquidity position of the company has improved as compared to the fall in the year 2015
and 2016. The said improvement is associated with the increment in the other receivables and
the trade receivables of the entity and the reduction in the borrowings such as the overdraft,
secured loans of the entity. The interest cover ratio highlights the same fact.
EBIT margin 26.36% (71.09%) (34.32%) 11.03% (50.55%)
Profit from continuing
operations after tax margin 15.62% (56.36%) (52.85%) 11.03% (50.55%)
Net profit margin 15.62% (56.36%) (52.85%) 11.03% (50.55%)
Cash flow from operating
activities/Revenue 31.3% (11.65%) (30.94%) 18.52% (35.75%)
Some of the points to be noted from the analysis of the above table are stated as follows.
There can be seen a consistent decline in the profitability ratios of the entity BCI Minerals,
due to fall in the revenues. As compared with the financials of the company of the last year, it
is imperative to point that while the administrative expenses have increased, the revenues
have consistently declined, wiping off the earnings of the enterprise. In contrast to this, the
year 2014 had significant revenues for the entity, together with the comparatively lower cost
of sales and other expenses. Hence, it can be stated that the company has failed to utilise the
shareholder’s funds over the last five years, as depicted by the falling trends in the
profitability ratios.
Structural Ratios
These ratios gives an insight about the liquidity position of the enterprise together with the
glimpse of the capital structure and thus the leverage in the entity (Saleem and Rehman,
2011). The table below shows the highlights of the structural ratios of the entity BCI Minerals
Limited.
Structural ratios 2014 2015 2016 2017 2018
Current ratio 1.95 1.31 1.05 3.74 2.06
Quick ratio 1.73 1.18 1.04 3.74 2.06
Interest-bearing loans and
borrowings/equity
22.2% 3.94% 2.63% 0.% 0.%
Interest cover (43.47) 114.17
The liquidity position of the company has improved as compared to the fall in the year 2015
and 2016. The said improvement is associated with the increment in the other receivables and
the trade receivables of the entity and the reduction in the borrowings such as the overdraft,
secured loans of the entity. The interest cover ratio highlights the same fact.
⊘ This is a preview!⊘
Do you want full access?
Subscribe today to unlock all pages.
Trusted by 1+ million students worldwide
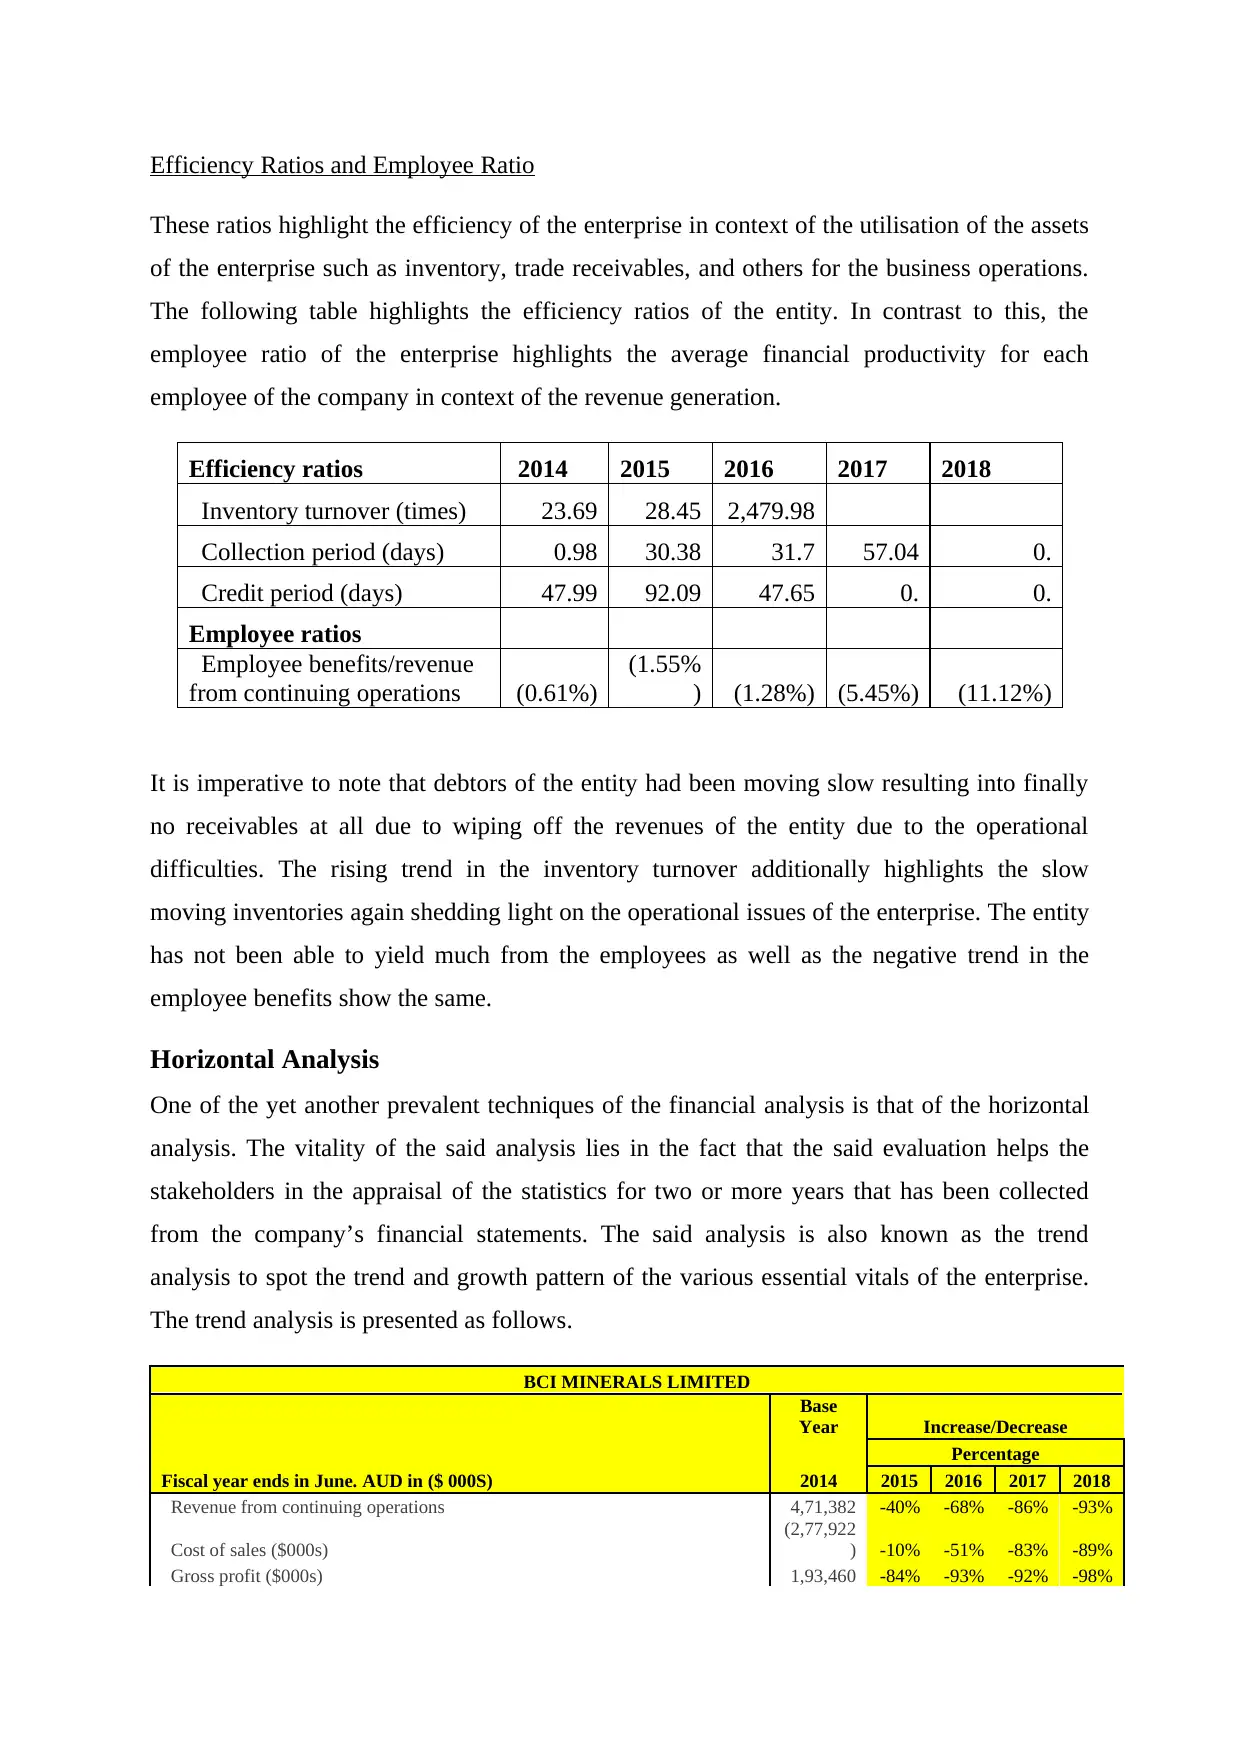
Efficiency Ratios and Employee Ratio
These ratios highlight the efficiency of the enterprise in context of the utilisation of the assets
of the enterprise such as inventory, trade receivables, and others for the business operations.
The following table highlights the efficiency ratios of the entity. In contrast to this, the
employee ratio of the enterprise highlights the average financial productivity for each
employee of the company in context of the revenue generation.
Efficiency ratios 2014 2015 2016 2017 2018
Inventory turnover (times) 23.69 28.45 2,479.98
Collection period (days) 0.98 30.38 31.7 57.04 0.
Credit period (days) 47.99 92.09 47.65 0. 0.
Employee ratios
Employee benefits/revenue
from continuing operations (0.61%)
(1.55%
) (1.28%) (5.45%) (11.12%)
It is imperative to note that debtors of the entity had been moving slow resulting into finally
no receivables at all due to wiping off the revenues of the entity due to the operational
difficulties. The rising trend in the inventory turnover additionally highlights the slow
moving inventories again shedding light on the operational issues of the enterprise. The entity
has not been able to yield much from the employees as well as the negative trend in the
employee benefits show the same.
Horizontal Analysis
One of the yet another prevalent techniques of the financial analysis is that of the horizontal
analysis. The vitality of the said analysis lies in the fact that the said evaluation helps the
stakeholders in the appraisal of the statistics for two or more years that has been collected
from the company’s financial statements. The said analysis is also known as the trend
analysis to spot the trend and growth pattern of the various essential vitals of the enterprise.
The trend analysis is presented as follows.
BCI MINERALS LIMITED
Base
Year Increase/Decrease
Percentage
Fiscal year ends in June. AUD in ($ 000S) 2014 2015 2016 2017 2018
Revenue from continuing operations 4,71,382 -40% -68% -86% -93%
Cost of sales ($000s)
(2,77,922
) -10% -51% -83% -89%
Gross profit ($000s) 1,93,460 -84% -93% -92% -98%
Paraphrase This Document
Need a fresh take? Get an instant paraphrase of this document with our AI Paraphraser

Other income ($000s) 1,591
-
100
% -49%
-
100
%
-
100
%
Administrative expenses ($000s) (3,684) 217
%
111
%
24% 454
%
Finance costs ($000s) (4,340) -19% -78%
-
100
%
-
100
%
Share of associate profits/(losses) ($000s)
Profit/(loss) from continuing operations before income tax ($000s) 1,19,905
-
270
%
-
144
% -94%
-
114
%
Income tax expense ($000s) (46,257)
-
197
% -41%
-
100
%
-
100
%
Profit from continuing operations after income tax ($000s) 73,648
-
315
%
-
209
% -90%
-
123
%
Net profit for the period ($000s) 73,648
-
315
%
-
209
% -90%
-
123
%
BCI MINERALS LIMITED
Base
Year Increase/Decrease
Percentage
Fiscal year ends in June. AUD in (000s) 2014 2015 2016 2017 2018
Balance Sheet
Current Assets
Cash and cash equivalents ($000s)
1,58,91
7 -57% -94% -77% -92%
Trade receivables ($000s) 1,262 51% 67% -13%
Other receivables ($000s) 2,699 -82%
-
471
%
-
652
%
9813
%
Raw materials ($000s) 3,721
Work-in-progress ($000s)
Finished goods ($000s) 16,173
Total inventories ($000s) 19,894
Prepayments ($000s)
Derivative financial instruments ($000s)
Other current assets ($000s) 1,003
Total current assets for continuing operations ($000s)
1,83,77
5 -44%
-
157
%
-
592
% -352%
Assets held for sale ($000s)
Total current assets ($000s)
1,83,77
5 -44%
-
157
%
-
592
% -352%
Non-current assets
Receivables ($000s) 261
% 82% 113%
Investments in associates ($000s) 0
Investments in subsidiaries ($000s)
-
100
% -49%
-
100
%
-
100
%
Administrative expenses ($000s) (3,684) 217
%
111
%
24% 454
%
Finance costs ($000s) (4,340) -19% -78%
-
100
%
-
100
%
Share of associate profits/(losses) ($000s)
Profit/(loss) from continuing operations before income tax ($000s) 1,19,905
-
270
%
-
144
% -94%
-
114
%
Income tax expense ($000s) (46,257)
-
197
% -41%
-
100
%
-
100
%
Profit from continuing operations after income tax ($000s) 73,648
-
315
%
-
209
% -90%
-
123
%
Net profit for the period ($000s) 73,648
-
315
%
-
209
% -90%
-
123
%
BCI MINERALS LIMITED
Base
Year Increase/Decrease
Percentage
Fiscal year ends in June. AUD in (000s) 2014 2015 2016 2017 2018
Balance Sheet
Current Assets
Cash and cash equivalents ($000s)
1,58,91
7 -57% -94% -77% -92%
Trade receivables ($000s) 1,262 51% 67% -13%
Other receivables ($000s) 2,699 -82%
-
471
%
-
652
%
9813
%
Raw materials ($000s) 3,721
Work-in-progress ($000s)
Finished goods ($000s) 16,173
Total inventories ($000s) 19,894
Prepayments ($000s)
Derivative financial instruments ($000s)
Other current assets ($000s) 1,003
Total current assets for continuing operations ($000s)
1,83,77
5 -44%
-
157
%
-
592
% -352%
Assets held for sale ($000s)
Total current assets ($000s)
1,83,77
5 -44%
-
157
%
-
592
% -352%
Non-current assets
Receivables ($000s) 261
% 82% 113%
Investments in associates ($000s) 0
Investments in subsidiaries ($000s)
Available for sale financial assets ($000s) 1,791
Derivative financial instruments ($000s)
Property, plant and equipment ($000s)
1,89,26
7 -66%
-
212
%
-
273
% -327%
Intangible assets and goodwill ($000s) 0 90%
100
% 100%
Deferred tax assets ($000s)
Other non-current assets ($000s) 12,356 180
% -24%
-
189
% 47%
Total non-current assets ($000s)
2,03,41
4 -24% -75%
-
145
% -151%
TOTAL ASSETS ($000s)
3,87,18
9 -34%
-
108
%
-
239
% -226%
TOTAL ASSETS FOR PREVIOUS YEAR ($000s)
4,21,58
3 -8% -42%
-
121
% -271%
Current liabilities
Trade payables ($000s) 61,976
Other payables ($000s)
Overdrafts ($000s)
Loans - secured ($000s) 18,769
Loans - unsecured ($000s) 5,308
Obligations under finance leases and hire purchase ($000s)
Loans from related parties ($000s)
Total current interest-bearing loans and borrowings
($000s) 24,077
Income tax payable/(refundable) ($000s) 6,520
Provisions ($000s) 1,899 -42%
-
134
%
-
387
% -486%
Derivative financial instruments ($000s)
Other current liabilities ($000s) 0
Total current liabilities for continuing operations
($000s) 94,472 -17% -92%
-
370
% -682%
Liabilities directly associated with assets held for sale ($000s)
Total current liabilities ($000s) 94,472 -17% -92%
-
370
% -682%
Total current liabilities for previous year ($000s)
1,34,08
0 -30% -59%
-
143
% -548%
Non-current liabilities
Loans - secured ($000s) 23,621
Loans - unsecured ($000s) 4,511
Obligations under finance leases and hire purchase ($000s)
Loans from related parties ($000s)
Total non-current interest-bearing loans and 28,132
Derivative financial instruments ($000s)
Property, plant and equipment ($000s)
1,89,26
7 -66%
-
212
%
-
273
% -327%
Intangible assets and goodwill ($000s) 0 90%
100
% 100%
Deferred tax assets ($000s)
Other non-current assets ($000s) 12,356 180
% -24%
-
189
% 47%
Total non-current assets ($000s)
2,03,41
4 -24% -75%
-
145
% -151%
TOTAL ASSETS ($000s)
3,87,18
9 -34%
-
108
%
-
239
% -226%
TOTAL ASSETS FOR PREVIOUS YEAR ($000s)
4,21,58
3 -8% -42%
-
121
% -271%
Current liabilities
Trade payables ($000s) 61,976
Other payables ($000s)
Overdrafts ($000s)
Loans - secured ($000s) 18,769
Loans - unsecured ($000s) 5,308
Obligations under finance leases and hire purchase ($000s)
Loans from related parties ($000s)
Total current interest-bearing loans and borrowings
($000s) 24,077
Income tax payable/(refundable) ($000s) 6,520
Provisions ($000s) 1,899 -42%
-
134
%
-
387
% -486%
Derivative financial instruments ($000s)
Other current liabilities ($000s) 0
Total current liabilities for continuing operations
($000s) 94,472 -17% -92%
-
370
% -682%
Liabilities directly associated with assets held for sale ($000s)
Total current liabilities ($000s) 94,472 -17% -92%
-
370
% -682%
Total current liabilities for previous year ($000s)
1,34,08
0 -30% -59%
-
143
% -548%
Non-current liabilities
Loans - secured ($000s) 23,621
Loans - unsecured ($000s) 4,511
Obligations under finance leases and hire purchase ($000s)
Loans from related parties ($000s)
Total non-current interest-bearing loans and 28,132
⊘ This is a preview!⊘
Do you want full access?
Subscribe today to unlock all pages.
Trusted by 1+ million students worldwide
borrowings ($000s)
Derivative financial instruments ($000s)
Deferred tax liabilities ($000s) 14,983
Provisions ($000s) 14,428 36% -18% -87% -179%
Convertible redeemable preference shares ($000s)
Other non-current liabilities ($000s) 0
Total non-current liabilities ($000s) 57,543 -66%
-
237
%
-
483
%
-
1054
%
TOTAL LIABILITIES ($000s)
1,52,01
5 -36%
-
121
%
-
407
% -788%
NET ASSETS ($000s)
2,35,17
4 -32%
-
100
%
-
167
% -135%
Equity
Equity attributable to equity holders of the parent
Contributed equity ($000s)
1,31,33
9 85% 46% 56% 51%
Retained earnings ($000s) 89,843
-
201
%
287
%
149
% 165%
Reserves ($000s) 13,992 -46%
-
121
%
-
175
% -156%
Total Parent interests ($000s)
2,35,17
4 -32%
-
100
%
-
167
% -135%
Minority interests ($000s)
TOTAL EQUITY ($000s)
2,35,17
4 -32%
-
100
%
-
167
% -135%
TOTAL EQUITY FOR PREVIOUS YEAR ($000s)
2,17,09
3 8% -25% -88% -143%
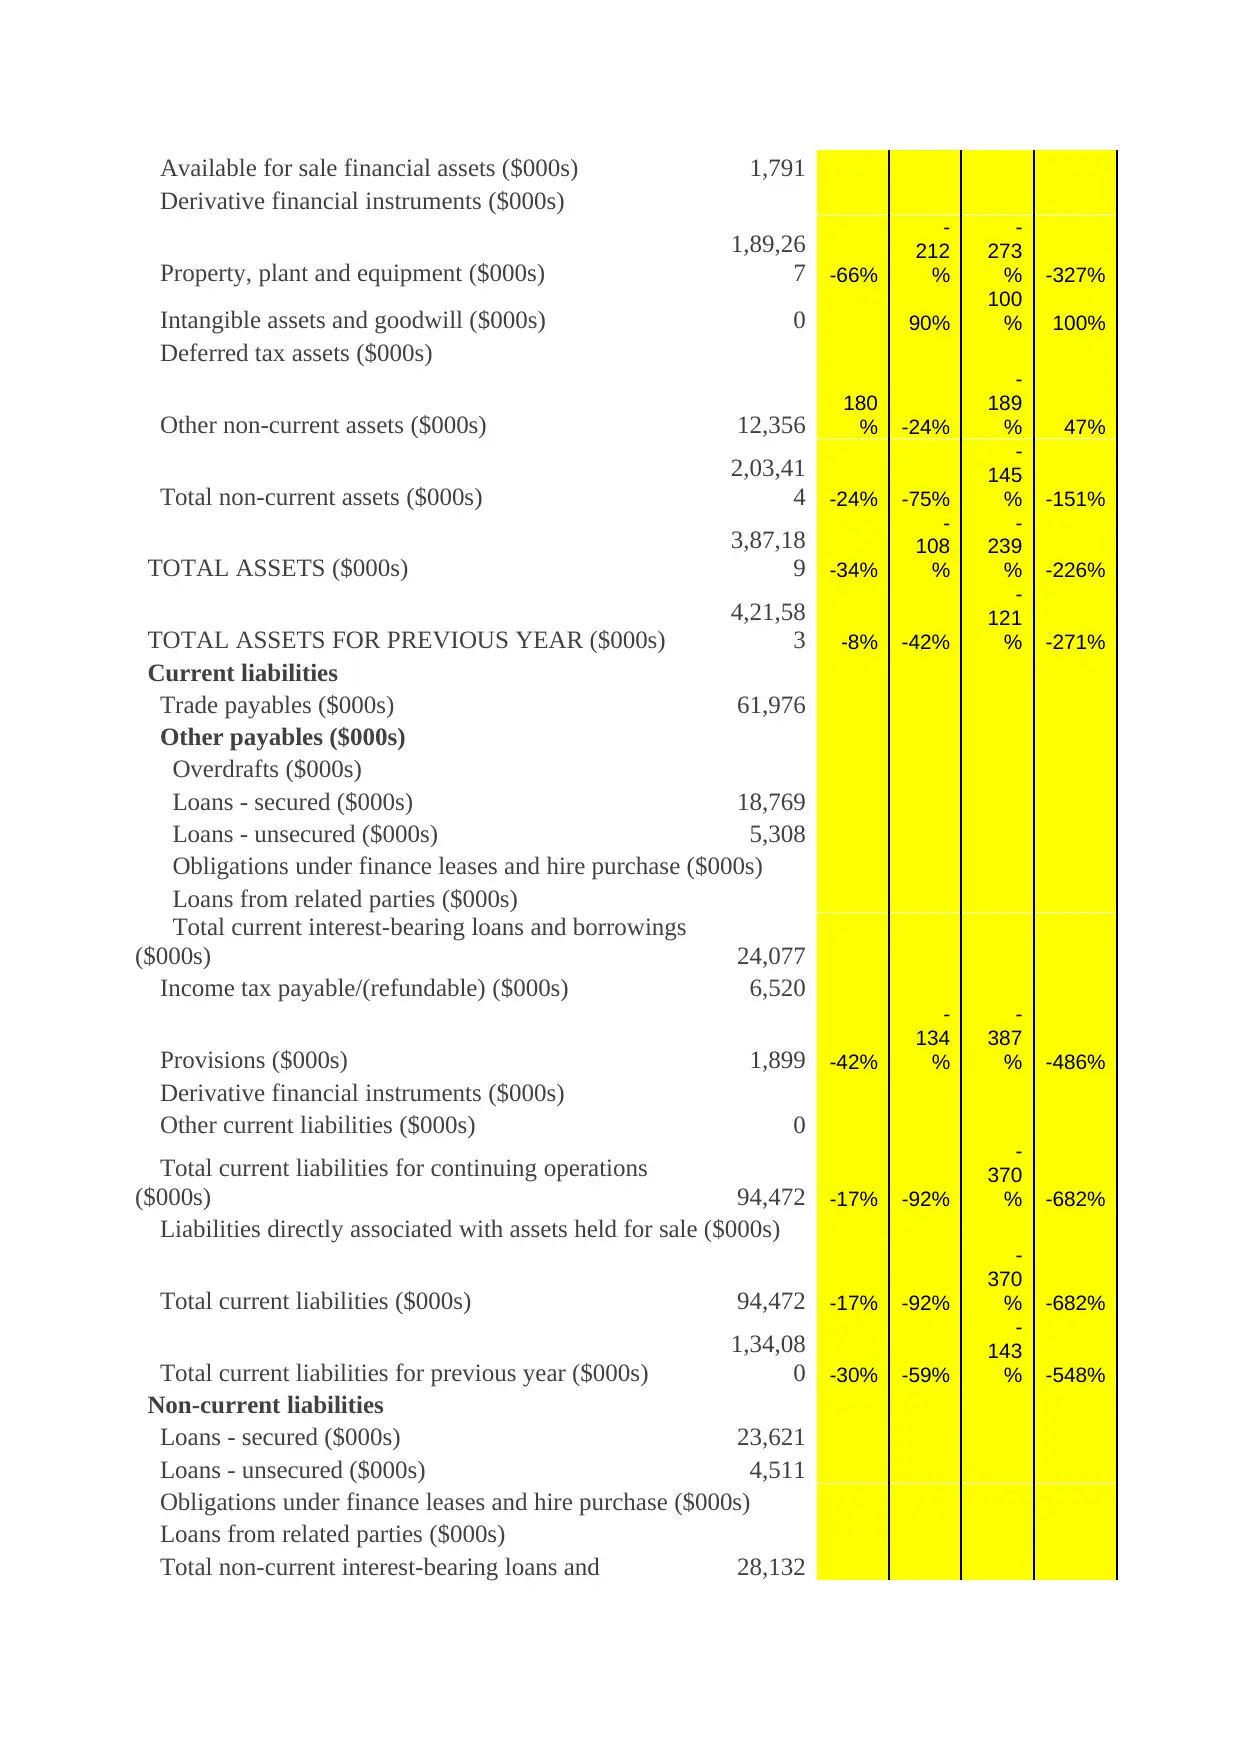
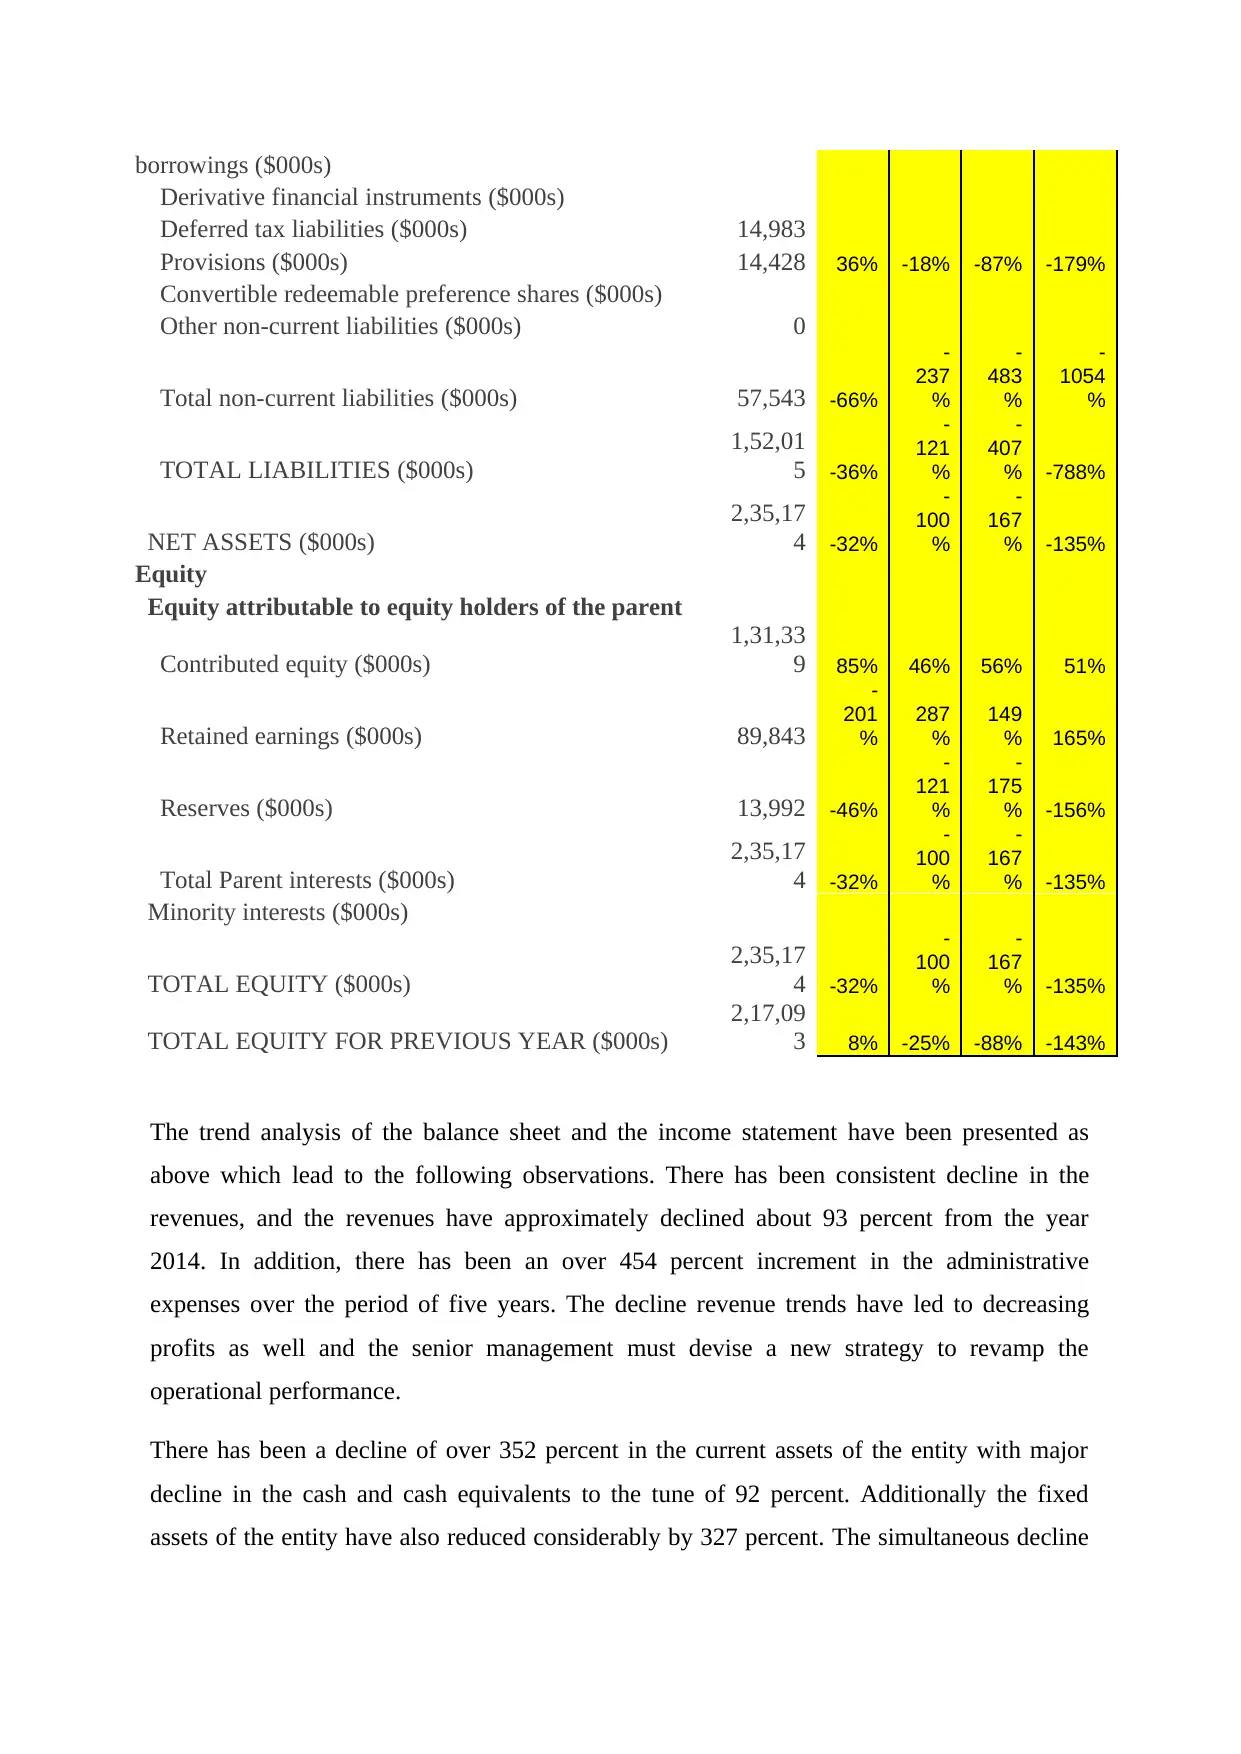
The trend analysis of the balance sheet and the income statement have been presented as
above which lead to the following observations. There has been consistent decline in the
revenues, and the revenues have approximately declined about 93 percent from the year
2014. In addition, there has been an over 454 percent increment in the administrative
expenses over the period of five years. The decline revenue trends have led to decreasing
profits as well and the senior management must devise a new strategy to revamp the
operational performance.
There has been a decline of over 352 percent in the current assets of the entity with major
decline in the cash and cash equivalents to the tune of 92 percent. Additionally the fixed
assets of the entity have also reduced considerably by 327 percent. The simultaneous decline
Derivative financial instruments ($000s)
Deferred tax liabilities ($000s) 14,983
Provisions ($000s) 14,428 36% -18% -87% -179%
Convertible redeemable preference shares ($000s)
Other non-current liabilities ($000s) 0
Total non-current liabilities ($000s) 57,543 -66%
-
237
%
-
483
%
-
1054
%
TOTAL LIABILITIES ($000s)
1,52,01
5 -36%
-
121
%
-
407
% -788%
NET ASSETS ($000s)
2,35,17
4 -32%
-
100
%
-
167
% -135%
Equity
Equity attributable to equity holders of the parent
Contributed equity ($000s)
1,31,33
9 85% 46% 56% 51%
Retained earnings ($000s) 89,843
-
201
%
287
%
149
% 165%
Reserves ($000s) 13,992 -46%
-
121
%
-
175
% -156%
Total Parent interests ($000s)
2,35,17
4 -32%
-
100
%
-
167
% -135%
Minority interests ($000s)
TOTAL EQUITY ($000s)
2,35,17
4 -32%
-
100
%
-
167
% -135%
TOTAL EQUITY FOR PREVIOUS YEAR ($000s)
2,17,09
3 8% -25% -88% -143%
The trend analysis of the balance sheet and the income statement have been presented as
above which lead to the following observations. There has been consistent decline in the
revenues, and the revenues have approximately declined about 93 percent from the year
2014. In addition, there has been an over 454 percent increment in the administrative
expenses over the period of five years. The decline revenue trends have led to decreasing
profits as well and the senior management must devise a new strategy to revamp the
operational performance.
There has been a decline of over 352 percent in the current assets of the entity with major
decline in the cash and cash equivalents to the tune of 92 percent. Additionally the fixed
assets of the entity have also reduced considerably by 327 percent. The simultaneous decline
Paraphrase This Document
Need a fresh take? Get an instant paraphrase of this document with our AI Paraphraser
in the total liabilities of the entity has also led to the observation of the fact that the entity’s
going concern seems to be in danger.
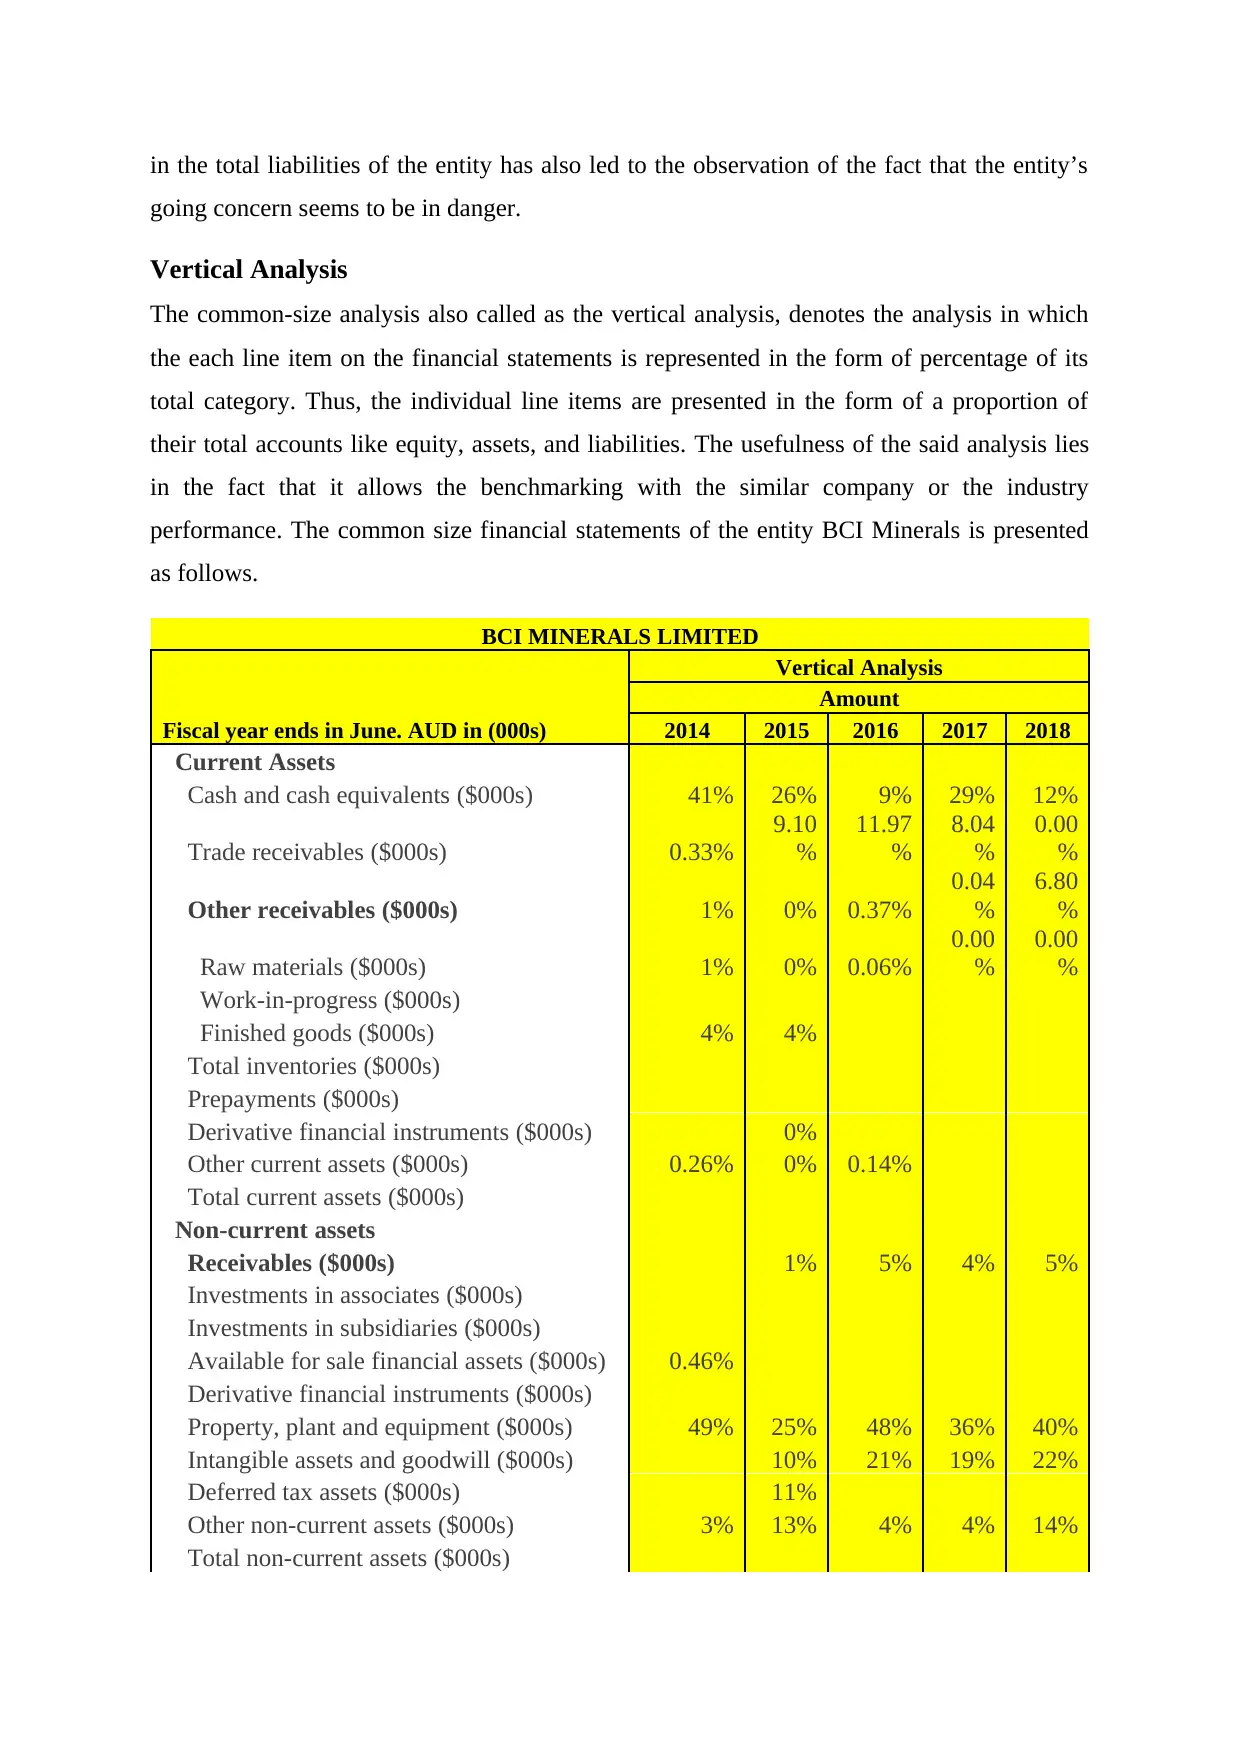
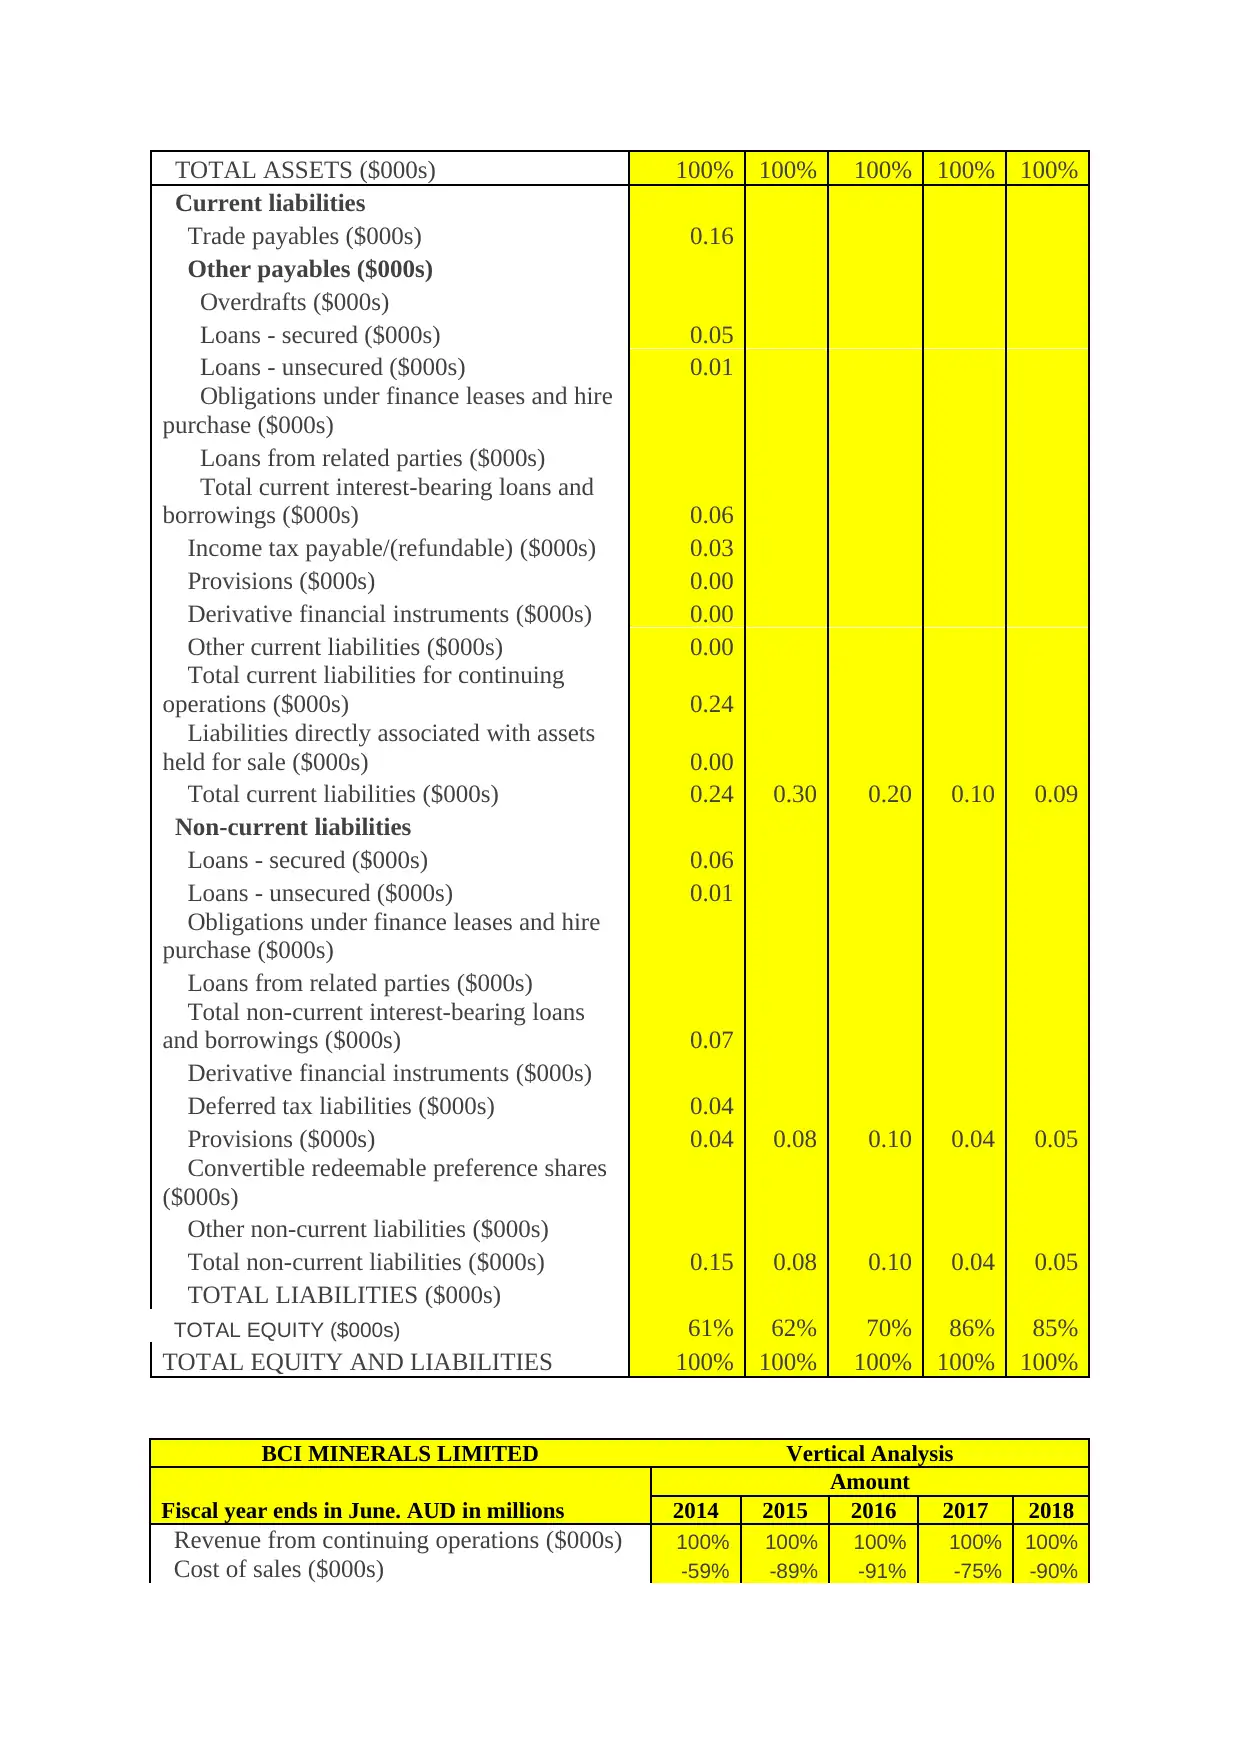
Vertical Analysis
The common-size analysis also called as the vertical analysis, denotes the analysis in which
the each line item on the financial statements is represented in the form of percentage of its
total category. Thus, the individual line items are presented in the form of a proportion of
their total accounts like equity, assets, and liabilities. The usefulness of the said analysis lies
in the fact that it allows the benchmarking with the similar company or the industry
performance. The common size financial statements of the entity BCI Minerals is presented
as follows.
BCI MINERALS LIMITED
Vertical Analysis
Amount
Fiscal year ends in June. AUD in (000s) 2014 2015 2016 2017 2018
Current Assets
Cash and cash equivalents ($000s) 41% 26% 9% 29% 12%
Trade receivables ($000s) 0.33%
9.10
%
11.97
%
8.04
%
0.00
%
Other receivables ($000s) 1% 0% 0.37%
0.04
%
6.80
%
Raw materials ($000s) 1% 0% 0.06%
0.00
%
0.00
%
Work-in-progress ($000s)
Finished goods ($000s) 4% 4%
Total inventories ($000s)
Prepayments ($000s)
Derivative financial instruments ($000s) 0%
Other current assets ($000s) 0.26% 0% 0.14%
Total current assets ($000s)
Non-current assets
Receivables ($000s) 1% 5% 4% 5%
Investments in associates ($000s)
Investments in subsidiaries ($000s)
Available for sale financial assets ($000s) 0.46%
Derivative financial instruments ($000s)
Property, plant and equipment ($000s) 49% 25% 48% 36% 40%
Intangible assets and goodwill ($000s) 10% 21% 19% 22%
Deferred tax assets ($000s) 11%
Other non-current assets ($000s) 3% 13% 4% 4% 14%
Total non-current assets ($000s)
going concern seems to be in danger.
Vertical Analysis
The common-size analysis also called as the vertical analysis, denotes the analysis in which
the each line item on the financial statements is represented in the form of percentage of its
total category. Thus, the individual line items are presented in the form of a proportion of
their total accounts like equity, assets, and liabilities. The usefulness of the said analysis lies
in the fact that it allows the benchmarking with the similar company or the industry
performance. The common size financial statements of the entity BCI Minerals is presented
as follows.
BCI MINERALS LIMITED
Vertical Analysis
Amount
Fiscal year ends in June. AUD in (000s) 2014 2015 2016 2017 2018
Current Assets
Cash and cash equivalents ($000s) 41% 26% 9% 29% 12%
Trade receivables ($000s) 0.33%
9.10
%
11.97
%
8.04
%
0.00
%
Other receivables ($000s) 1% 0% 0.37%
0.04
%
6.80
%
Raw materials ($000s) 1% 0% 0.06%
0.00
%
0.00
%
Work-in-progress ($000s)
Finished goods ($000s) 4% 4%
Total inventories ($000s)
Prepayments ($000s)
Derivative financial instruments ($000s) 0%
Other current assets ($000s) 0.26% 0% 0.14%
Total current assets ($000s)
Non-current assets
Receivables ($000s) 1% 5% 4% 5%
Investments in associates ($000s)
Investments in subsidiaries ($000s)
Available for sale financial assets ($000s) 0.46%
Derivative financial instruments ($000s)
Property, plant and equipment ($000s) 49% 25% 48% 36% 40%
Intangible assets and goodwill ($000s) 10% 21% 19% 22%
Deferred tax assets ($000s) 11%
Other non-current assets ($000s) 3% 13% 4% 4% 14%
Total non-current assets ($000s)
TOTAL ASSETS ($000s) 100% 100% 100% 100% 100%
Current liabilities
Trade payables ($000s) 0.16
Other payables ($000s)
Overdrafts ($000s)
Loans - secured ($000s) 0.05
Loans - unsecured ($000s) 0.01
Obligations under finance leases and hire
purchase ($000s)
Loans from related parties ($000s)
Total current interest-bearing loans and
borrowings ($000s) 0.06
Income tax payable/(refundable) ($000s) 0.03
Provisions ($000s) 0.00
Derivative financial instruments ($000s) 0.00
Other current liabilities ($000s) 0.00
Total current liabilities for continuing
operations ($000s) 0.24
Liabilities directly associated with assets
held for sale ($000s) 0.00
Total current liabilities ($000s) 0.24 0.30 0.20 0.10 0.09
Non-current liabilities
Loans - secured ($000s) 0.06
Loans - unsecured ($000s) 0.01
Obligations under finance leases and hire
purchase ($000s)
Loans from related parties ($000s)
Total non-current interest-bearing loans
and borrowings ($000s) 0.07
Derivative financial instruments ($000s)
Deferred tax liabilities ($000s) 0.04
Provisions ($000s) 0.04 0.08 0.10 0.04 0.05
Convertible redeemable preference shares
($000s)
Other non-current liabilities ($000s)
Total non-current liabilities ($000s) 0.15 0.08 0.10 0.04 0.05
TOTAL LIABILITIES ($000s)
TOTAL EQUITY ($000s) 61% 62% 70% 86% 85%
TOTAL EQUITY AND LIABILITIES 100% 100% 100% 100% 100%
BCI MINERALS LIMITED Vertical Analysis
Amount
Fiscal year ends in June. AUD in millions 2014 2015 2016 2017 2018
Revenue from continuing operations ($000s) 100% 100% 100% 100% 100%
Cost of sales ($000s) -59% -89% -91% -75% -90%
⊘ This is a preview!⊘
Do you want full access?
Subscribe today to unlock all pages.
Trusted by 1+ million students worldwide
1 out of 15
Related Documents


Your All-in-One AI-Powered Toolkit for Academic Success.
+13062052269
info@desklib.com
Available 24*7 on WhatsApp / Email
![[object Object]](/_next/static/media/star-bottom.7253800d.svg)
Unlock your academic potential
Copyright © 2020–2026 A2Z Services. All Rights Reserved. Developed and managed by ZUCOL.