Finance for Business: BHP Financial Performance Analysis Report
VerifiedAdded on 2021/02/21
|15
|3813
|93
Report
AI Summary
This report provides a comprehensive financial analysis of BHP Billiton Limited, a leading global resource company. It begins with an abstract outlining the report's purpose: to enhance understanding of financial terms and their application in investment decision-making. The introduction provides an overview of business finance and the selection of BHP Billiton as a case study. The main body includes a description of BHP's key product (Olympic Dam), followed by a detailed financial analysis using performance ratios like current ratio, quick ratio, debt-equity ratio, and interest coverage ratio, comparing BHP with Bass Metals Ltd. The report also analyzes non-current assets using both Straight Line and Unit of Production methods, presents a scenario analysis evaluating net cash inflows, and identifies recent share/bond issuance. Finally, it calculates the P/E ratio and share price movement over three years, culminating in recommendations and a conclusion based on the findings.

Finance For
Business
Business
Paraphrase This Document
Need a fresh take? Get an instant paraphrase of this document with our AI Paraphraser
ABSTRACT
Purpose of this project report is to increase the awareness regarding various financial
terms which required for the further analysis. It helps the investors to analyse and make their
future decisions in order to maximise their shareholders or clients. It includes comprehensive
analysis of the organization which is based on the financial performance and it will be evaluated
by using financial statement of the company. Basically every investment required huge research
about company and their financial performance. So financial ratios are the best way to evaluate
operational activities weather it is profitable or not in the future. In order to enhance investors
knowledge regarding share market and organizational performance then it helps in improving
client knowledge regarding their investments.
Table of Contents
ABSTRACT ....................................................................................................................................2
INTRODUCTION...........................................................................................................................1
MAIN BODY...................................................................................................................................1
1. Describe any one key product or service of the selected company.........................................1
2. Financial analysis of the company by using performance ratios.............................................2
3. Perform non-current asset analysis by using 3 years financial information............................6
4. Complete a scenario analysis with the helps of available data................................................7
5. Identify latest share or bond issuance of selected company....................................................9
6. Calculate PE ratio and share price movement from past three years.......................................9
RECOMMENDATION.................................................................................................................11
CONCLUSION..............................................................................................................................11
REFERENCES..............................................................................................................................12
⊘ This is a preview!⊘
Do you want full access?
Subscribe today to unlock all pages.
Trusted by 1+ million students worldwide
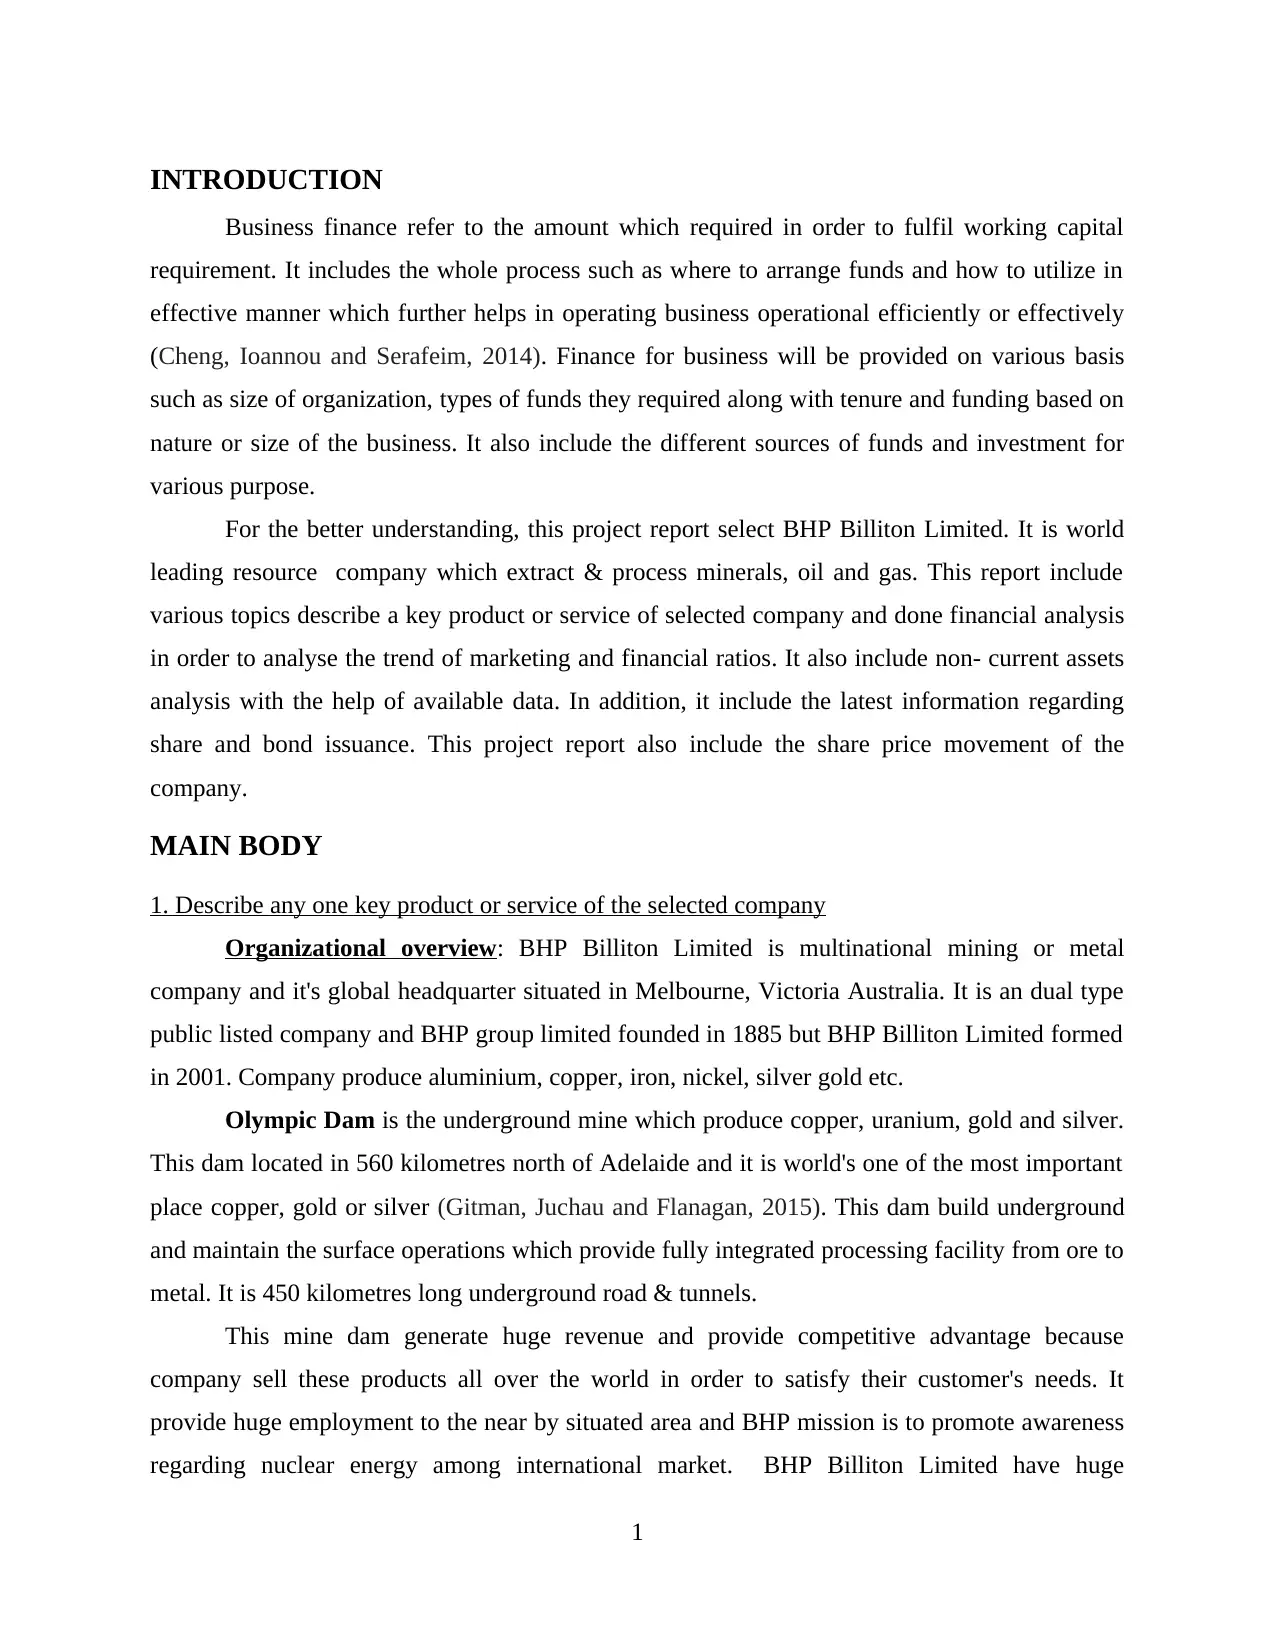
INTRODUCTION
Business finance refer to the amount which required in order to fulfil working capital
requirement. It includes the whole process such as where to arrange funds and how to utilize in
effective manner which further helps in operating business operational efficiently or effectively
(Cheng, Ioannou and Serafeim, 2014). Finance for business will be provided on various basis
such as size of organization, types of funds they required along with tenure and funding based on
nature or size of the business. It also include the different sources of funds and investment for
various purpose.
For the better understanding, this project report select BHP Billiton Limited. It is world
leading resource company which extract & process minerals, oil and gas. This report include
various topics describe a key product or service of selected company and done financial analysis
in order to analyse the trend of marketing and financial ratios. It also include non- current assets
analysis with the help of available data. In addition, it include the latest information regarding
share and bond issuance. This project report also include the share price movement of the
company.
MAIN BODY
1. Describe any one key product or service of the selected company
Organizational overview: BHP Billiton Limited is multinational mining or metal
company and it's global headquarter situated in Melbourne, Victoria Australia. It is an dual type
public listed company and BHP group limited founded in 1885 but BHP Billiton Limited formed
in 2001. Company produce aluminium, copper, iron, nickel, silver gold etc.
Olympic Dam is the underground mine which produce copper, uranium, gold and silver.
This dam located in 560 kilometres north of Adelaide and it is world's one of the most important
place copper, gold or silver (Gitman, Juchau and Flanagan, 2015). This dam build underground
and maintain the surface operations which provide fully integrated processing facility from ore to
metal. It is 450 kilometres long underground road & tunnels.
This mine dam generate huge revenue and provide competitive advantage because
company sell these products all over the world in order to satisfy their customer's needs. It
provide huge employment to the near by situated area and BHP mission is to promote awareness
regarding nuclear energy among international market. BHP Billiton Limited have huge
1
Paraphrase This Document
Need a fresh take? Get an instant paraphrase of this document with our AI Paraphraser
competitors such as Anglo American, Exxon Mobil, BP, Nippon Steel etc. So Olympic Dam
helps in achieving all the organizational goals & objectives in order to provide competitive
advantage.
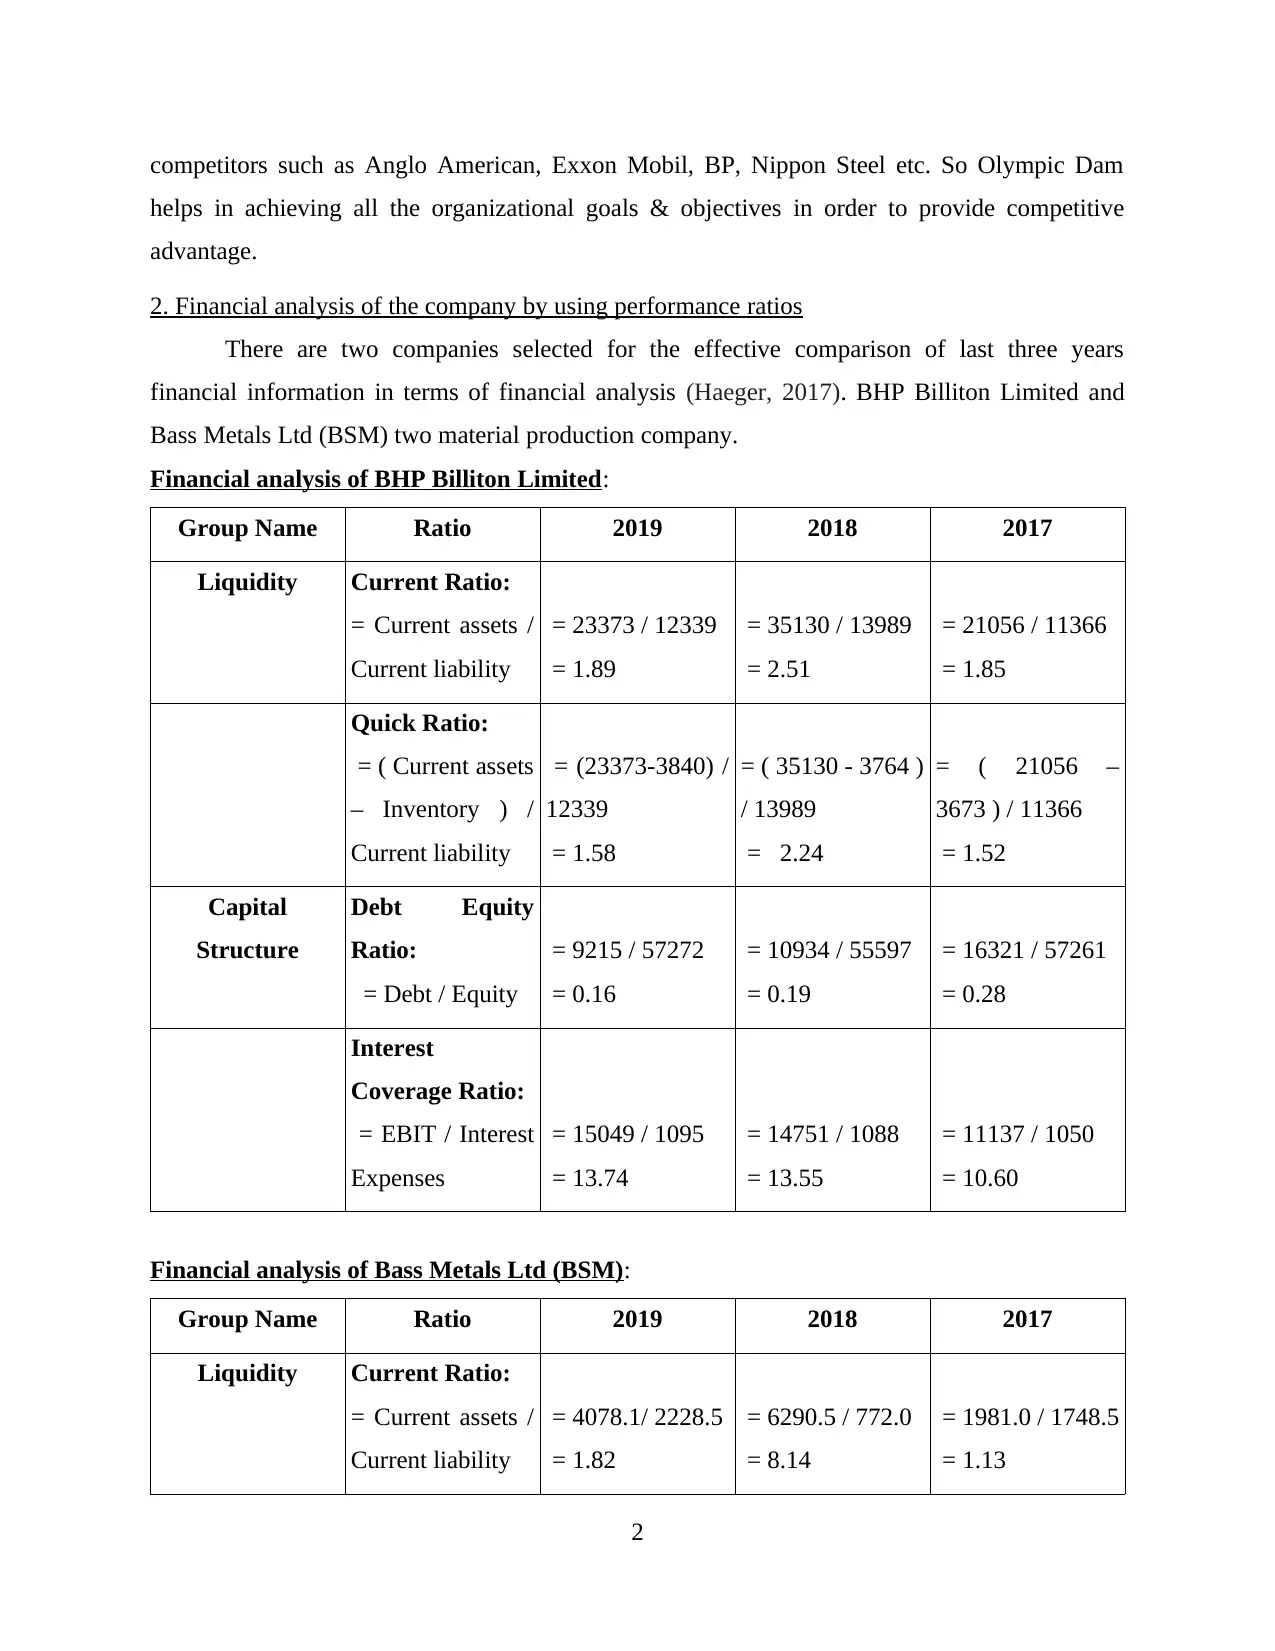
2. Financial analysis of the company by using performance ratios
There are two companies selected for the effective comparison of last three years
financial information in terms of financial analysis (Haeger, 2017). BHP Billiton Limited and
Bass Metals Ltd (BSM) two material production company.
Financial analysis of BHP Billiton Limited:
Group Name Ratio 2019 2018 2017
Liquidity Current Ratio:
= Current assets /
Current liability
= 23373 / 12339
= 1.89
= 35130 / 13989
= 2.51
= 21056 / 11366
= 1.85
Quick Ratio:
= ( Current assets
– Inventory ) /
Current liability
= (23373-3840) /
12339
= 1.58
= ( 35130 - 3764 )
/ 13989
= 2.24
= ( 21056 –
3673 ) / 11366
= 1.52
Capital
Structure
Debt Equity
Ratio:
= Debt / Equity
= 9215 / 57272
= 0.16
= 10934 / 55597
= 0.19
= 16321 / 57261
= 0.28
Interest
Coverage Ratio:
= EBIT / Interest
Expenses
= 15049 / 1095
= 13.74
= 14751 / 1088
= 13.55
= 11137 / 1050
= 10.60
Financial analysis of Bass Metals Ltd (BSM):
Group Name Ratio 2019 2018 2017
Liquidity Current Ratio:
= Current assets /
Current liability
= 4078.1/ 2228.5
= 1.82
= 6290.5 / 772.0
= 8.14
= 1981.0 / 1748.5
= 1.13
2
helps in achieving all the organizational goals & objectives in order to provide competitive
advantage.
2. Financial analysis of the company by using performance ratios
There are two companies selected for the effective comparison of last three years
financial information in terms of financial analysis (Haeger, 2017). BHP Billiton Limited and
Bass Metals Ltd (BSM) two material production company.
Financial analysis of BHP Billiton Limited:
Group Name Ratio 2019 2018 2017
Liquidity Current Ratio:
= Current assets /
Current liability
= 23373 / 12339
= 1.89
= 35130 / 13989
= 2.51
= 21056 / 11366
= 1.85
Quick Ratio:
= ( Current assets
– Inventory ) /
Current liability
= (23373-3840) /
12339
= 1.58
= ( 35130 - 3764 )
/ 13989
= 2.24
= ( 21056 –
3673 ) / 11366
= 1.52
Capital
Structure
Debt Equity
Ratio:
= Debt / Equity
= 9215 / 57272
= 0.16
= 10934 / 55597
= 0.19
= 16321 / 57261
= 0.28
Interest
Coverage Ratio:
= EBIT / Interest
Expenses
= 15049 / 1095
= 13.74
= 14751 / 1088
= 13.55
= 11137 / 1050
= 10.60
Financial analysis of Bass Metals Ltd (BSM):
Group Name Ratio 2019 2018 2017
Liquidity Current Ratio:
= Current assets /
Current liability
= 4078.1/ 2228.5
= 1.82
= 6290.5 / 772.0
= 8.14
= 1981.0 / 1748.5
= 1.13
2
Quick Ratio:
= ( Current assets
– Inventory ) /
Current liability
= (4078.1-1617.9)
/ 2228.5
= 1.10
= ( 6290.5 –
1203.6 ) / 772.0
= 6.58
= ( 1981.0 –
653.8 ) / 1748.5
= 0.75
Capital
Structure
Debt Equity
Ratio:
= Debt / Equity
= 1122.2 /
13265.3
= 0.08
= 0 / 16753.0
= 0
= 0 / 7782.6
= 0
Interest
Coverage Ratio:
= EBIT / Interest
Expenses
= (7570.0) / 15.6
= 485.25
=(4736.6) / 112.1
= 42.25
= (6255.5) / 5.7
= 1097.45
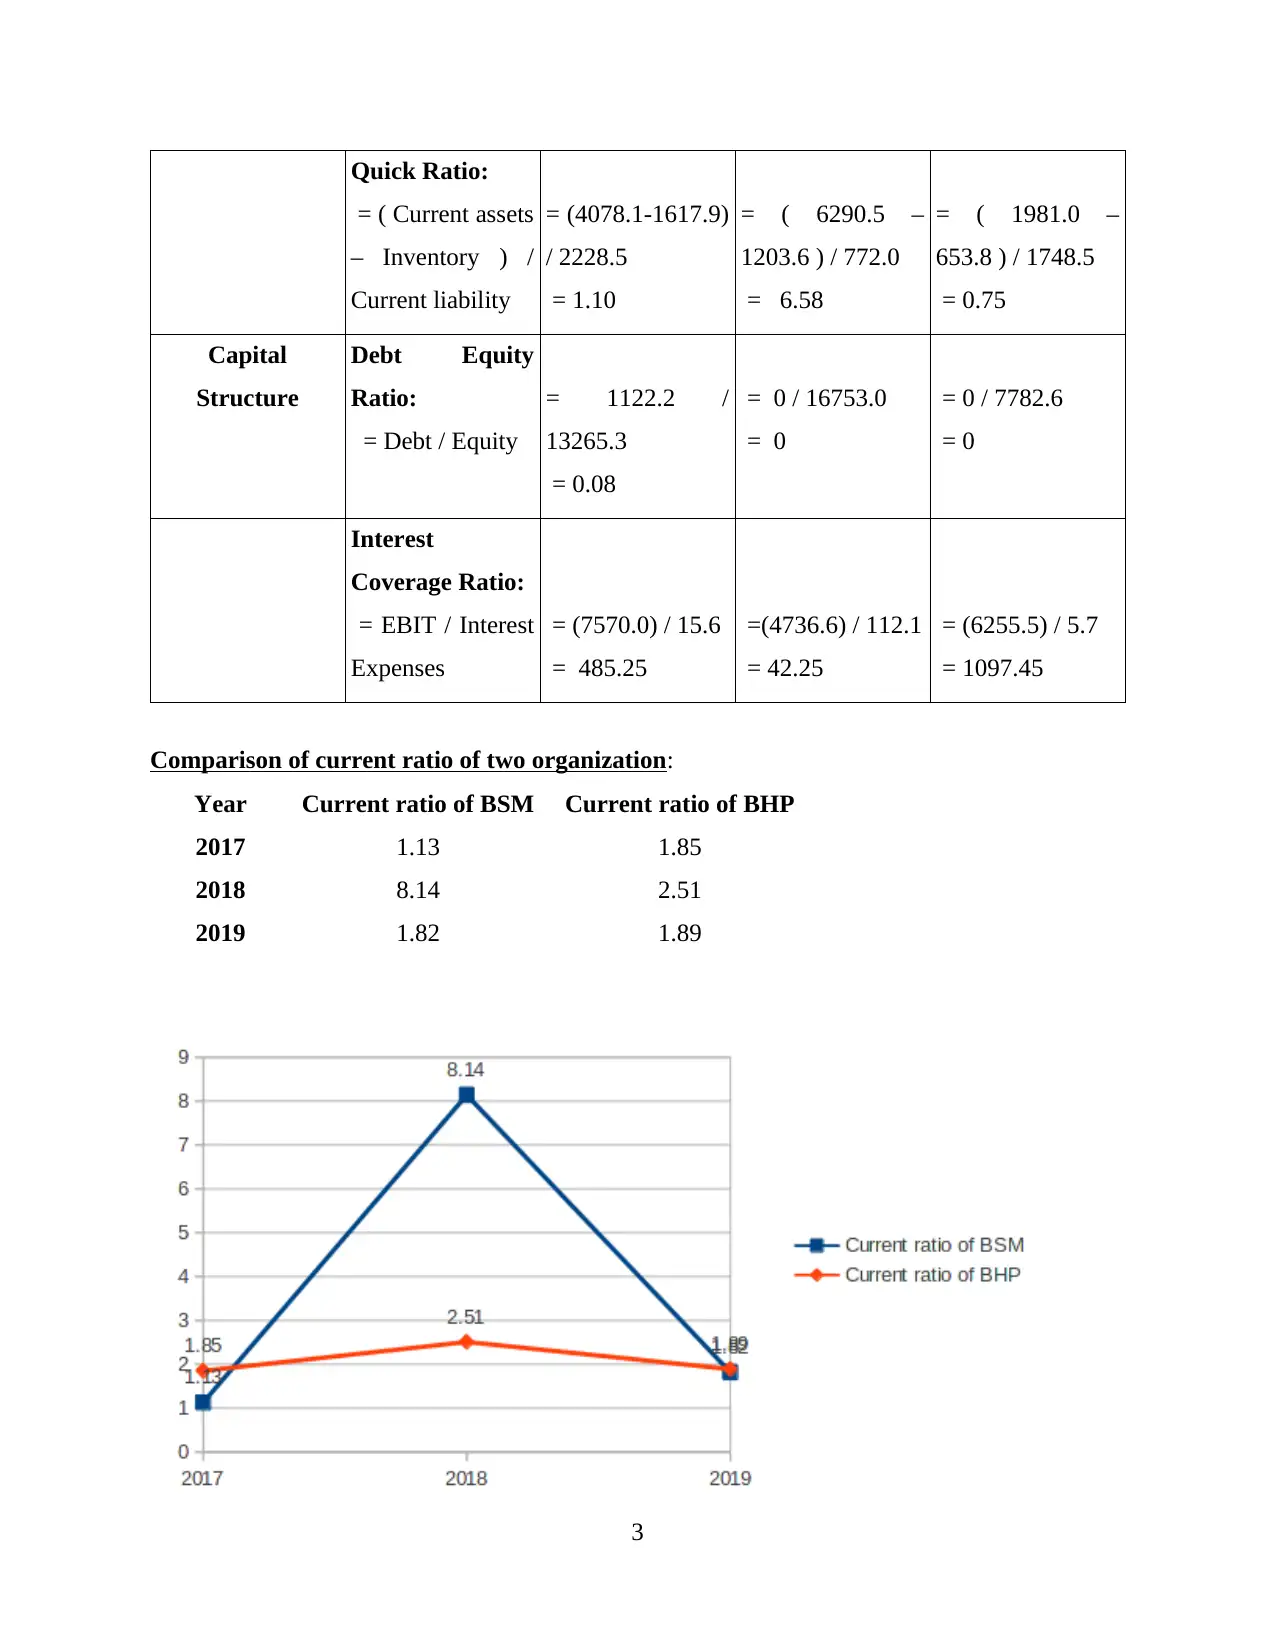
Comparison of current ratio of two organization:
Year Current ratio of BSM Current ratio of BHP
2017 1.13 1.85
2018 8.14 2.51
2019 1.82 1.89
3
= ( Current assets
– Inventory ) /
Current liability
= (4078.1-1617.9)
/ 2228.5
= 1.10
= ( 6290.5 –
1203.6 ) / 772.0
= 6.58
= ( 1981.0 –
653.8 ) / 1748.5
= 0.75
Capital
Structure
Debt Equity
Ratio:
= Debt / Equity
= 1122.2 /
13265.3
= 0.08
= 0 / 16753.0
= 0
= 0 / 7782.6
= 0
Interest
Coverage Ratio:
= EBIT / Interest
Expenses
= (7570.0) / 15.6
= 485.25
=(4736.6) / 112.1
= 42.25
= (6255.5) / 5.7
= 1097.45
Comparison of current ratio of two organization:
Year Current ratio of BSM Current ratio of BHP
2017 1.13 1.85
2018 8.14 2.51
2019 1.82 1.89
3
⊘ This is a preview!⊘
Do you want full access?
Subscribe today to unlock all pages.
Trusted by 1+ million students worldwide
Current ratio: It is a liquidity ratio which helps in measuring business ability in order to
pay their short term obligation and it will be considering under one year. Idea ratio is 2:1 which
means company have enough assets to pay their liabilities (Hirshleifer, 2015). Below mention
justification define that which organization is better in terms of current ration.
Justification: Above mention table represent that current ration of last three years of both
organization has huge different. It clearly represented in the line chart where blue line is for
BSM or orange line indicate BHP. Current ratio of BSM is 1.13, 8.14 & 1.82 for the year of
2017, 2018 or 2019 respectively. In context of BHP, ratio is 1.85, 2.51 or 1.89 for 2017, 2018
and 2019 respectively. BHP has more stable ratio which is beneficial for the company because
more than ideal ratio indicate that either business has more inventory or debtors which increase
the figures (Jochimsen and Thomasius, 2014). Management need to ensure that they have to
maintain their current assets as well as current liability.
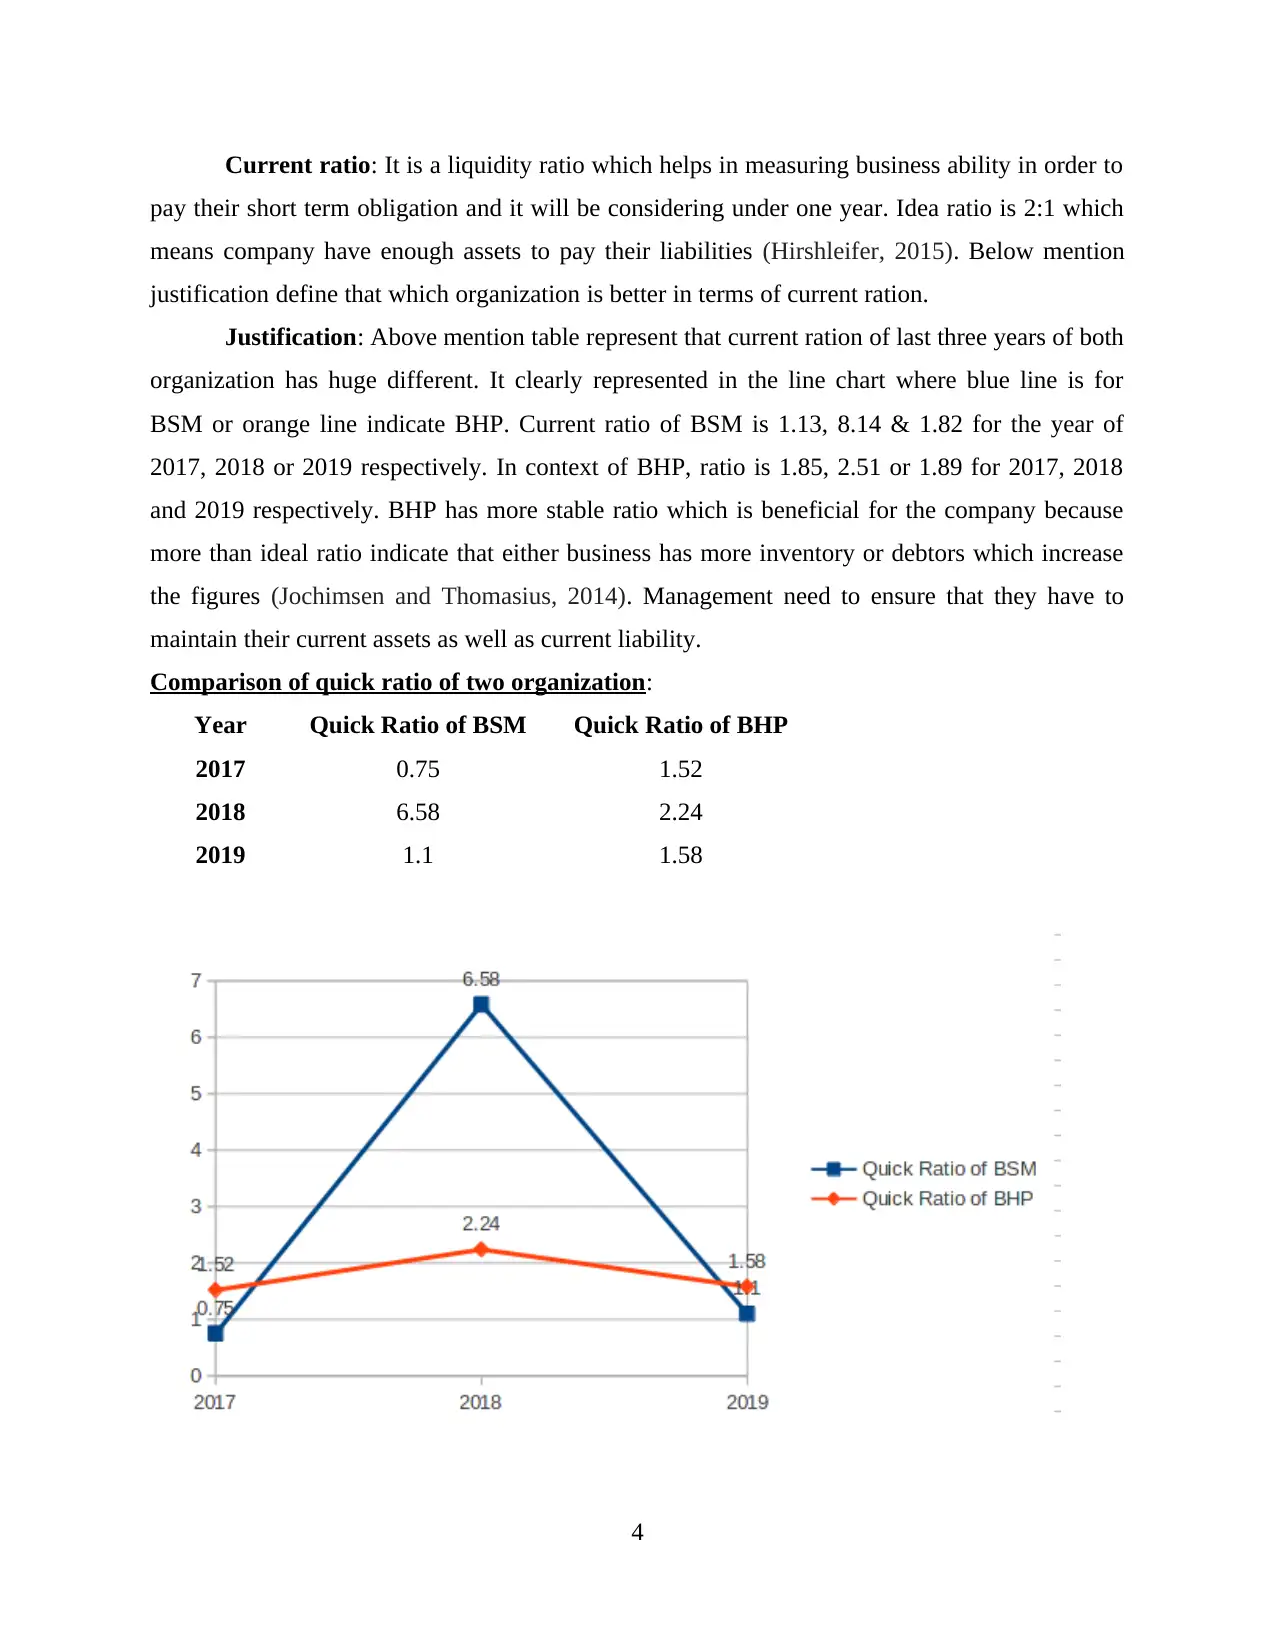
Comparison of quick ratio of two organization:
Year Quick Ratio of BSM Quick Ratio of BHP
2017 0.75 1.52
2018 6.58 2.24
2019 1.1 1.58
4
pay their short term obligation and it will be considering under one year. Idea ratio is 2:1 which
means company have enough assets to pay their liabilities (Hirshleifer, 2015). Below mention
justification define that which organization is better in terms of current ration.
Justification: Above mention table represent that current ration of last three years of both
organization has huge different. It clearly represented in the line chart where blue line is for
BSM or orange line indicate BHP. Current ratio of BSM is 1.13, 8.14 & 1.82 for the year of
2017, 2018 or 2019 respectively. In context of BHP, ratio is 1.85, 2.51 or 1.89 for 2017, 2018
and 2019 respectively. BHP has more stable ratio which is beneficial for the company because
more than ideal ratio indicate that either business has more inventory or debtors which increase
the figures (Jochimsen and Thomasius, 2014). Management need to ensure that they have to
maintain their current assets as well as current liability.
Comparison of quick ratio of two organization:
Year Quick Ratio of BSM Quick Ratio of BHP
2017 0.75 1.52
2018 6.58 2.24
2019 1.1 1.58
4
Paraphrase This Document
Need a fresh take? Get an instant paraphrase of this document with our AI Paraphraser
Quick ratio: It is also comes under liquidity ratio which quickly converted into cash
because it exclude the inventory at the time of calculating ratios. Ideal ratio is 1:1 where
management need to balance their assets & liability in this proportion (Jordà, Schularick and
Taylor, 2016). Below mention justification helps the clients to understand these figures.
Justification: Above mention table or line chart represent the difference between two
organization on the basis of liquidity. Quick ratio of BSM is 0.75, 6.58 or 1.10 for the year of
2017, 2018 or 2019 respectively. In context of BHP, ratios are 1.52, 2.24 or 1.58 for 2017, 2018
and 2019 respectively. In the 2018, ratio of BSM is very high which means company have more
than required current assets. All over three years, BHP is stable which is beneficial for the
inventors so investment consultancy company recommend BHP organization for their client.
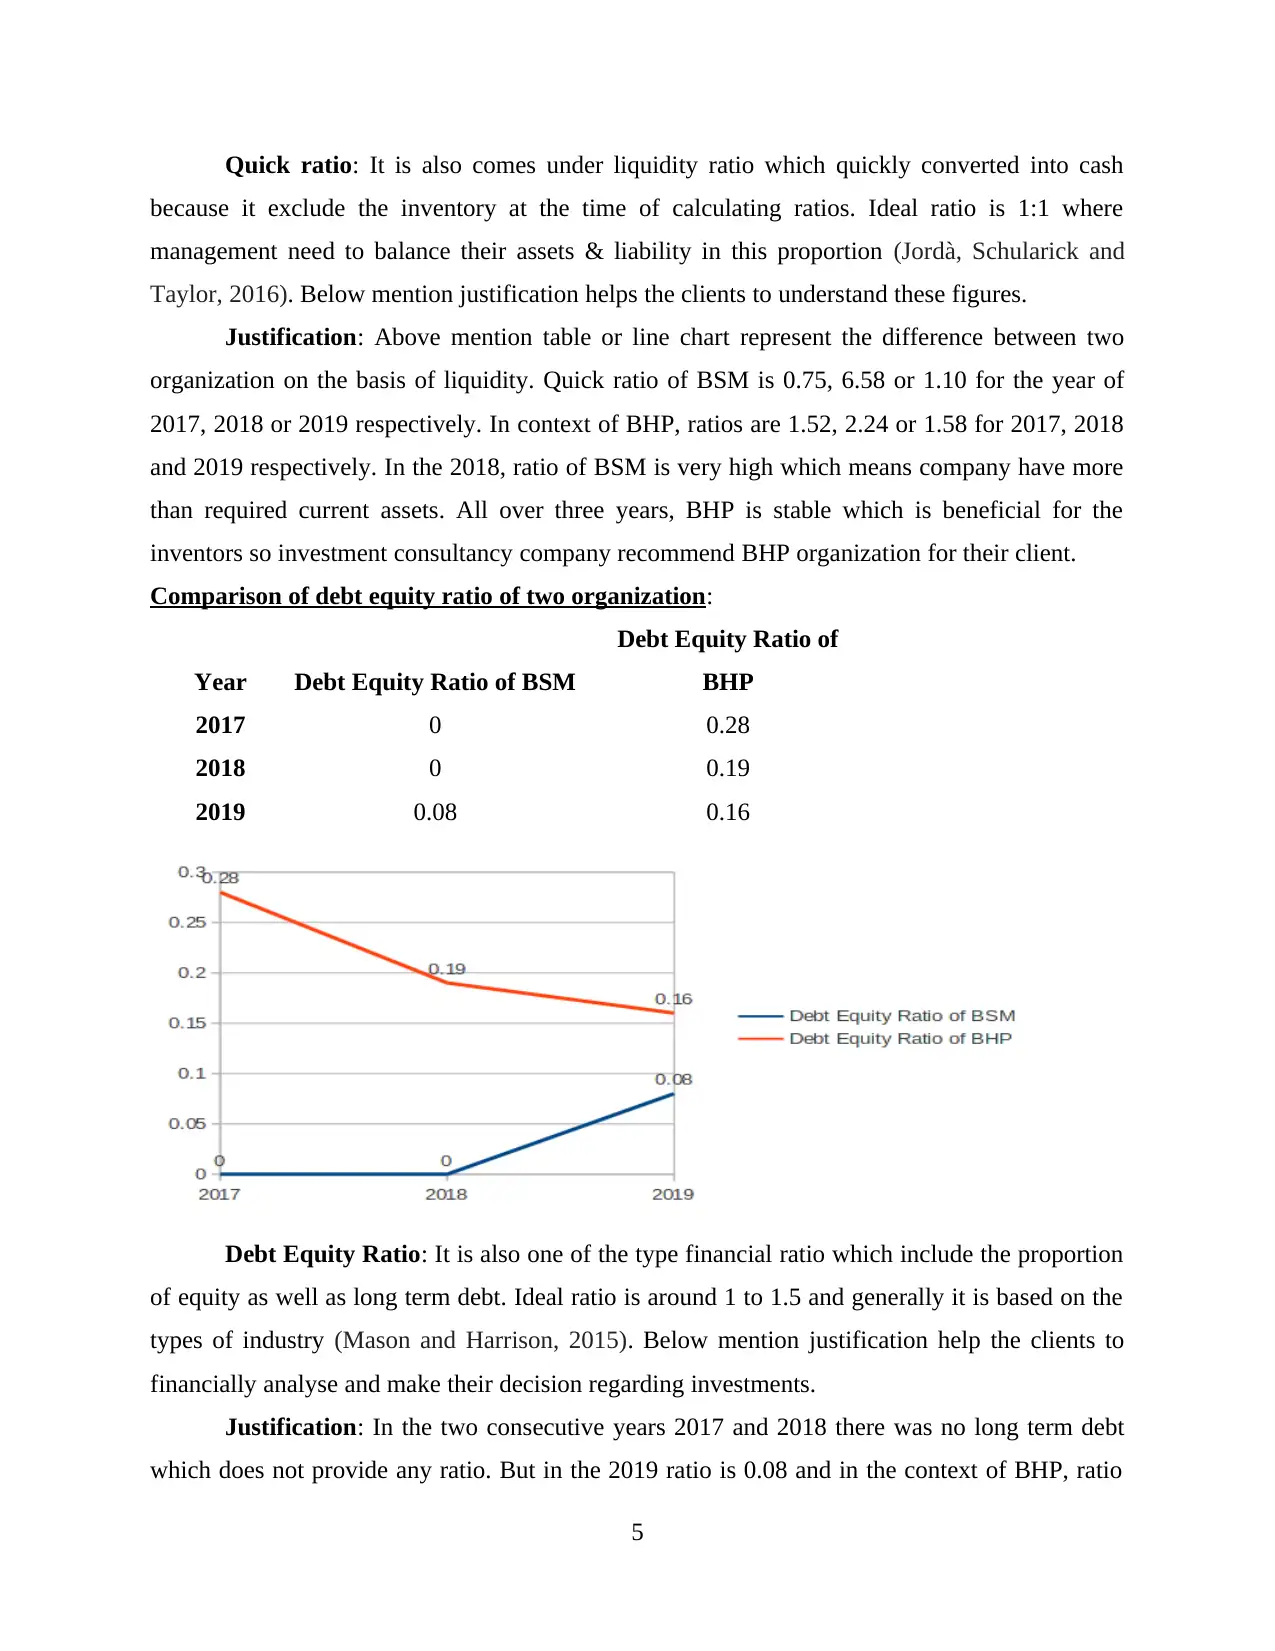
Comparison of debt equity ratio of two organization:
Year Debt Equity Ratio of BSM
Debt Equity Ratio of
BHP
2017 0 0.28
2018 0 0.19
2019 0.08 0.16
Debt Equity Ratio: It is also one of the type financial ratio which include the proportion
of equity as well as long term debt. Ideal ratio is around 1 to 1.5 and generally it is based on the
types of industry (Mason and Harrison, 2015). Below mention justification help the clients to
financially analyse and make their decision regarding investments.
Justification: In the two consecutive years 2017 and 2018 there was no long term debt
which does not provide any ratio. But in the 2019 ratio is 0.08 and in the context of BHP, ratio
5
because it exclude the inventory at the time of calculating ratios. Ideal ratio is 1:1 where
management need to balance their assets & liability in this proportion (Jordà, Schularick and
Taylor, 2016). Below mention justification helps the clients to understand these figures.
Justification: Above mention table or line chart represent the difference between two
organization on the basis of liquidity. Quick ratio of BSM is 0.75, 6.58 or 1.10 for the year of
2017, 2018 or 2019 respectively. In context of BHP, ratios are 1.52, 2.24 or 1.58 for 2017, 2018
and 2019 respectively. In the 2018, ratio of BSM is very high which means company have more
than required current assets. All over three years, BHP is stable which is beneficial for the
inventors so investment consultancy company recommend BHP organization for their client.
Comparison of debt equity ratio of two organization:
Year Debt Equity Ratio of BSM
Debt Equity Ratio of
BHP
2017 0 0.28
2018 0 0.19
2019 0.08 0.16
Debt Equity Ratio: It is also one of the type financial ratio which include the proportion
of equity as well as long term debt. Ideal ratio is around 1 to 1.5 and generally it is based on the
types of industry (Mason and Harrison, 2015). Below mention justification help the clients to
financially analyse and make their decision regarding investments.
Justification: In the two consecutive years 2017 and 2018 there was no long term debt
which does not provide any ratio. But in the 2019 ratio is 0.08 and in the context of BHP, ratio
5
was 0.28, 0.19 or 0.16 respectively. BHP company is better than BSM because they maintain
their debt in comparison to the equity. Line chart shows that in the upcoming years debt equity of
BSM reduce and BHP will increase.
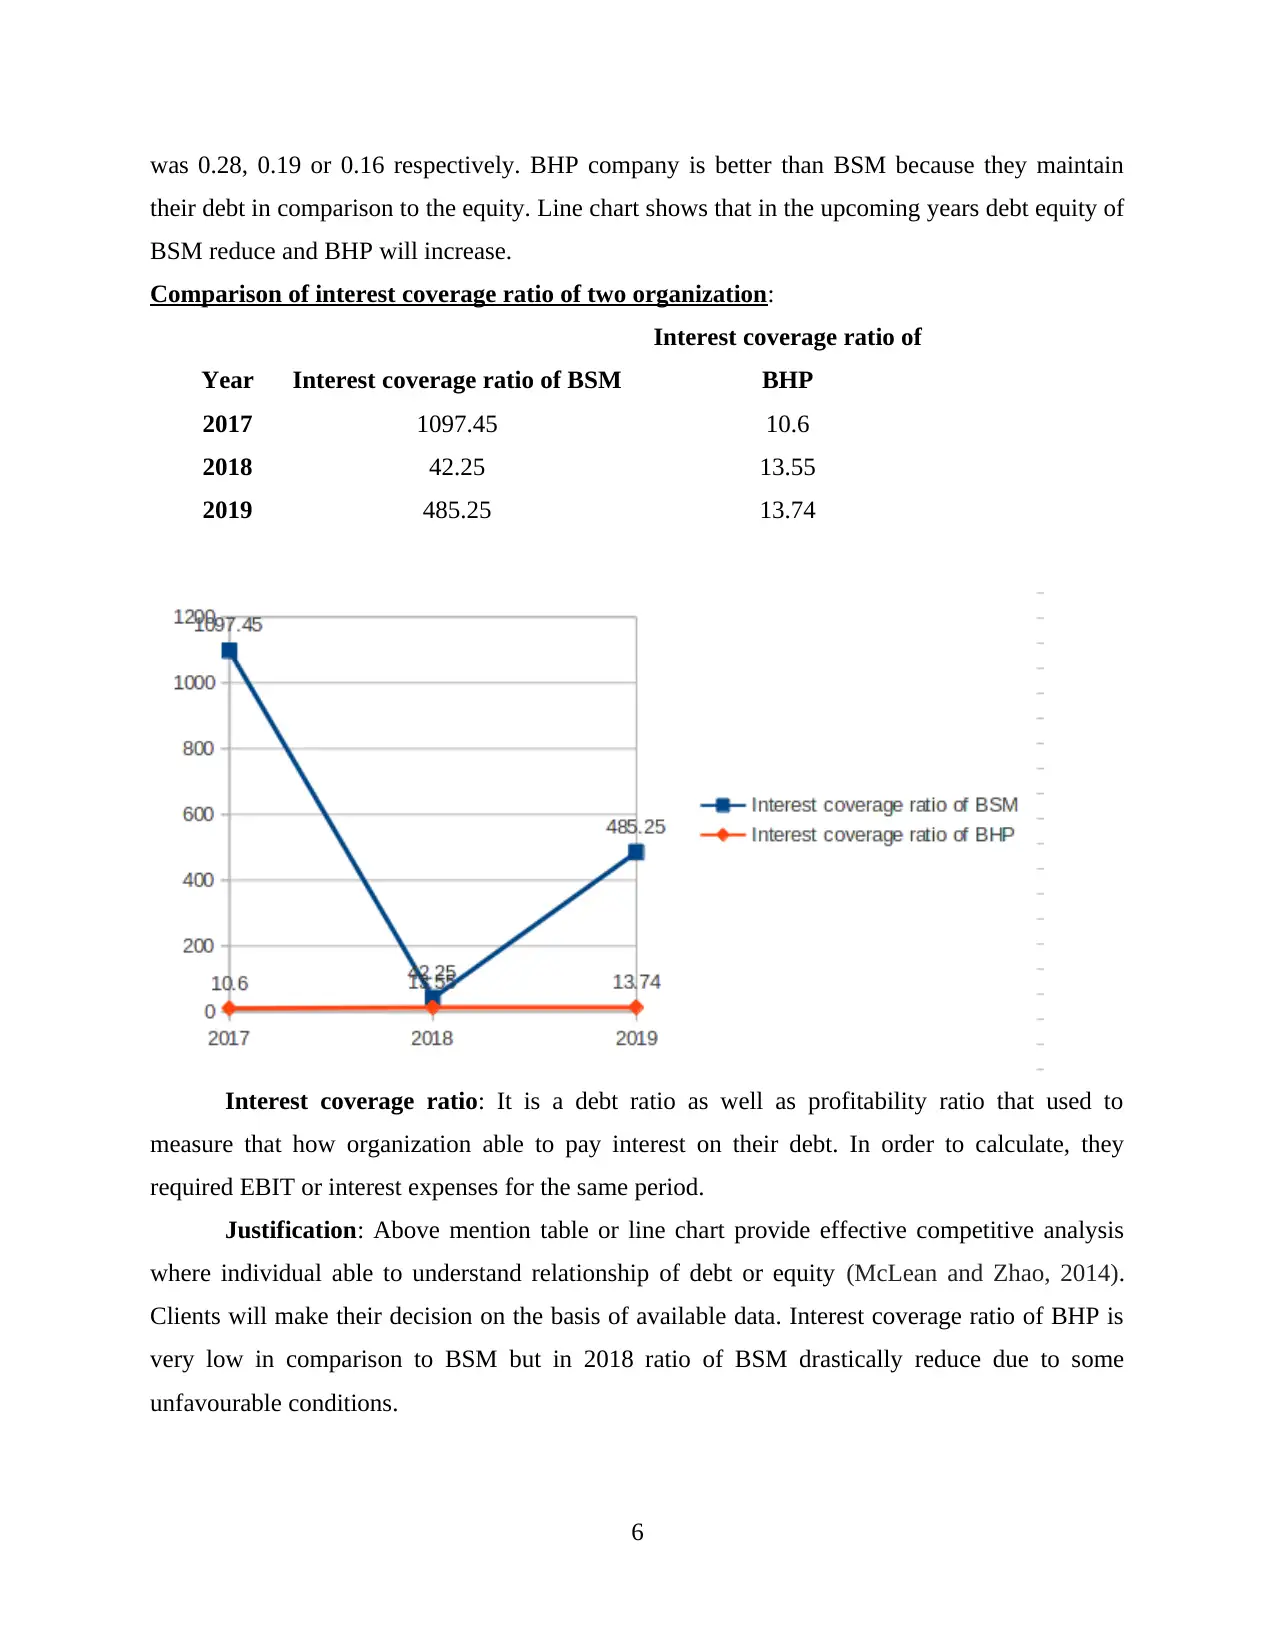
Comparison of interest coverage ratio of two organization:
Year Interest coverage ratio of BSM
Interest coverage ratio of
BHP
2017 1097.45 10.6
2018 42.25 13.55
2019 485.25 13.74
Interest coverage ratio: It is a debt ratio as well as profitability ratio that used to
measure that how organization able to pay interest on their debt. In order to calculate, they
required EBIT or interest expenses for the same period.
Justification: Above mention table or line chart provide effective competitive analysis
where individual able to understand relationship of debt or equity (McLean and Zhao, 2014).
Clients will make their decision on the basis of available data. Interest coverage ratio of BHP is
very low in comparison to BSM but in 2018 ratio of BSM drastically reduce due to some
unfavourable conditions.
6
their debt in comparison to the equity. Line chart shows that in the upcoming years debt equity of
BSM reduce and BHP will increase.
Comparison of interest coverage ratio of two organization:
Year Interest coverage ratio of BSM
Interest coverage ratio of
BHP
2017 1097.45 10.6
2018 42.25 13.55
2019 485.25 13.74
Interest coverage ratio: It is a debt ratio as well as profitability ratio that used to
measure that how organization able to pay interest on their debt. In order to calculate, they
required EBIT or interest expenses for the same period.
Justification: Above mention table or line chart provide effective competitive analysis
where individual able to understand relationship of debt or equity (McLean and Zhao, 2014).
Clients will make their decision on the basis of available data. Interest coverage ratio of BHP is
very low in comparison to BSM but in 2018 ratio of BSM drastically reduce due to some
unfavourable conditions.
6
⊘ This is a preview!⊘
Do you want full access?
Subscribe today to unlock all pages.
Trusted by 1+ million students worldwide
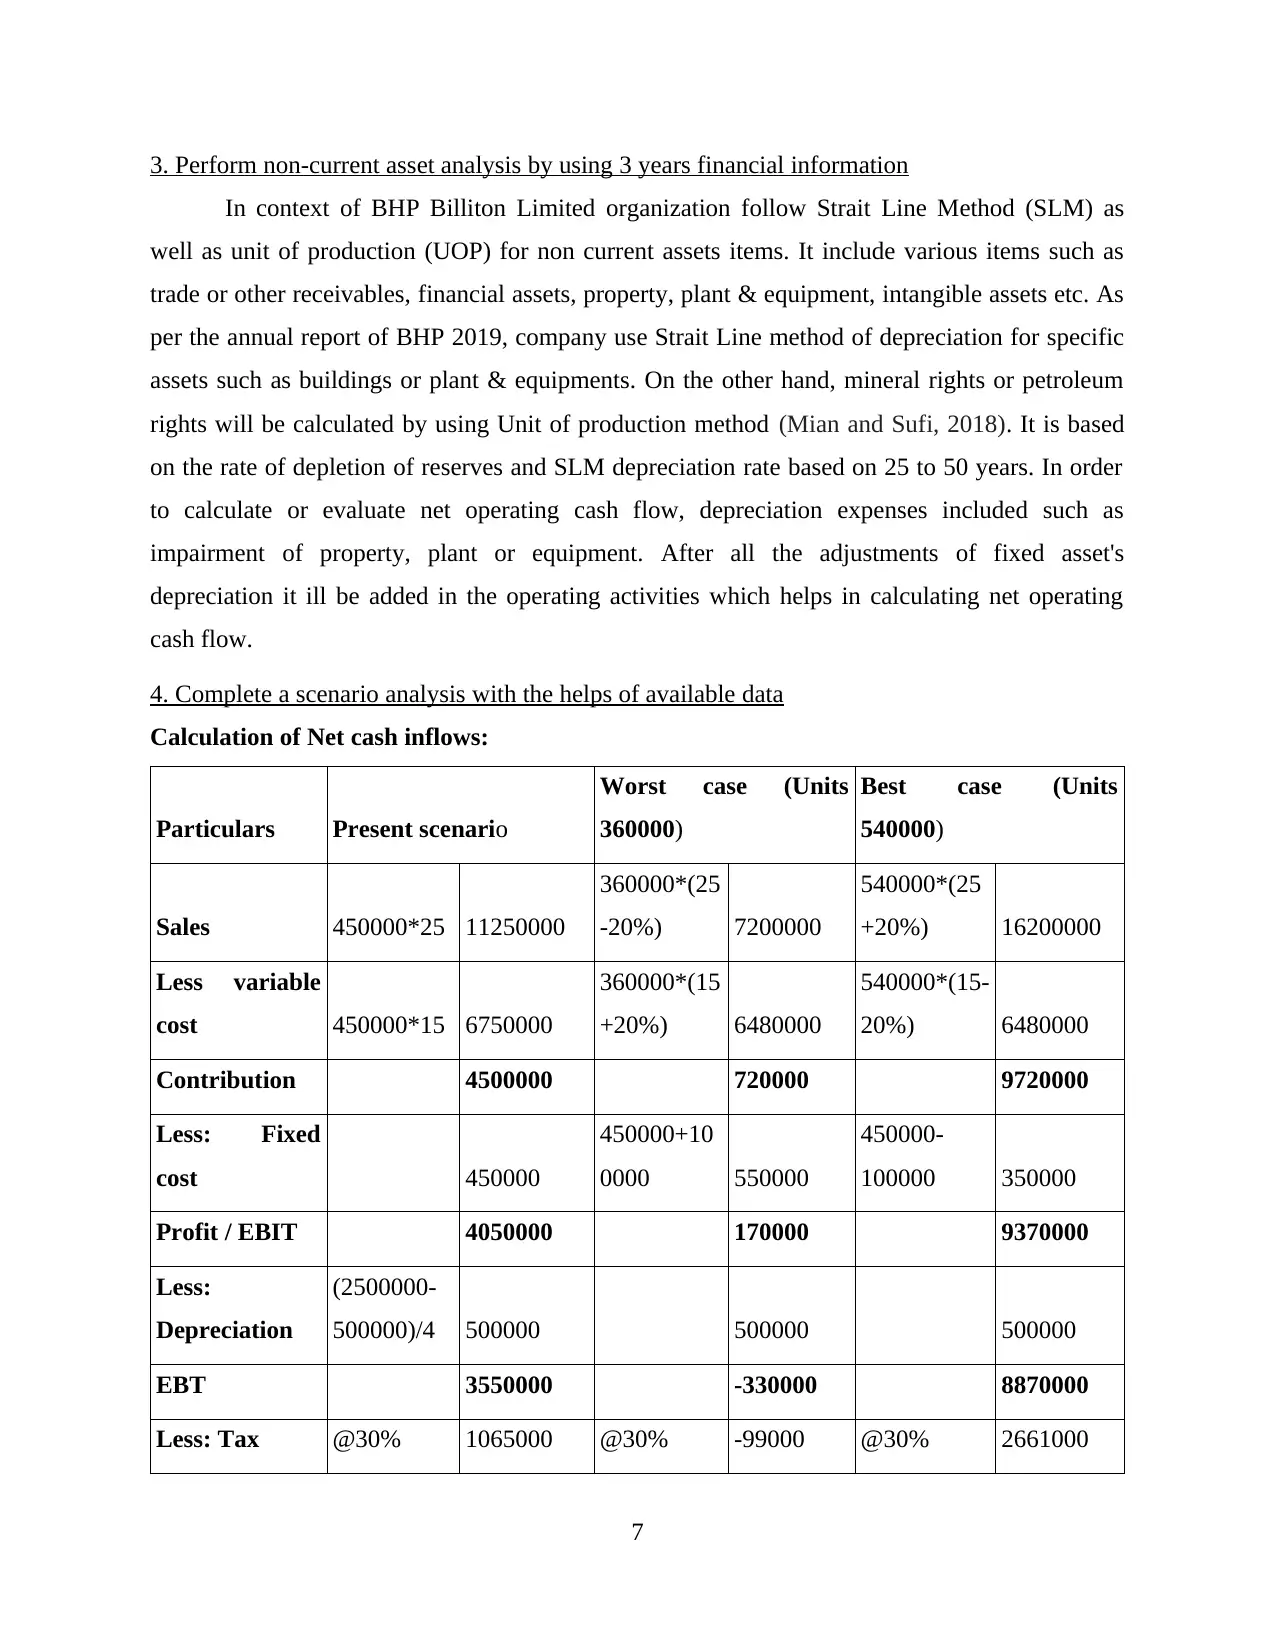
3. Perform non-current asset analysis by using 3 years financial information
In context of BHP Billiton Limited organization follow Strait Line Method (SLM) as
well as unit of production (UOP) for non current assets items. It include various items such as
trade or other receivables, financial assets, property, plant & equipment, intangible assets etc. As
per the annual report of BHP 2019, company use Strait Line method of depreciation for specific
assets such as buildings or plant & equipments. On the other hand, mineral rights or petroleum
rights will be calculated by using Unit of production method (Mian and Sufi, 2018). It is based
on the rate of depletion of reserves and SLM depreciation rate based on 25 to 50 years. In order
to calculate or evaluate net operating cash flow, depreciation expenses included such as
impairment of property, plant or equipment. After all the adjustments of fixed asset's
depreciation it ill be added in the operating activities which helps in calculating net operating
cash flow.
4. Complete a scenario analysis with the helps of available data
Calculation of Net cash inflows:
Particulars Present scenario
Worst case (Units
360000)
Best case (Units
540000)
Sales 450000*25 11250000
360000*(25
-20%) 7200000
540000*(25
+20%) 16200000
Less variable
cost 450000*15 6750000
360000*(15
+20%) 6480000
540000*(15-
20%) 6480000
Contribution 4500000 720000 9720000
Less: Fixed
cost 450000
450000+10
0000 550000
450000-
100000 350000
Profit / EBIT 4050000 170000 9370000
Less:
Depreciation
(2500000-
500000)/4 500000 500000 500000
EBT 3550000 -330000 8870000
Less: Tax @30% 1065000 @30% -99000 @30% 2661000
7
Paraphrase This Document
Need a fresh take? Get an instant paraphrase of this document with our AI Paraphraser
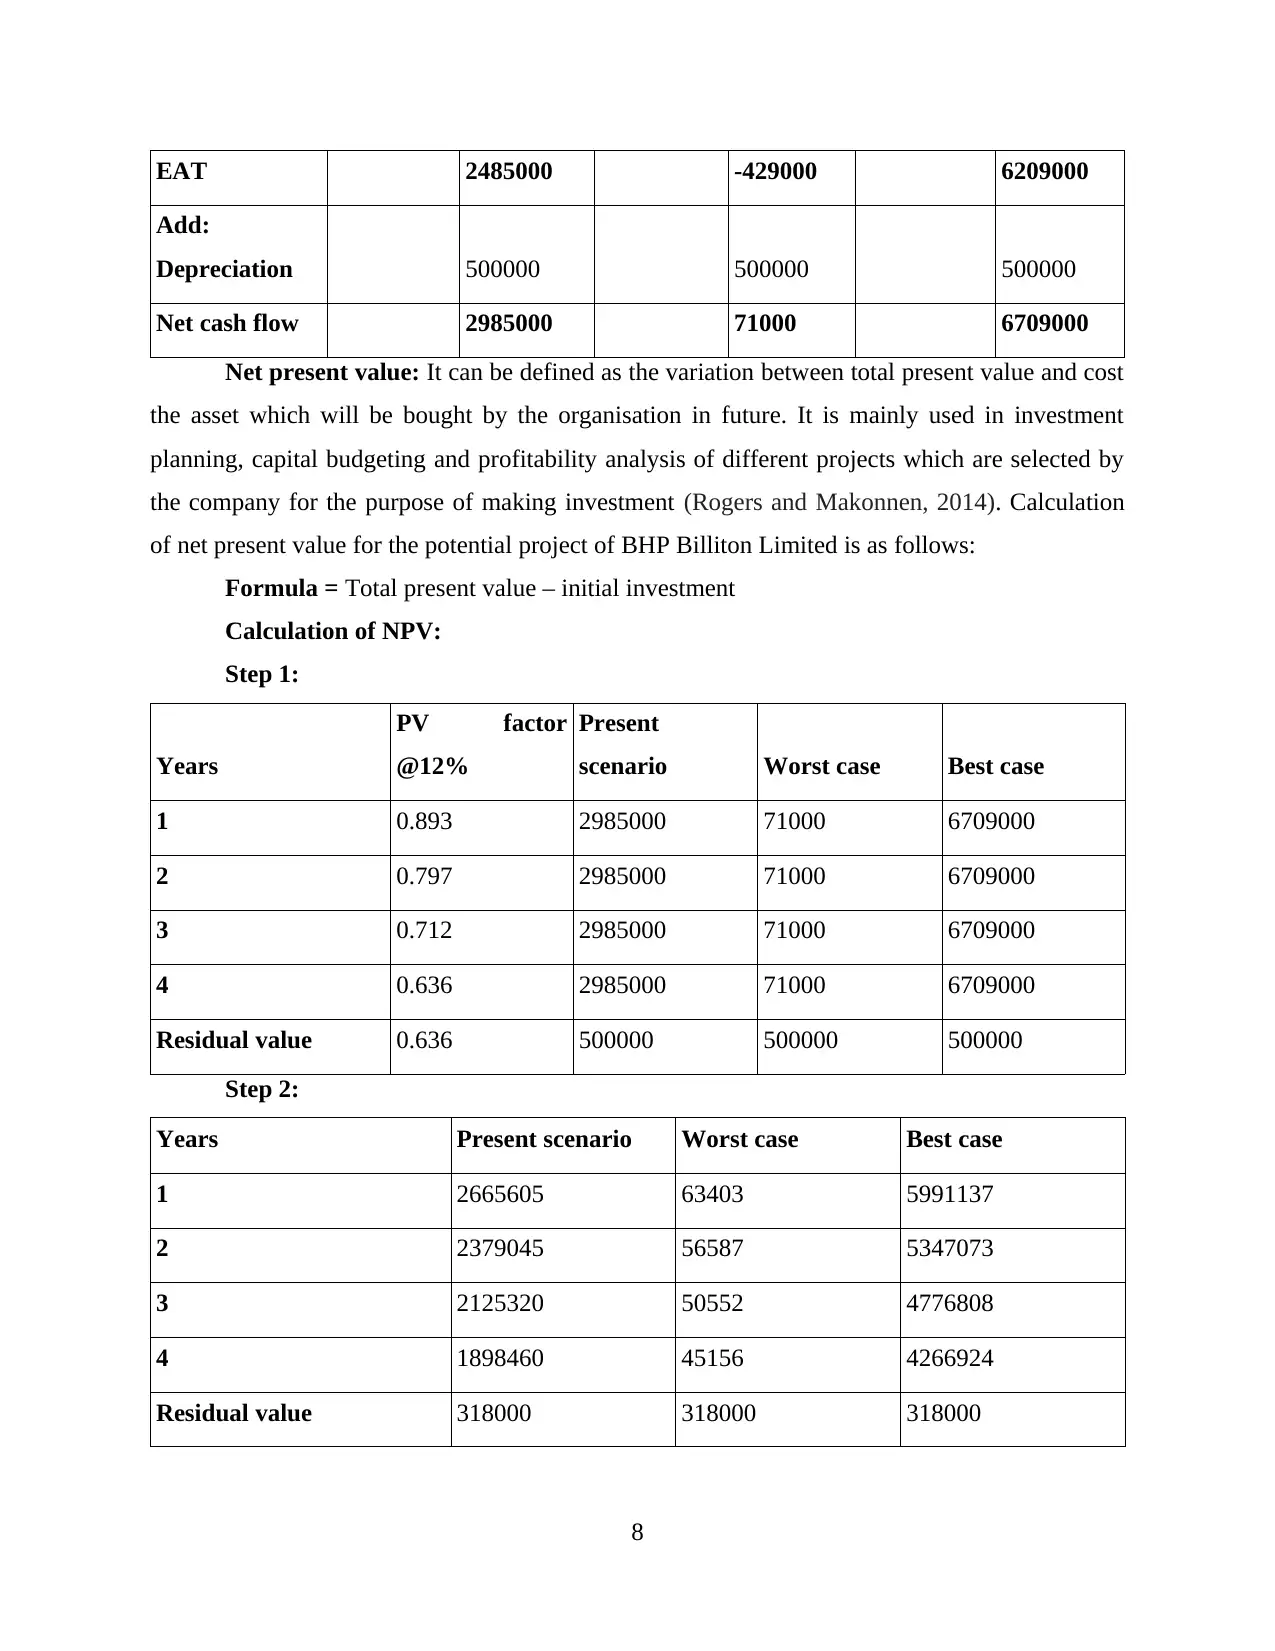
EAT 2485000 -429000 6209000
Add:
Depreciation 500000 500000 500000
Net cash flow 2985000 71000 6709000
Net present value: It can be defined as the variation between total present value and cost
the asset which will be bought by the organisation in future. It is mainly used in investment
planning, capital budgeting and profitability analysis of different projects which are selected by
the company for the purpose of making investment (Rogers and Makonnen, 2014). Calculation
of net present value for the potential project of BHP Billiton Limited is as follows:
Formula = Total present value – initial investment
Calculation of NPV:
Step 1:
Years
PV factor
@12%
Present
scenario Worst case Best case
1 0.893 2985000 71000 6709000
2 0.797 2985000 71000 6709000
3 0.712 2985000 71000 6709000
4 0.636 2985000 71000 6709000
Residual value 0.636 500000 500000 500000
Step 2:
Years Present scenario Worst case Best case
1 2665605 63403 5991137
2 2379045 56587 5347073
3 2125320 50552 4776808
4 1898460 45156 4266924
Residual value 318000 318000 318000
8
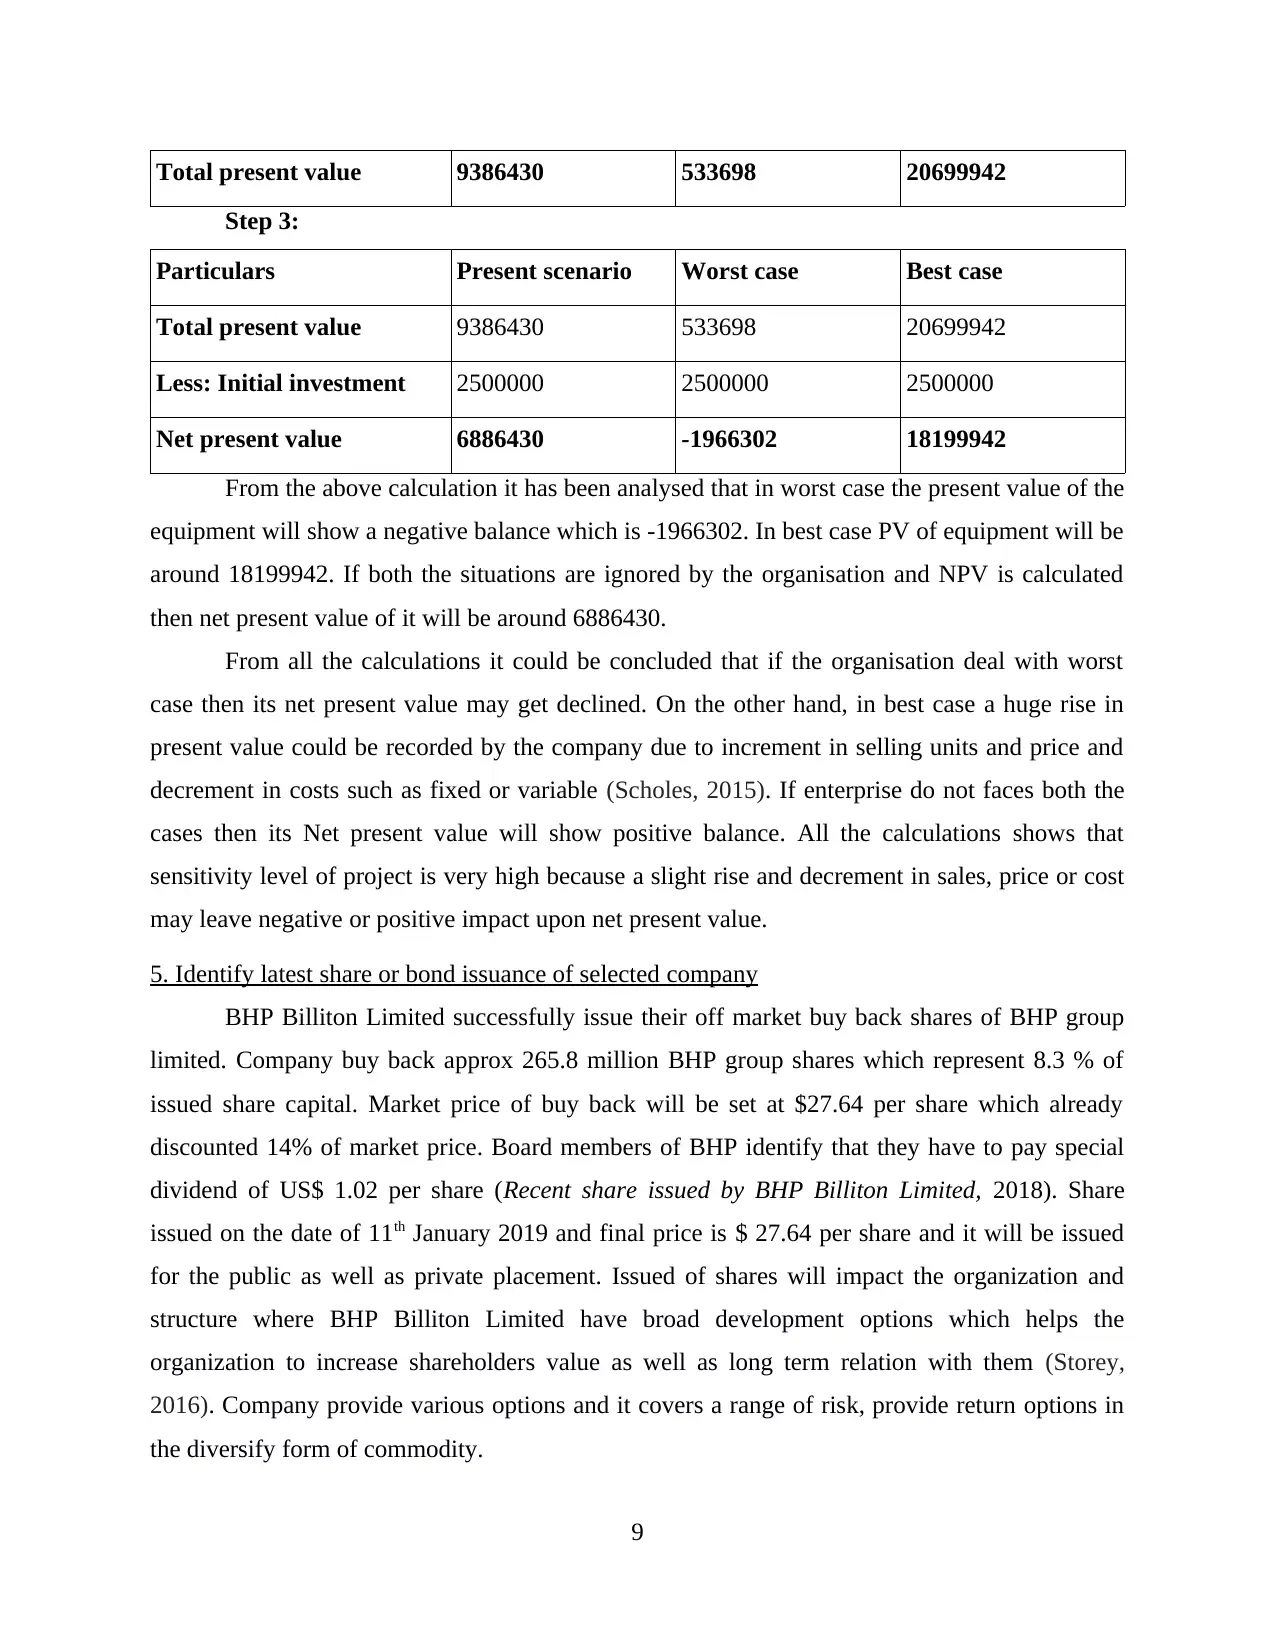
Total present value 9386430 533698 20699942
Step 3:
Particulars Present scenario Worst case Best case
Total present value 9386430 533698 20699942
Less: Initial investment 2500000 2500000 2500000
Net present value 6886430 -1966302 18199942
From the above calculation it has been analysed that in worst case the present value of the
equipment will show a negative balance which is -1966302. In best case PV of equipment will be
around 18199942. If both the situations are ignored by the organisation and NPV is calculated
then net present value of it will be around 6886430.
From all the calculations it could be concluded that if the organisation deal with worst
case then its net present value may get declined. On the other hand, in best case a huge rise in
present value could be recorded by the company due to increment in selling units and price and
decrement in costs such as fixed or variable (Scholes, 2015). If enterprise do not faces both the
cases then its Net present value will show positive balance. All the calculations shows that
sensitivity level of project is very high because a slight rise and decrement in sales, price or cost
may leave negative or positive impact upon net present value.
5. Identify latest share or bond issuance of selected company
BHP Billiton Limited successfully issue their off market buy back shares of BHP group
limited. Company buy back approx 265.8 million BHP group shares which represent 8.3 % of
issued share capital. Market price of buy back will be set at $27.64 per share which already
discounted 14% of market price. Board members of BHP identify that they have to pay special
dividend of US$ 1.02 per share (Recent share issued by BHP Billiton Limited, 2018). Share
issued on the date of 11th January 2019 and final price is $ 27.64 per share and it will be issued
for the public as well as private placement. Issued of shares will impact the organization and
structure where BHP Billiton Limited have broad development options which helps the
organization to increase shareholders value as well as long term relation with them (Storey,
2016). Company provide various options and it covers a range of risk, provide return options in
the diversify form of commodity.
9
⊘ This is a preview!⊘
Do you want full access?
Subscribe today to unlock all pages.
Trusted by 1+ million students worldwide
1 out of 15
Related Documents


Your All-in-One AI-Powered Toolkit for Academic Success.
+13062052269
info@desklib.com
Available 24*7 on WhatsApp / Email
![[object Object]](/_next/static/media/star-bottom.7253800d.svg)
Unlock your academic potential
Copyright © 2020–2026 A2Z Services. All Rights Reserved. Developed and managed by ZUCOL.