FIN600: BHP Financial Analysis Report - Financial Statement Analysis
VerifiedAdded on 2023/03/17
|24
|5171
|96
Report
AI Summary
This document presents a comprehensive financial analysis of BHP, a global resources company. It begins with an introduction to BHP's background and business operations, including its diverse commodity segments (copper, iron ore, coal, and petroleum). The report then delves into a detailed company analysis, employing horizontal and vertical analysis of BHP's financial statements to assess its performance over the years 2017 and 2018. The analysis covers revenue, cost of revenue, operating expenses, and net income, highlighting key changes and trends. Furthermore, the report conducts a thorough ratio analysis, examining profitability, efficiency, liquidity, and gearing ratios to evaluate BHP's financial health and operational effectiveness. The findings reveal mixed movements in profitability ratios, with improvements in core return and market ratios, alongside positive trends in efficiency, liquidity, and debt ratios. The analysis also addresses the company's growth prospects, market position, and risk factors, including commodity price volatility and regulatory challenges. The report concludes with investment recommendations and an overall assessment of BHP's financial performance, supported by appendices containing detailed calculations.

BHP
FIN600 TX YYYY
NAME: STUDENT ID:
FIN600 TX YYYY
NAME: STUDENT ID:
Paraphrase This Document
Need a fresh take? Get an instant paraphrase of this document with our AI Paraphraser
Student name – ID FIN600 TX YYYY
Assignment – Company
Executive Summary
This document provides a comprehensive financial analysis report on BHP. The report performs
horizontal and vertical analysis of BHP’s financial statements. The document found that firms core
operations are improving as the operating margins are improving and BHP’s balance-sheet has
become more liquid. The ratio analysis is carried out using profitability ratios, efficiency ratios,
liquidity ratios and gearing ratios. The movement of the profitability ratio is mixed but its core
return and market ratios are improving. Also the efficiency, liquidity and debt ratios moved in a
positive direction in 2018 as compared to previous year. The calculations can be identified in the
appendices. The report identifies that BHP has good growth prospects and it recommends investing
in the company as the business of the company is progressing in right direction although there are
some concerns regarding decreased overall net profits in 2018 but this is due to one-time losses
from discontinued operations that should not affect the company’s future performance. The
company’s diverse product portfolio and its market position provide a unique advantage and it also
shields BHP to some extent against the commodity price risk and changing regulations.
1
Student name – ID FIN600 TX YYYY
Assignment – Company
Contents
1 Introduction...................................................................................................................................3
1.1 Background and Business........................................................................................................3
2 Company Analysis........................................................................................................................5
2.1 Financial statements, Current Financial performance, economic outlook................................5
2.1.1 Horizontal Analysis:....................................................................................................................5
2.1.2 Vertical analysis.........................................................................................................................10
3 Ratio Analysis.............................................................................................................................14
3.1 Profitability and Market ratios...............................................................................................14
3.2 Efficiency ratios......................................................................................................................16
3.3 Liquidity ratios.......................................................................................................................16
3.4 Gearing ratios.........................................................................................................................17
4 Recommendations and overall assessment.................................................................................19
5 References/Bibliography.............................................................................................................22
Appendices – attached Excel Spreadsheet.........................................................................................23
2
⊘ This is a preview!⊘
Do you want full access?
Subscribe today to unlock all pages.
Trusted by 1+ million students worldwide
Student name – ID FIN600 TX YYYY
Assignment – Company
1 Introduction
1.1 Background and Business
BHP Group earlier known as BHP Billiton is an Australian global resources company. The
company was incorporated in 1885 with its headquarters in Melbourne, Australia. BHP Billiton was
formed in 2001 as a result of merger between Australian Broken Hill Proprietary Company and the
Anglo-Dutch Billiton to form BHP Billiton (BHP, n.d.).
BHP deals with the extraction and processing of huge number of commodities. The company
business is divided into various segments namely copper, iron ore, coal and petroleum. Exploration
and production of oil and gas come under the petroleum sector. Mining of vast range of metals:
lead, uranium, copper, lead, gold, silver and molybdenum come under the copper segment. Mining
of both types of coal, metallurgical and thermal comes under the coal segment. Lastly, the
company’s iron ore segment covers iron ore mining operations (BHP, n.d.).
BHP is one of the largest diversified commodities in terms of market capitalization. Its huge
operations provide employment to nearly 60,000 peoples. The main production operations of the
company are based in Australia and the Americas. BHP’s sales and marketing division is led
through Singapore and US and it sells the products globally on various commodity exchanges (BHP
Annual Report, 2018).
The company’s massive operations and its product portfolio diversification strengthen the
competitive position of the company (Ker, 2017). The commodity companies face significant risk
from the volatility in the prices of the commodities but this product diversification insulates BHP’s
profitability to some extent against such risk. This comparative advantage also protects the
company from the possible adverse effects of the high leverage requirement of this industry.
The company sells its products globally and the volatility in economic growth of the emerging
countries like China can dent BHP’s sales. So, it faces systematic risks from the slower global
growth rate and the negative movements in exchange rates as mentioned in the BHP annual report
(2018). The company faces unsystematic risks arising from regulatory investigations, new
regulations that may lead to prohibition of it’s certain products and court rulings. Ongoing legal
3
Paraphrase This Document
Need a fresh take? Get an instant paraphrase of this document with our AI Paraphraser
Student name – ID FIN600 TX YYYY
Assignment – Company
proceeding regarding the Samarco dam failure is another significant risk factor because of the
uncertainties in the potential liabilities, which can change the future expectations of BHP’s profits.
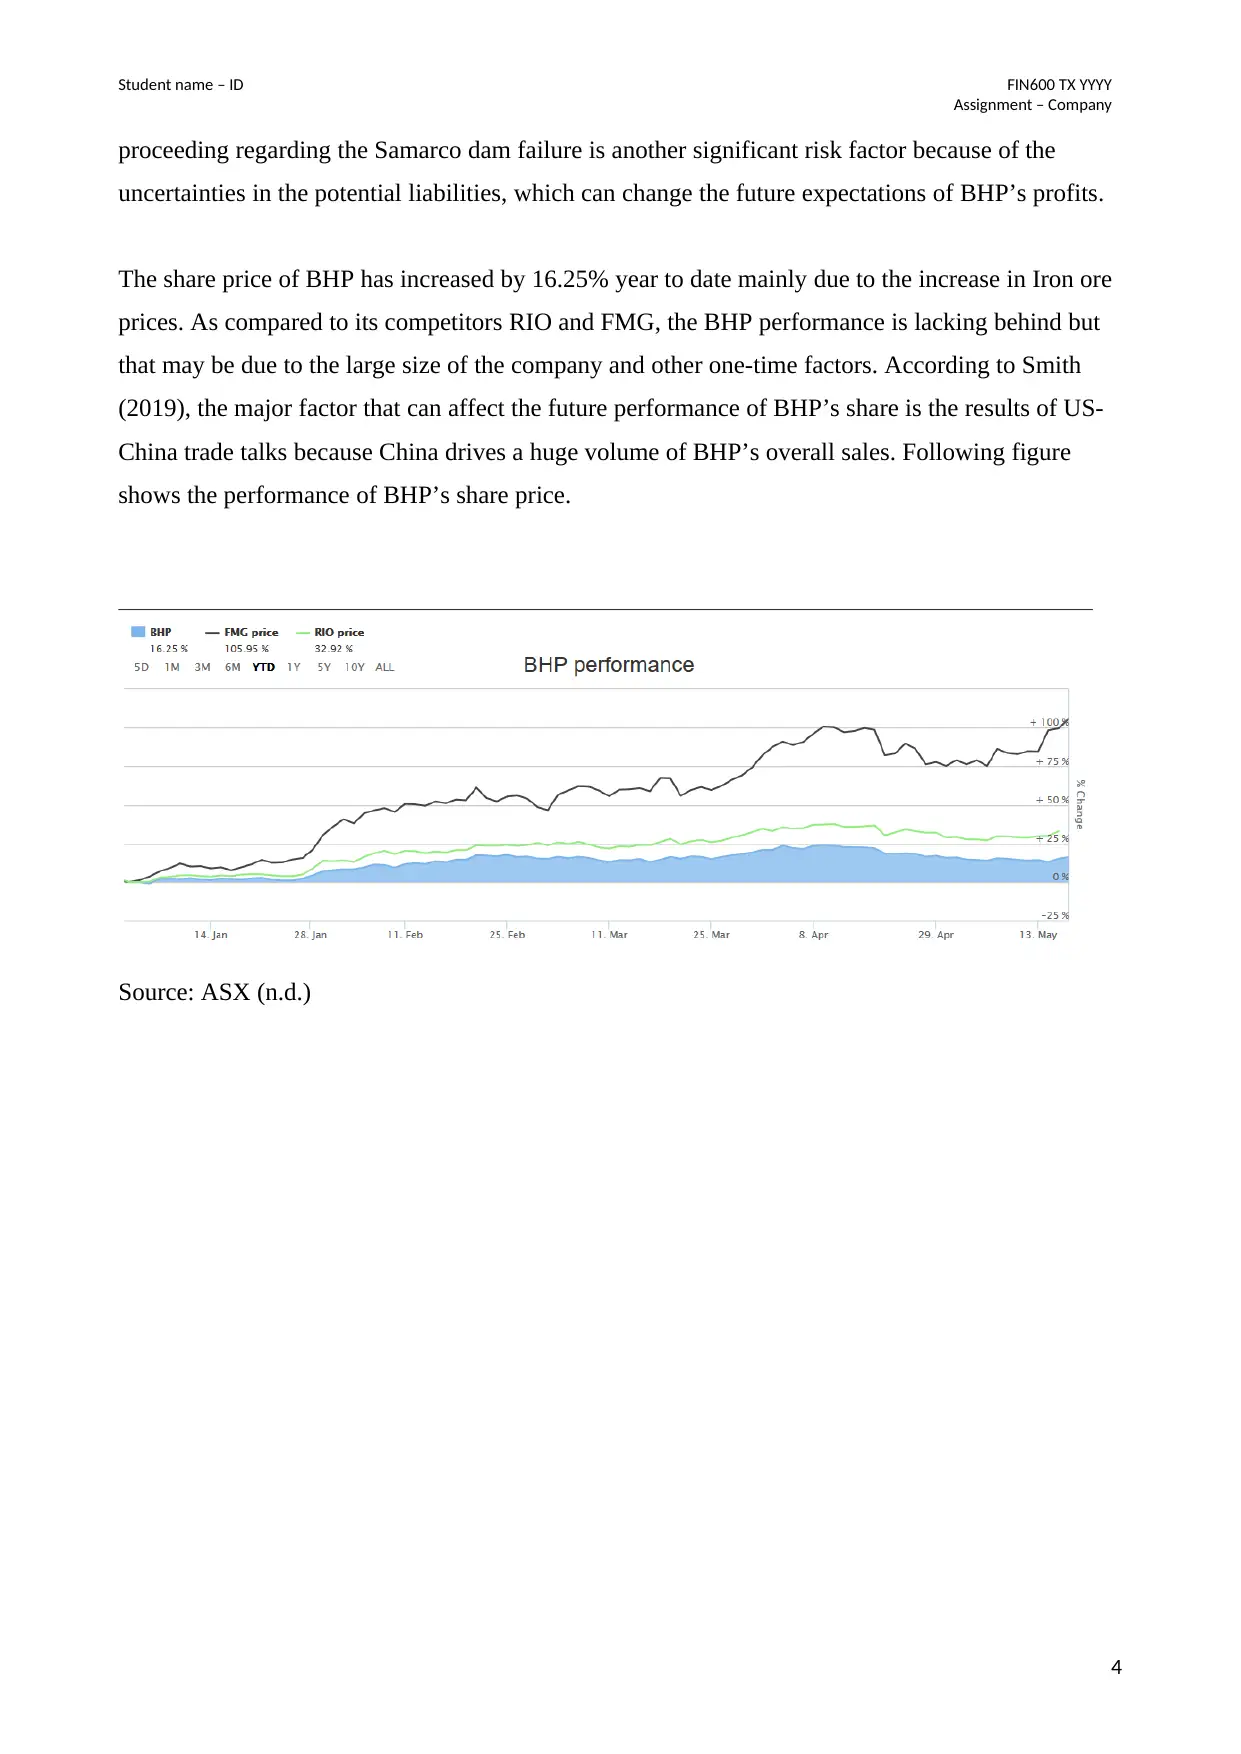
The share price of BHP has increased by 16.25% year to date mainly due to the increase in Iron ore
prices. As compared to its competitors RIO and FMG, the BHP performance is lacking behind but
that may be due to the large size of the company and other one-time factors. According to Smith
(2019), the major factor that can affect the future performance of BHP’s share is the results of US-
China trade talks because China drives a huge volume of BHP’s overall sales. Following figure
shows the performance of BHP’s share price.
Source: ASX (n.d.)
4
Assignment – Company
proceeding regarding the Samarco dam failure is another significant risk factor because of the
uncertainties in the potential liabilities, which can change the future expectations of BHP’s profits.
The share price of BHP has increased by 16.25% year to date mainly due to the increase in Iron ore
prices. As compared to its competitors RIO and FMG, the BHP performance is lacking behind but
that may be due to the large size of the company and other one-time factors. According to Smith
(2019), the major factor that can affect the future performance of BHP’s share is the results of US-
China trade talks because China drives a huge volume of BHP’s overall sales. Following figure
shows the performance of BHP’s share price.
Source: ASX (n.d.)
4
Student name – ID FIN600 TX YYYY
Assignment – Company
2 Company Analysis
2.1 Financial statements, Current Financial performance, economic
outlook
Financial analysis of the company involves evaluation of the company’s financial statements,
current business performance and overall economic conditions to determine the financial stability
and profitability of the firm for making an investment decision.
The company analysis can be done using its financial information and overall economic outlook.
Horizontal analysis is used to provide information about the change in BHP’s business operations
over time by comparing the recent period data with the previous period. Vertical analysis of income
statement and balance sheet measures the change in the impact of individual items in financial
statements relative to the total revenue and total assets respectively.
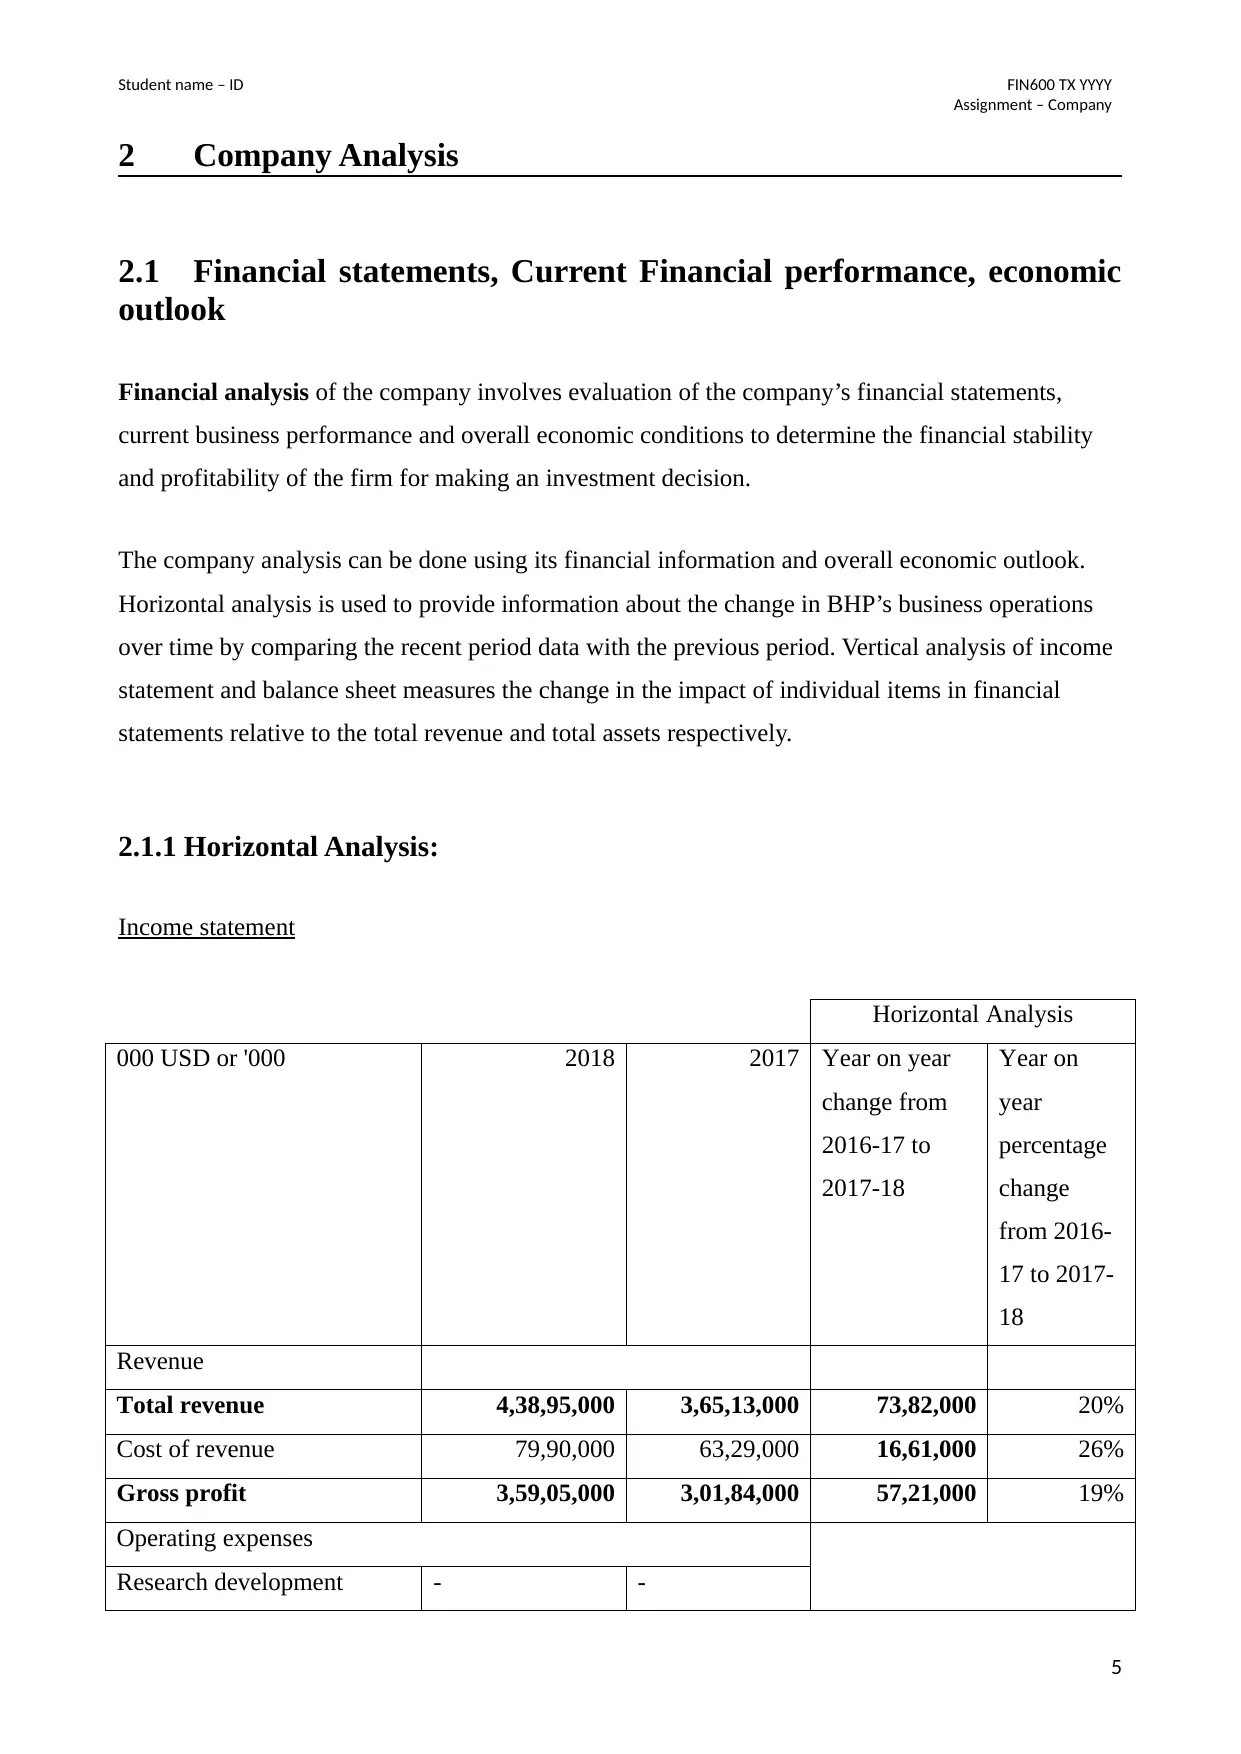
2.1.1 Horizontal Analysis:
Income statement
Horizontal Analysis
000 USD or '000 2018 2017 Year on year
change from
2016-17 to
2017-18
Year on
year
percentage
change
from 2016-
17 to 2017-
18
Revenue
Total revenue 4,38,95,000 3,65,13,000 73,82,000 20%
Cost of revenue 79,90,000 63,29,000 16,61,000 26%
Gross profit 3,59,05,000 3,01,84,000 57,21,000 19%
Operating expenses
Research development - -
5
Assignment – Company
2 Company Analysis
2.1 Financial statements, Current Financial performance, economic
outlook
Financial analysis of the company involves evaluation of the company’s financial statements,
current business performance and overall economic conditions to determine the financial stability
and profitability of the firm for making an investment decision.
The company analysis can be done using its financial information and overall economic outlook.
Horizontal analysis is used to provide information about the change in BHP’s business operations
over time by comparing the recent period data with the previous period. Vertical analysis of income
statement and balance sheet measures the change in the impact of individual items in financial
statements relative to the total revenue and total assets respectively.
2.1.1 Horizontal Analysis:
Income statement
Horizontal Analysis
000 USD or '000 2018 2017 Year on year
change from
2016-17 to
2017-18
Year on
year
percentage
change
from 2016-
17 to 2017-
18
Revenue
Total revenue 4,38,95,000 3,65,13,000 73,82,000 20%
Cost of revenue 79,90,000 63,29,000 16,61,000 26%
Gross profit 3,59,05,000 3,01,84,000 57,21,000 19%
Operating expenses
Research development - -
5
⊘ This is a preview!⊘
Do you want full access?
Subscribe today to unlock all pages.
Trusted by 1+ million students worldwide
Student name – ID FIN600 TX YYYY
Assignment – Company
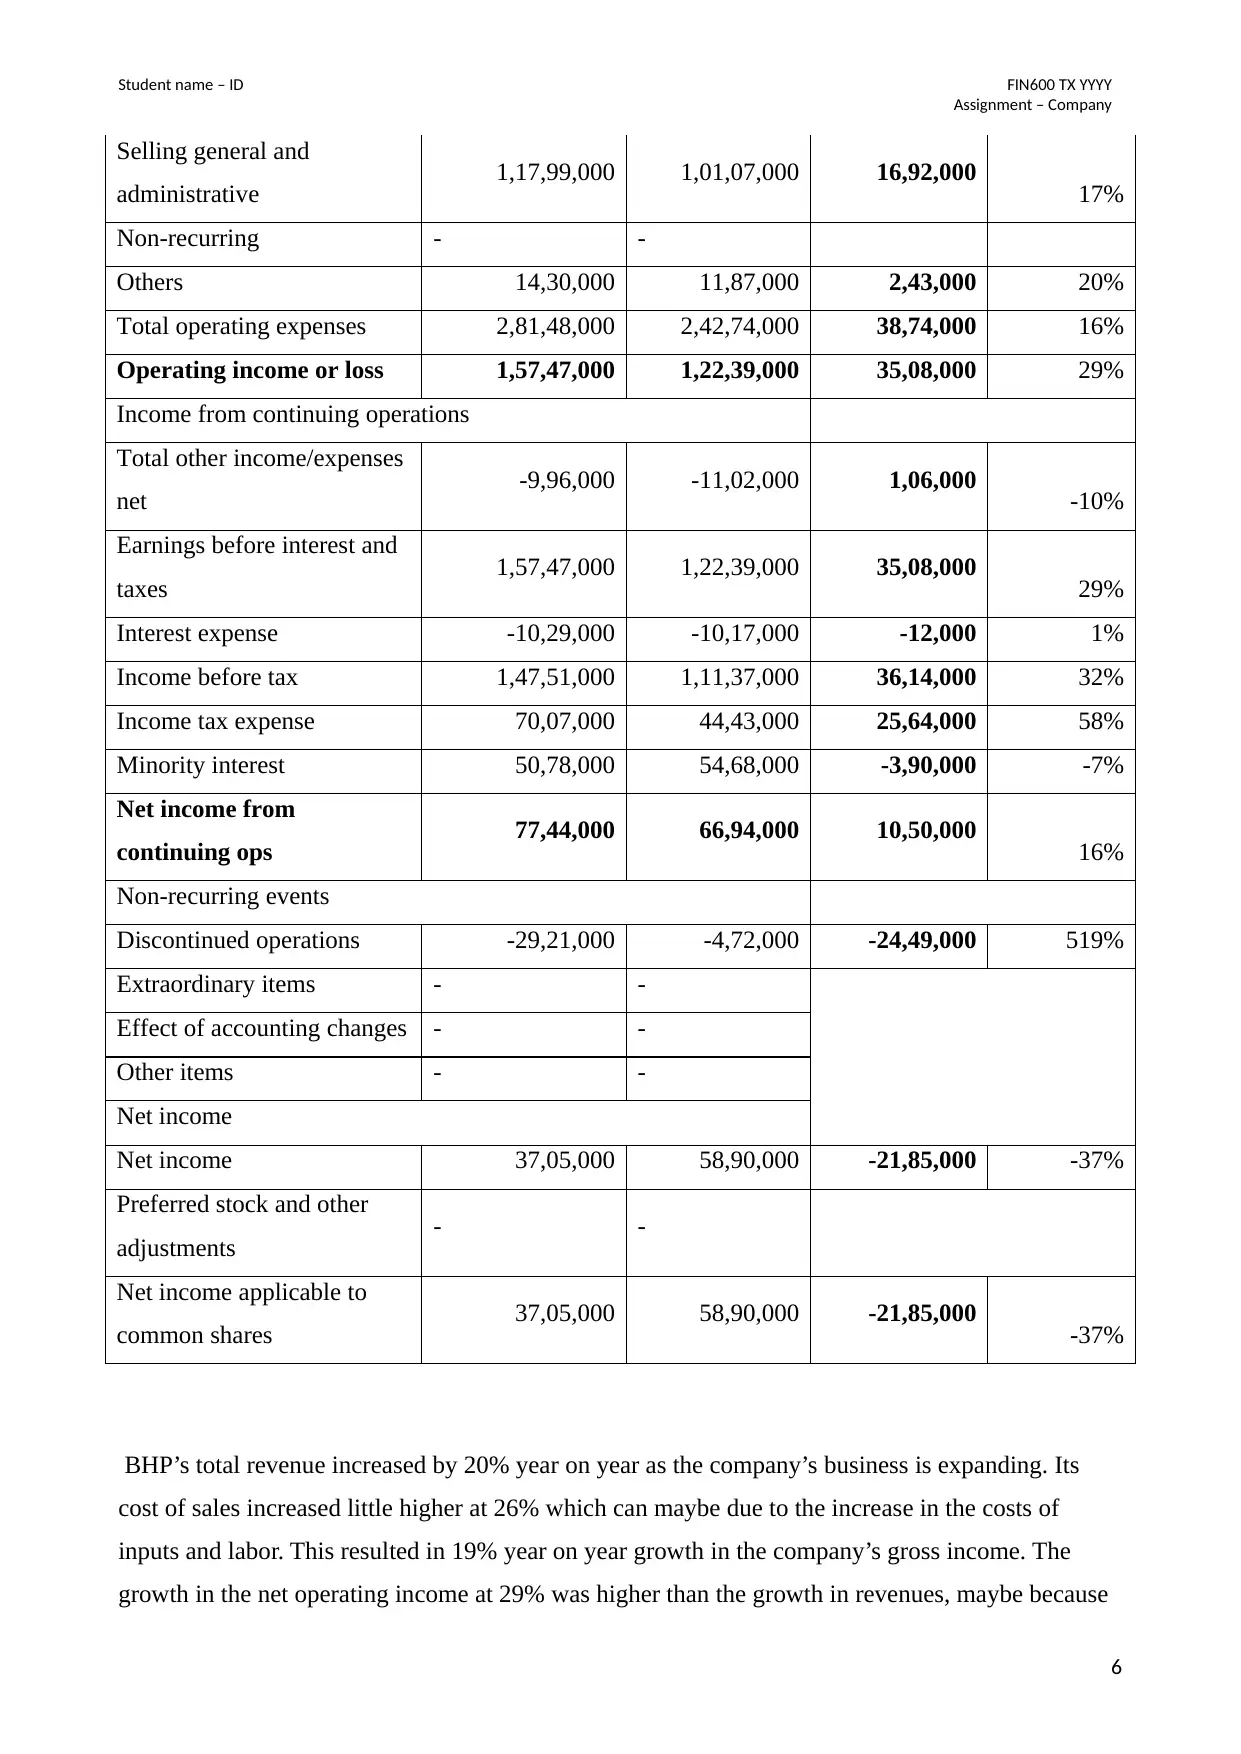
Selling general and
administrative 1,17,99,000 1,01,07,000 16,92,000 17%
Non-recurring - -
Others 14,30,000 11,87,000 2,43,000 20%
Total operating expenses 2,81,48,000 2,42,74,000 38,74,000 16%
Operating income or loss 1,57,47,000 1,22,39,000 35,08,000 29%
Income from continuing operations
Total other income/expenses
net -9,96,000 -11,02,000 1,06,000 -10%
Earnings before interest and
taxes 1,57,47,000 1,22,39,000 35,08,000 29%
Interest expense -10,29,000 -10,17,000 -12,000 1%
Income before tax 1,47,51,000 1,11,37,000 36,14,000 32%
Income tax expense 70,07,000 44,43,000 25,64,000 58%
Minority interest 50,78,000 54,68,000 -3,90,000 -7%
Net income from
continuing ops 77,44,000 66,94,000 10,50,000 16%
Non-recurring events
Discontinued operations -29,21,000 -4,72,000 -24,49,000 519%
Extraordinary items - -
Effect of accounting changes - -
Other items - -
Net income
Net income 37,05,000 58,90,000 -21,85,000 -37%
Preferred stock and other
adjustments - -
Net income applicable to
common shares 37,05,000 58,90,000 -21,85,000 -37%
BHP’s total revenue increased by 20% year on year as the company’s business is expanding. Its
cost of sales increased little higher at 26% which can maybe due to the increase in the costs of
inputs and labor. This resulted in 19% year on year growth in the company’s gross income. The
growth in the net operating income at 29% was higher than the growth in revenues, maybe because
6
Assignment – Company
Selling general and
administrative 1,17,99,000 1,01,07,000 16,92,000 17%
Non-recurring - -
Others 14,30,000 11,87,000 2,43,000 20%
Total operating expenses 2,81,48,000 2,42,74,000 38,74,000 16%
Operating income or loss 1,57,47,000 1,22,39,000 35,08,000 29%
Income from continuing operations
Total other income/expenses
net -9,96,000 -11,02,000 1,06,000 -10%
Earnings before interest and
taxes 1,57,47,000 1,22,39,000 35,08,000 29%
Interest expense -10,29,000 -10,17,000 -12,000 1%
Income before tax 1,47,51,000 1,11,37,000 36,14,000 32%
Income tax expense 70,07,000 44,43,000 25,64,000 58%
Minority interest 50,78,000 54,68,000 -3,90,000 -7%
Net income from
continuing ops 77,44,000 66,94,000 10,50,000 16%
Non-recurring events
Discontinued operations -29,21,000 -4,72,000 -24,49,000 519%
Extraordinary items - -
Effect of accounting changes - -
Other items - -
Net income
Net income 37,05,000 58,90,000 -21,85,000 -37%
Preferred stock and other
adjustments - -
Net income applicable to
common shares 37,05,000 58,90,000 -21,85,000 -37%
BHP’s total revenue increased by 20% year on year as the company’s business is expanding. Its
cost of sales increased little higher at 26% which can maybe due to the increase in the costs of
inputs and labor. This resulted in 19% year on year growth in the company’s gross income. The
growth in the net operating income at 29% was higher than the growth in revenues, maybe because
6
Paraphrase This Document
Need a fresh take? Get an instant paraphrase of this document with our AI Paraphraser
Student name – ID FIN600 TX YYYY
Assignment – Company
of increasing efficiency in BHP’s business operations. The growth in the company’s net income
from continuing operations was a positive number but there was a massive negative impact of
expenses/losses related to the discontinued operations which increased by staggering 519%. This
resulted in 37% decline in the firm’s overall net income. As, this decrease in the net income is
mainly due to the one time losses so it can be seen from above analysis that company is moving in
the right direction as depicted by growing revenue and operating profits.
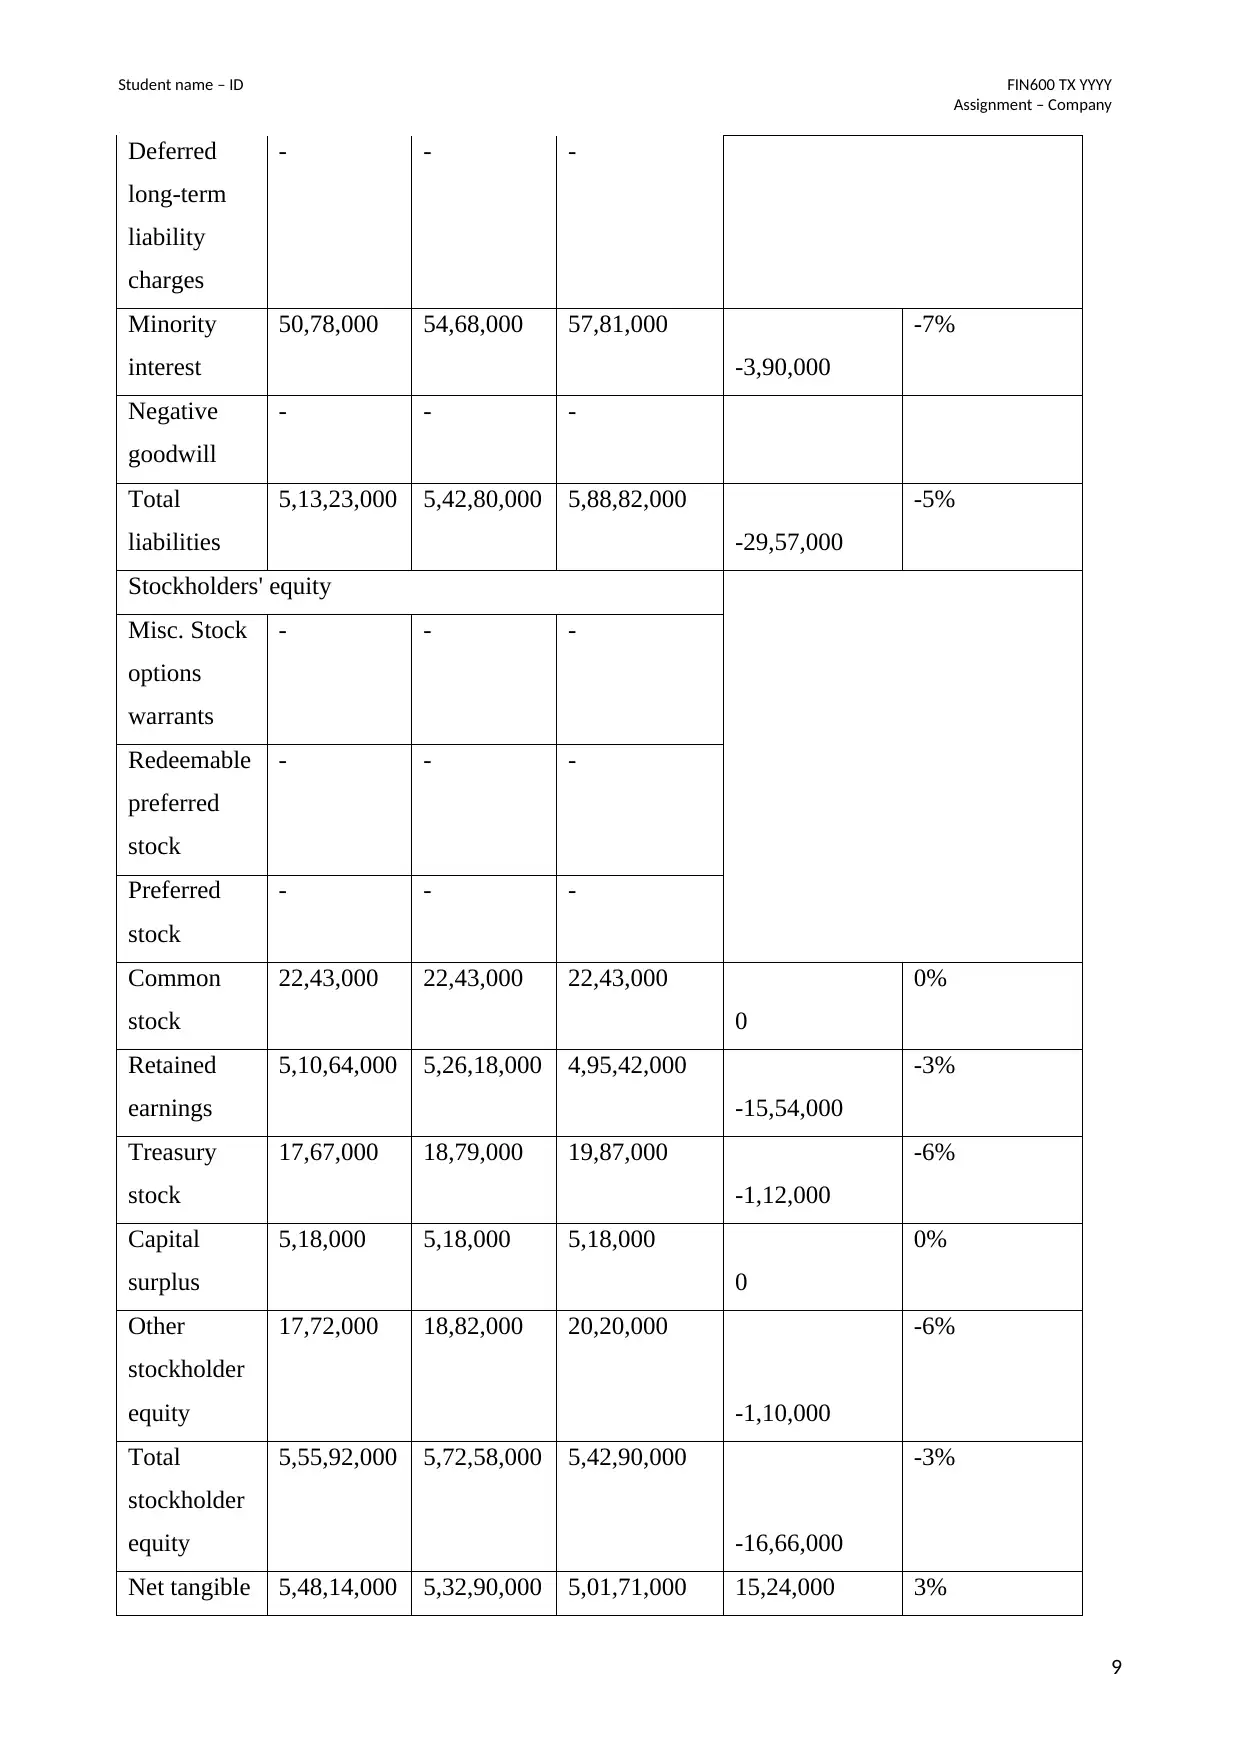
Balance sheet:
000 USD 30-06-2018 30-06-2017 30-06-2016 Horizontal Analysis
Current assets
Year on year
change from
2016-17 to
2017-18
Year on year
percentage
change from
2016-17 to
2017-18
Cash and
cash
equivalents
1,58,71,000 1,41,53,000 1,03,19,000
17,18,000
12%
Short-term
investments
18,000 31,000 36,000
-13,000
-42%
Net
receivables
32,02,000 30,31,000 37,22,000
1,71,000
6%
Inventory 37,64,000 36,73,000 34,11,000 91,000 2%
Other
current
assets
1,22,63,000 1,68,000 1,83,000
1,20,95,000
7199%
Total
current
assets
3,51,30,000 2,10,56,000 1,77,14,000
1,40,74,000
67%
Long-term
investments
32,77,000 33,97,000 50,53,000
-1,20,000
-4%
Property
plant and
6,71,82,000 8,04,97,000 8,39,75,000 -1,33,15,000 -17%
7
Assignment – Company
of increasing efficiency in BHP’s business operations. The growth in the company’s net income
from continuing operations was a positive number but there was a massive negative impact of
expenses/losses related to the discontinued operations which increased by staggering 519%. This
resulted in 37% decline in the firm’s overall net income. As, this decrease in the net income is
mainly due to the one time losses so it can be seen from above analysis that company is moving in
the right direction as depicted by growing revenue and operating profits.
Balance sheet:
000 USD 30-06-2018 30-06-2017 30-06-2016 Horizontal Analysis
Current assets
Year on year
change from
2016-17 to
2017-18
Year on year
percentage
change from
2016-17 to
2017-18
Cash and
cash
equivalents
1,58,71,000 1,41,53,000 1,03,19,000
17,18,000
12%
Short-term
investments
18,000 31,000 36,000
-13,000
-42%
Net
receivables
32,02,000 30,31,000 37,22,000
1,71,000
6%
Inventory 37,64,000 36,73,000 34,11,000 91,000 2%
Other
current
assets
1,22,63,000 1,68,000 1,83,000
1,20,95,000
7199%
Total
current
assets
3,51,30,000 2,10,56,000 1,77,14,000
1,40,74,000
67%
Long-term
investments
32,77,000 33,97,000 50,53,000
-1,20,000
-4%
Property
plant and
6,71,82,000 8,04,97,000 8,39,75,000 -1,33,15,000 -17%
7
Student name – ID FIN600 TX YYYY
Assignment – Company
equipment
Goodwill 2,47,000 32,69,000 32,73,000 -30,22,000 -92%
Intangible
assets
5,31,000 6,99,000 8,46,000
-1,68,000
-24%
Accumulate
d
amortisation
- - -
Other assets 56,26,000 80,88,000 80,92,000 -24,62,000 -30%
Deferred
long-term
asset
charges
40,41,000 57,88,000 61,47,000
-17,47,000
-30%
Total Non
current
assets
7,68,63,000 9,59,50,000 10,12,39,000
-1,90,87,000
-20%
Total assets 11,19,93,00
0
11,70,06,00
0
11,89,53,000
-50,13,000
-4%
Current liabilities
Accounts
payable
59,77,000 55,51,000 53,89,000
4,26,000
8%
Short/
current
long-term
debt
27,22,000 13,64,000 45,70,000
13,58,000
100%
Other
current
liabilities
51,55,000 43,24,000 22,98,000
8,31,000
19%
Total
current
liabilities
1,39,89,000 1,13,66,000 1,23,40,000
26,23,000
23%
Long-term
debt
2,44,36,000 2,95,13,000 3,32,30,000
-50,77,000
-17%
Other
liabilities
1,21,73,000 1,25,86,000 1,30,06,000
-4,13,000
-3%
8
⊘ This is a preview!⊘
Do you want full access?
Subscribe today to unlock all pages.
Trusted by 1+ million students worldwide
Student name – ID FIN600 TX YYYY
Assignment – Company
Deferred
long-term
liability
charges
- - -
Minority
interest
50,78,000 54,68,000 57,81,000
-3,90,000
-7%
Negative
goodwill
- - -
Total
liabilities
5,13,23,000 5,42,80,000 5,88,82,000
-29,57,000
-5%
Stockholders' equity
Misc. Stock
options
warrants
- - -
Redeemable
preferred
stock
- - -
Preferred
stock
- - -
Common
stock
22,43,000 22,43,000 22,43,000
0
0%
Retained
earnings
5,10,64,000 5,26,18,000 4,95,42,000
-15,54,000
-3%
Treasury
stock
17,67,000 18,79,000 19,87,000
-1,12,000
-6%
Capital
surplus
5,18,000 5,18,000 5,18,000
0
0%
Other
stockholder
equity
17,72,000 18,82,000 20,20,000
-1,10,000
-6%
Total
stockholder
equity
5,55,92,000 5,72,58,000 5,42,90,000
-16,66,000
-3%
Net tangible 5,48,14,000 5,32,90,000 5,01,71,000 15,24,000 3%
9
Paraphrase This Document
Need a fresh take? Get an instant paraphrase of this document with our AI Paraphraser
Student name – ID FIN600 TX YYYY
Assignment – Company
assets
BHP’s total assets decreased by 4% year on year in 2018 due to the huge disinvestments operations
(BHP Annual Report, 2018). This resulted in the increase in cash assets by 12% and decline in
goodwill by 92%. Also there was astronomical increase in the other current assets due to the
increase in assets held for sale represented by its onshore US assets and liabilities. BHP’s short term
debt doubled in this period maybe due to the need to fund its expanding business operations and
working capital but there was not much change in its total liabilities and equities. So, it can be seen
that changes have occurred in the individual balance sheet items but the main line items are not
much affected.
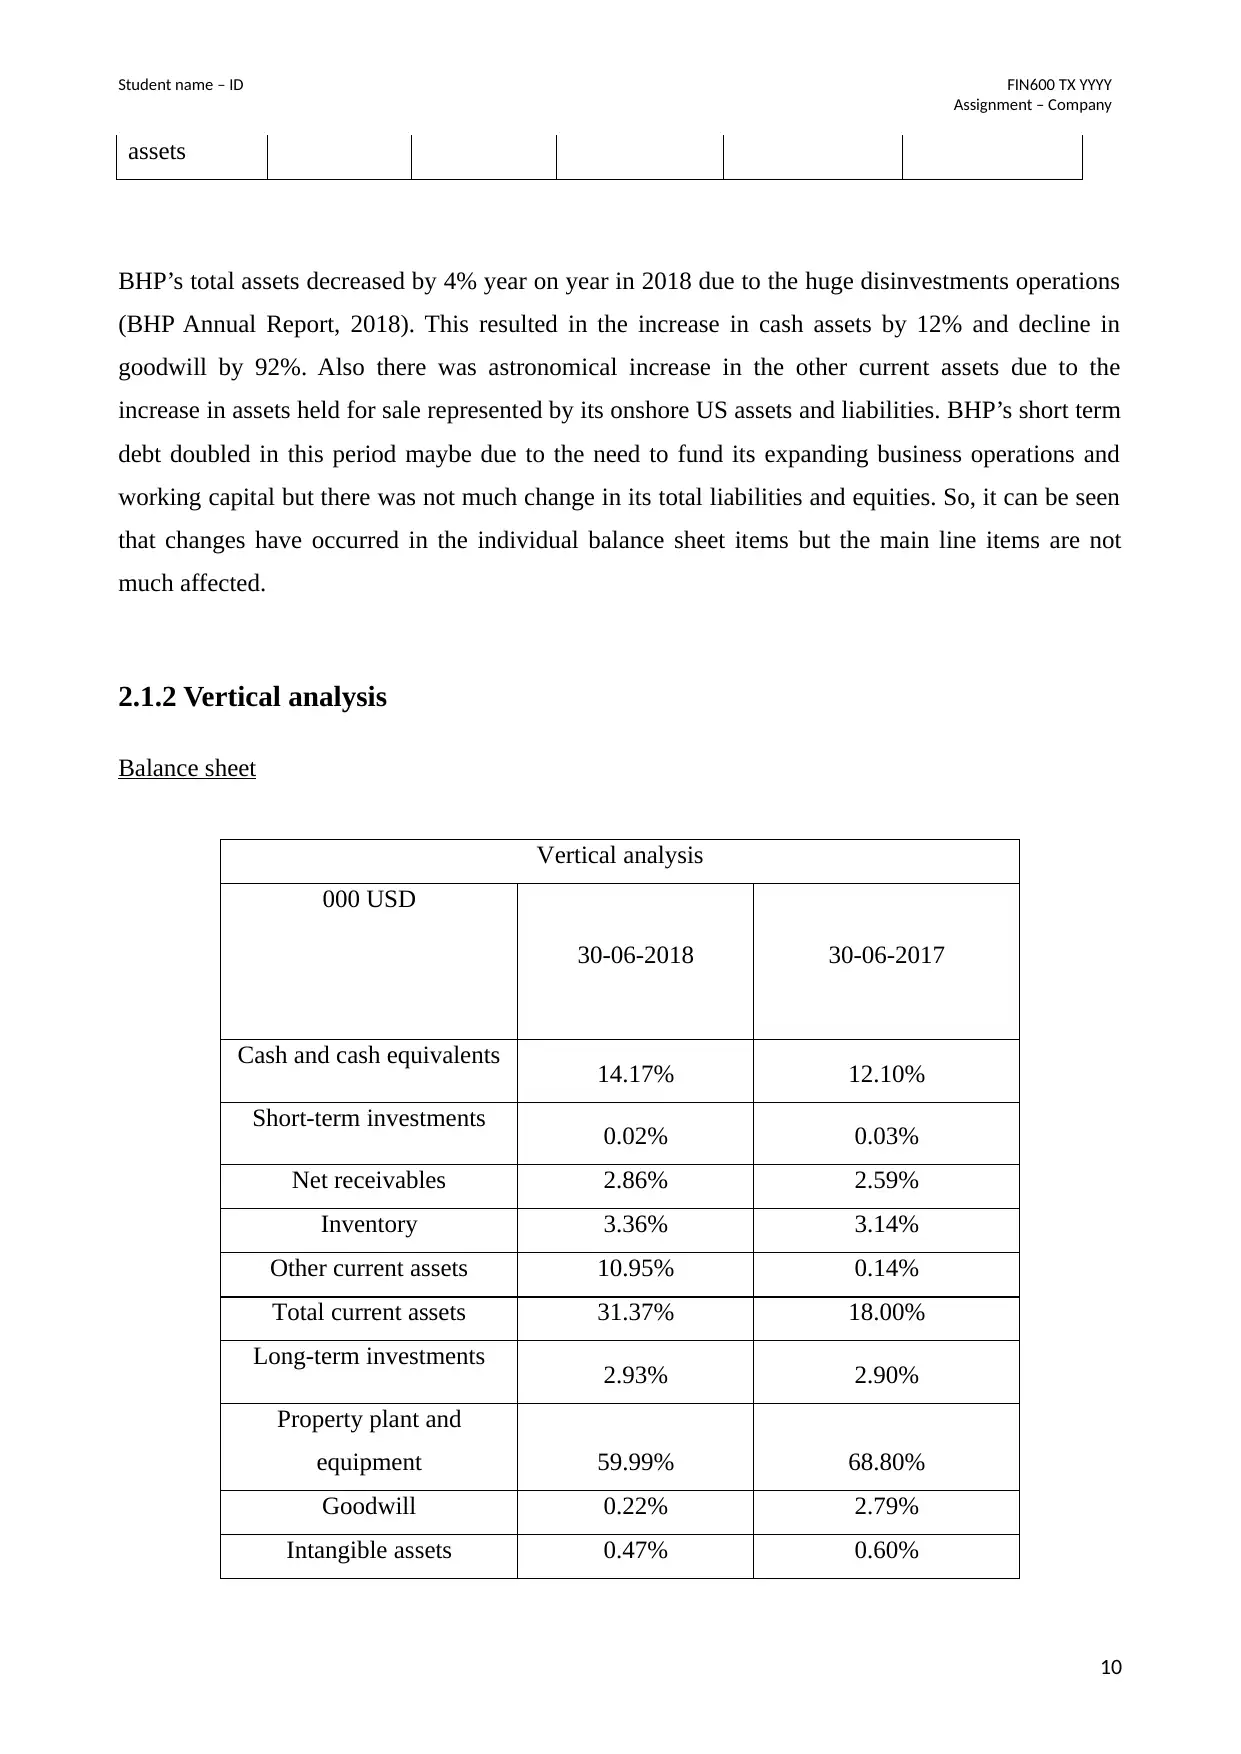
2.1.2 Vertical analysis
Balance sheet
Vertical analysis
000 USD
30-06-2018 30-06-2017
Cash and cash equivalents 14.17% 12.10%
Short-term investments 0.02% 0.03%
Net receivables 2.86% 2.59%
Inventory 3.36% 3.14%
Other current assets 10.95% 0.14%
Total current assets 31.37% 18.00%
Long-term investments 2.93% 2.90%
Property plant and
equipment 59.99% 68.80%
Goodwill 0.22% 2.79%
Intangible assets 0.47% 0.60%
10
Assignment – Company
assets
BHP’s total assets decreased by 4% year on year in 2018 due to the huge disinvestments operations
(BHP Annual Report, 2018). This resulted in the increase in cash assets by 12% and decline in
goodwill by 92%. Also there was astronomical increase in the other current assets due to the
increase in assets held for sale represented by its onshore US assets and liabilities. BHP’s short term
debt doubled in this period maybe due to the need to fund its expanding business operations and
working capital but there was not much change in its total liabilities and equities. So, it can be seen
that changes have occurred in the individual balance sheet items but the main line items are not
much affected.
2.1.2 Vertical analysis
Balance sheet
Vertical analysis
000 USD
30-06-2018 30-06-2017
Cash and cash equivalents 14.17% 12.10%
Short-term investments 0.02% 0.03%
Net receivables 2.86% 2.59%
Inventory 3.36% 3.14%
Other current assets 10.95% 0.14%
Total current assets 31.37% 18.00%
Long-term investments 2.93% 2.90%
Property plant and
equipment 59.99% 68.80%
Goodwill 0.22% 2.79%
Intangible assets 0.47% 0.60%
10
Student name – ID FIN600 TX YYYY
Assignment – Company
Accumulated amortisation
Other assets 5.02% 6.91%
Deferred long-term asset
charges 3.61% 4.95%
Total Non current assets 68.63% 82.00%
Total assets 100.00% 100.00%
Accounts payable 5.34% 4.74%
Short/current long-term
debt 2.43% 1.17%
Other current liabilities 4.60% 3.70%
Total current liabilities 12.49% 9.71%
Long-term debt 21.82% 25.22%
Other liabilities 10.87% 10.76%
Deferred long-term
liability charges
Minority interest 4.53% 4.67%
Negative goodwill
Total liabilities 45.83% 46.39%
Misc. Stock options
warrants - -
Redeemable preferred
stock - -
Preferred stock - -
Common stock 2.00% 1.92%
Retained earnings 45.60% 44.97%
Treasury stock 1.58% 1.61%
Capital surplus 0.46% 0.44%
Other stockholder equity 1.58% 1.61%
Total stockholder equity 49.64% 48.94%
11
⊘ This is a preview!⊘
Do you want full access?
Subscribe today to unlock all pages.
Trusted by 1+ million students worldwide
1 out of 24
Related Documents


Your All-in-One AI-Powered Toolkit for Academic Success.
+13062052269
info@desklib.com
Available 24*7 on WhatsApp / Email
![[object Object]](/_next/static/media/star-bottom.7253800d.svg)
Unlock your academic potential
Copyright © 2020–2026 A2Z Services. All Rights Reserved. Developed and managed by ZUCOL.