BHP Billiton Financial Analysis Report: Performance from 2016-2018
VerifiedAdded on 2023/05/29
|10
|2401
|337
Report
AI Summary
This report provides a financial analysis of BHP Billiton, a major Australian mining company, covering the period from 2016 to 2018. The analysis utilizes ratio analysis, including profitability, efficiency, liquidity, and gearing ratios, to assess the company's financial performance. The report highlights improvements in profitability and liquidity over the period, as indicated by increasing return on assets, return on equity, and current ratio. However, it also notes that the company's gearing ratio remains high, suggesting a continued high level of financial risk. The analysis concludes that BHP Billiton has shown consistent improvement in its financial performance, particularly in profitability and efficiency, but needs to address its financial leverage.

Running head: FINANCIAL MANAGEMENT
Financial Analysis of BHP Billiton
Name of the Student:
Name of the University:
Author’s Note:
Financial Analysis of BHP Billiton
Name of the Student:
Name of the University:
Author’s Note:
Paraphrase This Document
Need a fresh take? Get an instant paraphrase of this document with our AI Paraphraser

2FINANCIAL ANALYSIS OF BHP BILLITON
Executive Summary
The aim of the assignment is to conduct financial analysis on the company BHP Billiton the
analysis was conducted using the annual report of the company for the last three year time
period. The performance of the company was analysed using the ratio analysis for the time
period 2016-2018 and relevant implications indicated by each of the ratios were discussed.
3FINANCIAL ANALYSIS OF BHP BILLITON
Table of Contents
Introduction................................................................................................................................4
Discussion..................................................................................................................................4
Profitability Ratio’s................................................................................................................5
Efficiency Ratio’s...................................................................................................................6
Liquidity Ratio’s....................................................................................................................7
Gearing Ratio’s......................................................................................................................7
Conclusion..................................................................................................................................8
Reference....................................................................................................................................9
⊘ This is a preview!⊘
Do you want full access?
Subscribe today to unlock all pages.
Trusted by 1+ million students worldwide
4FINANCIAL ANALYSIS OF BHP BILLITON
Introduction
The BHP Billiton Ltd Company part of the BHP group an Australian Company
trading its operation in the mining, metals and petroleum sector is headquartered in
Melbourne. The operations of the company is done at a large scale and is the second largest
company in terms of revenue in the terms of total revenue earned. The financial analysis of
the company for the trend period 2016-2018 was conducted given the current macro-
economic conditions and the business factors under which the company operates (Pepper et
al. 2015). The financial analysis includes the usage and evaluation of the financial
performance of the company by conducting a ratio analysis for the trend period. The ratio
analysis is a key effective quantitate analysis tool, which is used for evaluating the financial
performance of the company over a given period. The financial position for the company in
the last two years have increased consistently showing the profitability and the efficiency for
the company has increased consistently for the time. The increase in the profitability shows
the efficiency of the company in the utilisation of the total assets of the company and the
capital employed by the company (Vogel 2014). The liquidity ratio for the company also has
increased for the company in the trend period analysed for the company. The financial
leverage or the gearing ratio’s for the company is still high for the company showing that the
financial risk for the company is high for the given trend analysed for the company (Stone et
al. 2016).
Discussion
The ratio analysis will provide us a graphical view of the performance of the
company’s performance in the given time period. The four common base of ratios calculated
for the company were profitability ratios, efficiency ratios, liquidity ratio and gearing ratios.
Paraphrase This Document
Need a fresh take? Get an instant paraphrase of this document with our AI Paraphraser
5FINANCIAL ANALYSIS OF BHP BILLITON
Profitability Ratio’s
Return on Assets: (Profit before interest and tax / Average total assets*): The ratio
indicates the total return generated by the company on the total assets of the company. The
ratio for the company has been growing from the year 2016-2018 from about -5.12% to
around 13.94%. The ratio indicates that the company has increased efficiency in utilisation
and producing returns over the total assets of the company (Ortea and Gallardo 2015).
Return on Equity: (Profit / Average equity): The return on equity for the company shows
the total profitability for the company on the total capital employed by the company. The
return on equity for the company has shown a consistent growth from the year 2016 where
the return was around -9.50% and was around 10.12% for the year 2017 and around 12.55%
for the year 2018 (Camin et al. 2016).
Net Profit Margin: (Profit before tax / Sales): The net profit margin shows the net return
for the company on the total operational work it conducts. It is the key ratio, which indicates
the profitability scenario for the company. The net profitability ratio for the company was
negative for the year 2016, which was around -23.48% and has shown consistent return from
the year 2017 and 2018 onwards. The growth for the company in the year 2017 and 2018 was
around 26.96% and 33.80% respectively (Omar et al. 2014).
Cash Expense Ratio: (Operating Expenses (excluding tax)* / Net sales): The cash
expense ratio for the company shows the operating expense ratio for the company on the total
operating expense ratio for the company. The cash expense ratio for the company was around
7.78% for both the year 2017 and 2018 respectively.
Cash Return on Sales: (Net Cash flows from operating activities of the company/ total
sales of the company): The Company has consistently increased the consistency in the
operating side of the company by increasing the operating margin of the company. The return
6FINANCIAL ANALYSIS OF BHP BILLITON
generated from the company was around 43.89% in the year 2017 and was 42.30% for the
year 2018 (Evans and Mathur 2014).
Earnings per Share: (Profit for shareholders / Number of ordinary shares): The earning
per share of the company shows the profitability for the company on the total number of the
shares deployed. The ratio indicates the profitability of the company on a per share basis. The
earning per share for the company for the year was around $216.53.
Earnings Yield: (Earnings per share/ Share Price): The earnings yield for the company
shows the net return generated by the company on a per shareholder basis for the company.
The earning yield for the company has been positive for the company and has shown a
consistent growth for the company for the time 2018.
Efficiency Ratio’s
Asset Turnover Ratio: Average Total Assets = (Beginning of Year Total Assets + Year
Ending Total Assets)/2: The asset turnover ratio for the company shows the return generated
by the company from the year 2016 to the year 2018 the return increased from the year 23%
to around 36%. The increased asset turnover ratio for the company shows the efficiency for
the company in the total returns generated by the company and the efficiency of the company
(Easton and Sommers 2018).
Cash flow return on Assets: (Net cash from operating activities / Average total assets):
The return generated by the company on the total average assets of the company shows the
cash flows return generated by the company assets. The return for the company was around
2% in the year 2016 and was around 11% and 38% respectively for the year 2017 and 2018
(Zainudin and Hashim 2016).
Fixed Asset Turnover Ratio: (Sales / Total non-current assets): The fixed asset turnover
ratio for the company shows the total return generated by the company on the total fixed
⊘ This is a preview!⊘
Do you want full access?
Subscribe today to unlock all pages.
Trusted by 1+ million students worldwide
7FINANCIAL ANALYSIS OF BHP BILLITON
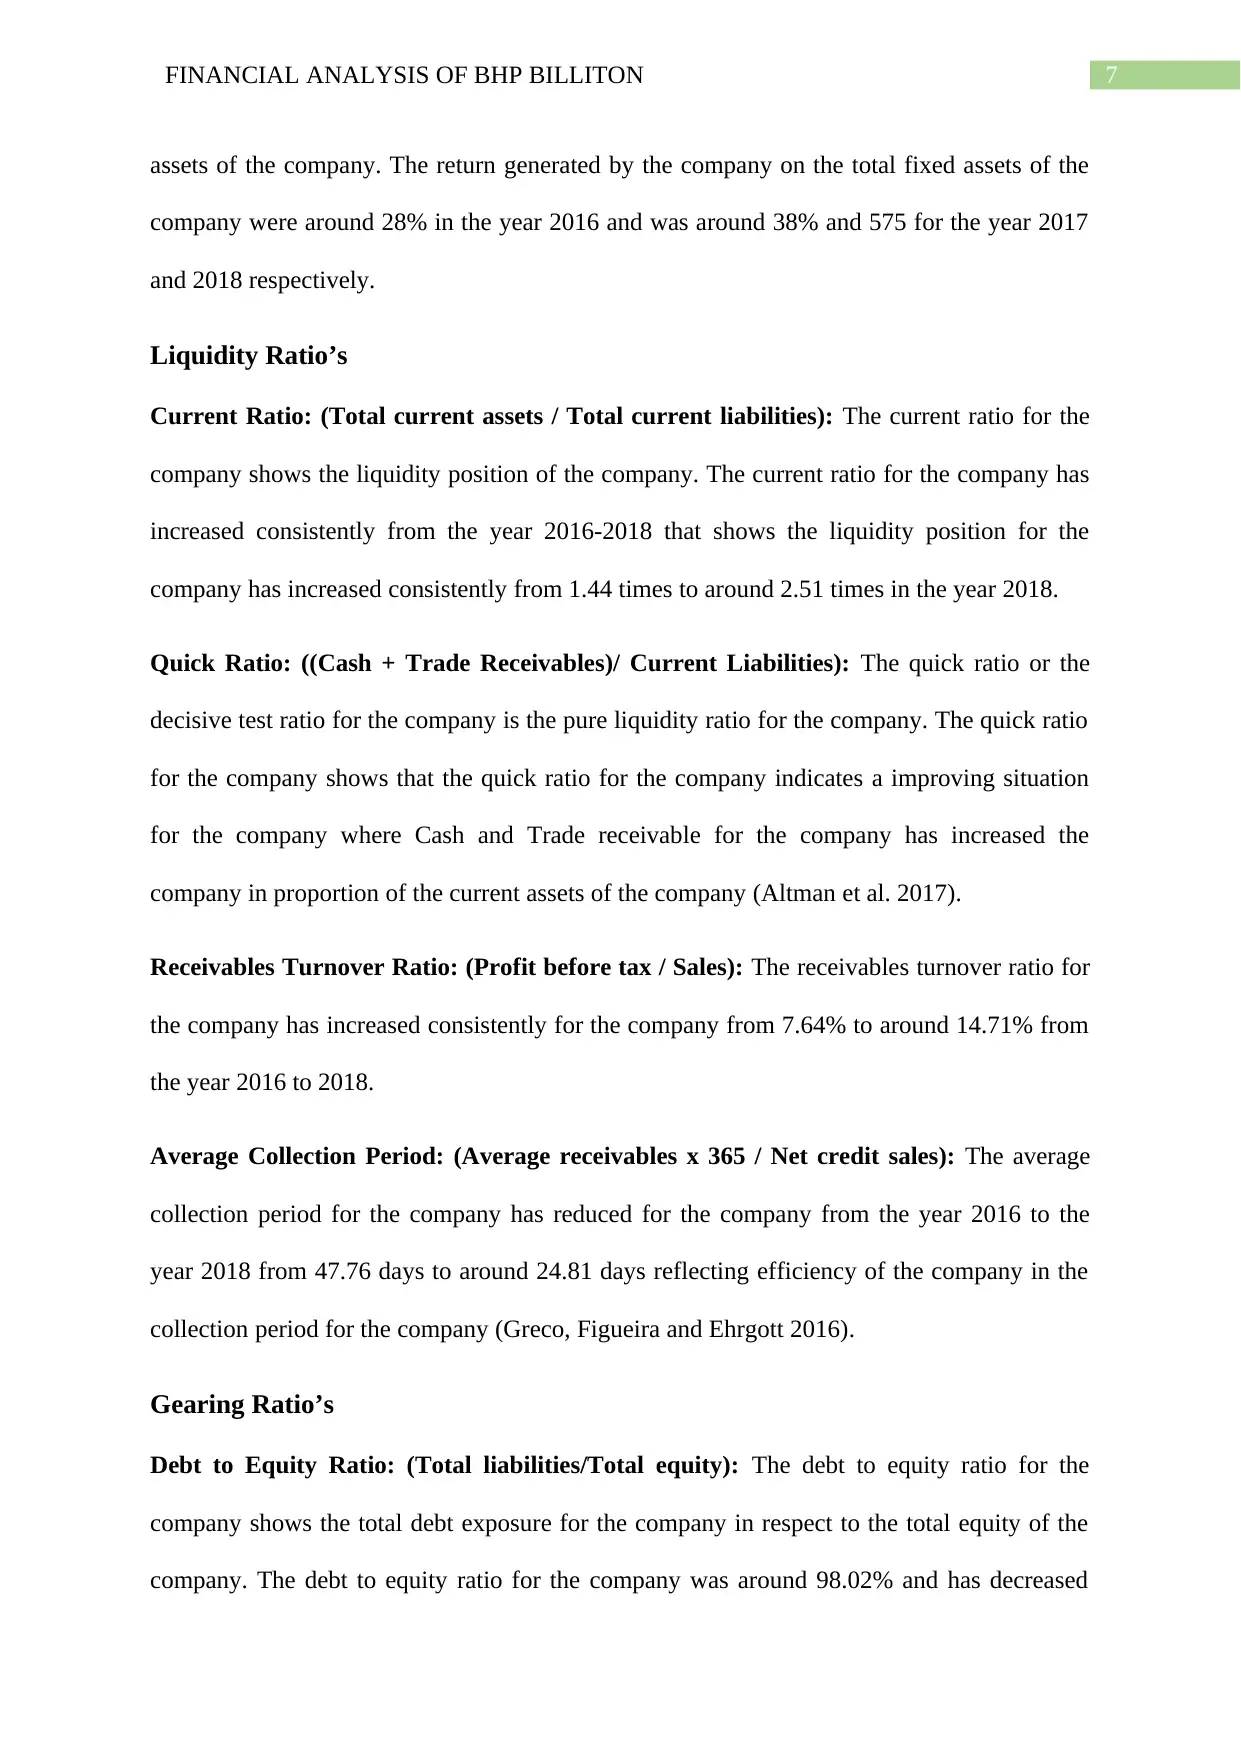
assets of the company. The return generated by the company on the total fixed assets of the
company were around 28% in the year 2016 and was around 38% and 575 for the year 2017
and 2018 respectively.
Liquidity Ratio’s
Current Ratio: (Total current assets / Total current liabilities): The current ratio for the
company shows the liquidity position of the company. The current ratio for the company has
increased consistently from the year 2016-2018 that shows the liquidity position for the
company has increased consistently from 1.44 times to around 2.51 times in the year 2018.
Quick Ratio: ((Cash + Trade Receivables)/ Current Liabilities): The quick ratio or the
decisive test ratio for the company is the pure liquidity ratio for the company. The quick ratio
for the company shows that the quick ratio for the company indicates a improving situation
for the company where Cash and Trade receivable for the company has increased the
company in proportion of the current assets of the company (Altman et al. 2017).
Receivables Turnover Ratio: (Profit before tax / Sales): The receivables turnover ratio for
the company has increased consistently for the company from 7.64% to around 14.71% from
the year 2016 to 2018.
Average Collection Period: (Average receivables x 365 / Net credit sales): The average
collection period for the company has reduced for the company from the year 2016 to the
year 2018 from 47.76 days to around 24.81 days reflecting efficiency of the company in the
collection period for the company (Greco, Figueira and Ehrgott 2016).
Gearing Ratio’s
Debt to Equity Ratio: (Total liabilities/Total equity): The debt to equity ratio for the
company shows the total debt exposure for the company in respect to the total equity of the
company. The debt to equity ratio for the company was around 98.02% and has decreased
Paraphrase This Document
Need a fresh take? Get an instant paraphrase of this document with our AI Paraphraser
8FINANCIAL ANALYSIS OF BHP BILLITON
from the year 2016-2018 time period to about 84.59% in the year 84.59% showing that the
financial risk for the company has decreased consistently (Sujan et al. 2017).
Interest Coverage Ratio: (Earnings before interest and taxes/Interest Expenses): The
interest coverage ratio for the company shows the interest burden of the company on the
operating income of the company. The interest expense for the company was around -5.37%
for the year 2016 and was 8.05% for the year 2017 and 10.21% for the year 2018. The
interest burden for the company is a key factor for the company as the same shows the
amount of debt exposure for the company and the relevant interest burden on the company.
Conclusion
The financial analysis conducted for the BHP Billiton Company shows that the company has
consistently increased the performance of the company in terms of profitability ratios for the
company. The liquidity ratio for the company also has increased for the company in the trend
period analysed for the company. The financial leverage or the gearing ratio’s for the
company is still high for the company showing that the financial risk for the company is high
for the given trend analysed for the company. The profitability ratio for the company has
increased consistently for the company in the trend period analysed for the company. The
increase in the profitability ratio and the efficiency ratio for the company shows that the
company’s financial performance has increased consistently for the company.
9FINANCIAL ANALYSIS OF BHP BILLITON
Reference
Altman, E.I., Iwanicz‐Drozdowska, M., Laitinen, E.K. and Suvas, A., 2017. Financial
Distress Prediction in an International Context: a Review and Empirical Analysis of Altman's
Z‐Score Model. Journal of International Financial Management & Accounting, 28(2),
pp.131-171.
Camin, F., Bontempo, L., Perini, M. and Piasentier, E., 2016. Stable isotope ratio analysis for
assessing the authenticity of food of animal origin. Comprehensive Reviews in Food Science
and Food Safety, 15(5), pp.868-877.
Easton, M. and Sommers, Z., 2018. Financial Statement Analysis & Valuation, 5e.
Evans, J.R. and Mathur, A., 2014. Retailing and the period leading up to the Great Recession:
a model and a 25-year financial ratio analysis of US retailing. The International Review of
Retail, Distribution and Consumer Research, 24(1), pp.30-58.
Greco, S., Figueira, J. and Ehrgott, M., 2016. Multiple criteria decision analysis. New York:
Springer.
Omar, N., Koya, R.K., Sanusi, Z.M. and Shafie, N.A., 2014. Financial statement fraud: A
case examination using Beneish Model and ratio analysis. International Journal of Trade,
Economics and Finance, 5(2), p.184.
Ortea, I. and Gallardo, J.M., 2015. Investigation of production method, geographical origin
and species authentication in commercially relevant shrimps using stable isotope ratio and/or
multi-element analyses combined with chemometrics: An exploratory analysis. Food
chemistry, 170, pp.145-153.
Pepper*, A., McIntosh, P., Fitzsimmons, R., Gebhardt, T. and Dillenbeck, E., 2015,
September. The Unconventional Global Endowment: Results of BHP Billiton's Global
⊘ This is a preview!⊘
Do you want full access?
Subscribe today to unlock all pages.
Trusted by 1+ million students worldwide
10FINANCIAL ANALYSIS OF BHP BILLITON
Assessment. In International Conference and Exhibition, Melbourne, Australia 13-16
September 2015 (pp. 283-283). Society of Exploration Geophysicists and American
Association of Petroleum Geologists.
Stone, A.B., Grant, M.C., Roda, C.P., Hobson, D., Pawlik, T., Wu, C.L. and Wick, E.C.,
2016. Implementation costs of an enhanced recovery after surgery program in the United
States: a financial model and sensitivity analysis based on experiences at a quaternary
academic medical center. Journal of the American College of Surgeons, 222(3), pp.219-225.
Sujan, M.H.K., Islam, F., Azad, M.J. and Rayhan, S.J., 2017. Financial profitability and
resource use efficiency of boro rice cultivation in some selected area of Bangladesh. African
Journal of Agricultural Research, 12(29), pp.2404-2411.Vogel, H.L., 2014. Entertainment
industry economics: A guide for financial analysis. Cambridge University Press.
Zainudin, E.F. and Hashim, H.A., 2016. Detecting fraudulent financial reporting using
financial ratio. Journal of Financial Reporting and Accounting, 14(2), pp.266-278.
1 out of 10
Related Documents


Your All-in-One AI-Powered Toolkit for Academic Success.
+13062052269
info@desklib.com
Available 24*7 on WhatsApp / Email
![[object Object]](/_next/static/media/star-bottom.7253800d.svg)
Unlock your academic potential
Copyright © 2020–2026 A2Z Services. All Rights Reserved. Developed and managed by ZUCOL.