Financial Analysis of BHP and CBA: Share Price and Risk Factors
VerifiedAdded on 2020/12/10
|19
|5164
|272
Report
AI Summary
This report provides a detailed financial analysis of BHP Billiton (BHP) and the Commonwealth Bank of Australia (CBA). It begins with an introduction to the importance of banking services in Australia and the project's focus on market functions, specifically examining the financial instruments of BHP and CBA, as well as debt markets and fiscal/monetary policies. The report analyzes the current share prices of BHP and CBA, including an evolution of share prices over the last five years, presented visually through charts. It then delves into the systematic and unsystematic risks affecting both companies, relating these risks to share price fluctuations. The report also evaluates the current fiscal position of the Australian Federal government, including the Australian yield chart and its shape using expectation and segmented market theories. Finally, it discusses the movements in the target cash rate and its influence on the Australian dollar in the foreign exchange market. The report concludes with references and an appendix containing relevant tables and charts.

Banking and Finance
Paraphrase This Document
Need a fresh take? Get an instant paraphrase of this document with our AI Paraphraser
Table of Contents
INTRODUCTION...........................................................................................................................1
PART A...........................................................................................................................................1
Q1. Current price of ordinary and common share in BHP and CBA..........................................1
Evolvement in last 5 year share prices of the above mentioned two companies........................3
Charts representation...................................................................................................................3
Q2. Systematic and unsystematic risk affects on BHP and CBA...............................................4
Relation on share prices with the news over both BHP and CBA..............................................6
PART B............................................................................................................................................6
Q1: Evaluation of current fiscal position of Australian Federal government ............................6
Q2: Current Australian yield chart..............................................................................................7
(a): Shape of curve using expectation Theory and Segmented market theory............................7
(b): Movements in the fiscal position identified in B.1) to influence the yield curve...............8
Q3. Movements in the target cash rate from 2001 to 2017 on Australian dollar in foreign
exchange market..........................................................................................................................9
CONCLUSION..............................................................................................................................10
REFERENCES..............................................................................................................................11
APPENDIX: ..................................................................................................................................12
TABLE : 1.................................................................................................................................12
TABLE : 2.................................................................................................................................13
INTRODUCTION
Banking services is an essential aspects for both economy development and formulating
nations such as Australia. There are various basic advantages of having banking services because
a nation can operates effectively in case they are having an institutions that can help them to
increase wealth of the country. Bank performance is expressed as appropriate reflection in the
manner under which the capital of a banks can be used in a firm. However, through using bank
services as a appropriate signal, the banks can attain the future aims with implementation of a
various set of indicators that are having specific points out the banks present status in order to
attain future aims and objectives. This project carries two parts that focuses on markets
functions. The target on financial instruments of “BHP Billiton” and “commonwealth bank of
Australia”. The other parts focuses on debt market and fiscal as well as monetary policy of these
companies are taken into considerations (Venardos, 2012).
PART A
Q1. Current price of ordinary and common share in BHP and CBA
BHP Billiton: It is known as one of the global leading resources industry. They are
engaged in extraction and process of mineral, oil and gas with total number of 60000 employees
and contractor. Its products are sold international with sales and marketing led by various
countries. It is running into dual listed company structure with two parent companies that are
operating together for the common motive. The major purpose is to create long term shareholder
value breakthrough and evolution as well as marketing of natural resources. They are following
certain strategies that is to operate wide as well as long life expansion of the businesses. The
current Share price of BHP Billiton is 33.96 AUD. It has been found that like other companies,
BHP can be subject of false representation through an individual not associated with their
country. Shareholder are advices to be very wary of any unsolicited guidelines that offers to
purchase share at a discount of free company report (Richards, 2012).
CBA: The commonwealth banks of Australia is said to be multinational banks that is
having appropriate banking services across the nation. It used to deliver a wide variety of
financial services that consists of retail, business and financial institution banking. The
commonwealth is consider to be one of the largest Australian listed company that deals in
insurances, investment and broking services. It is known as a public limited services industry that
1
⊘ This is a preview!⊘
Do you want full access?
Subscribe today to unlock all pages.
Trusted by 1+ million students worldwide
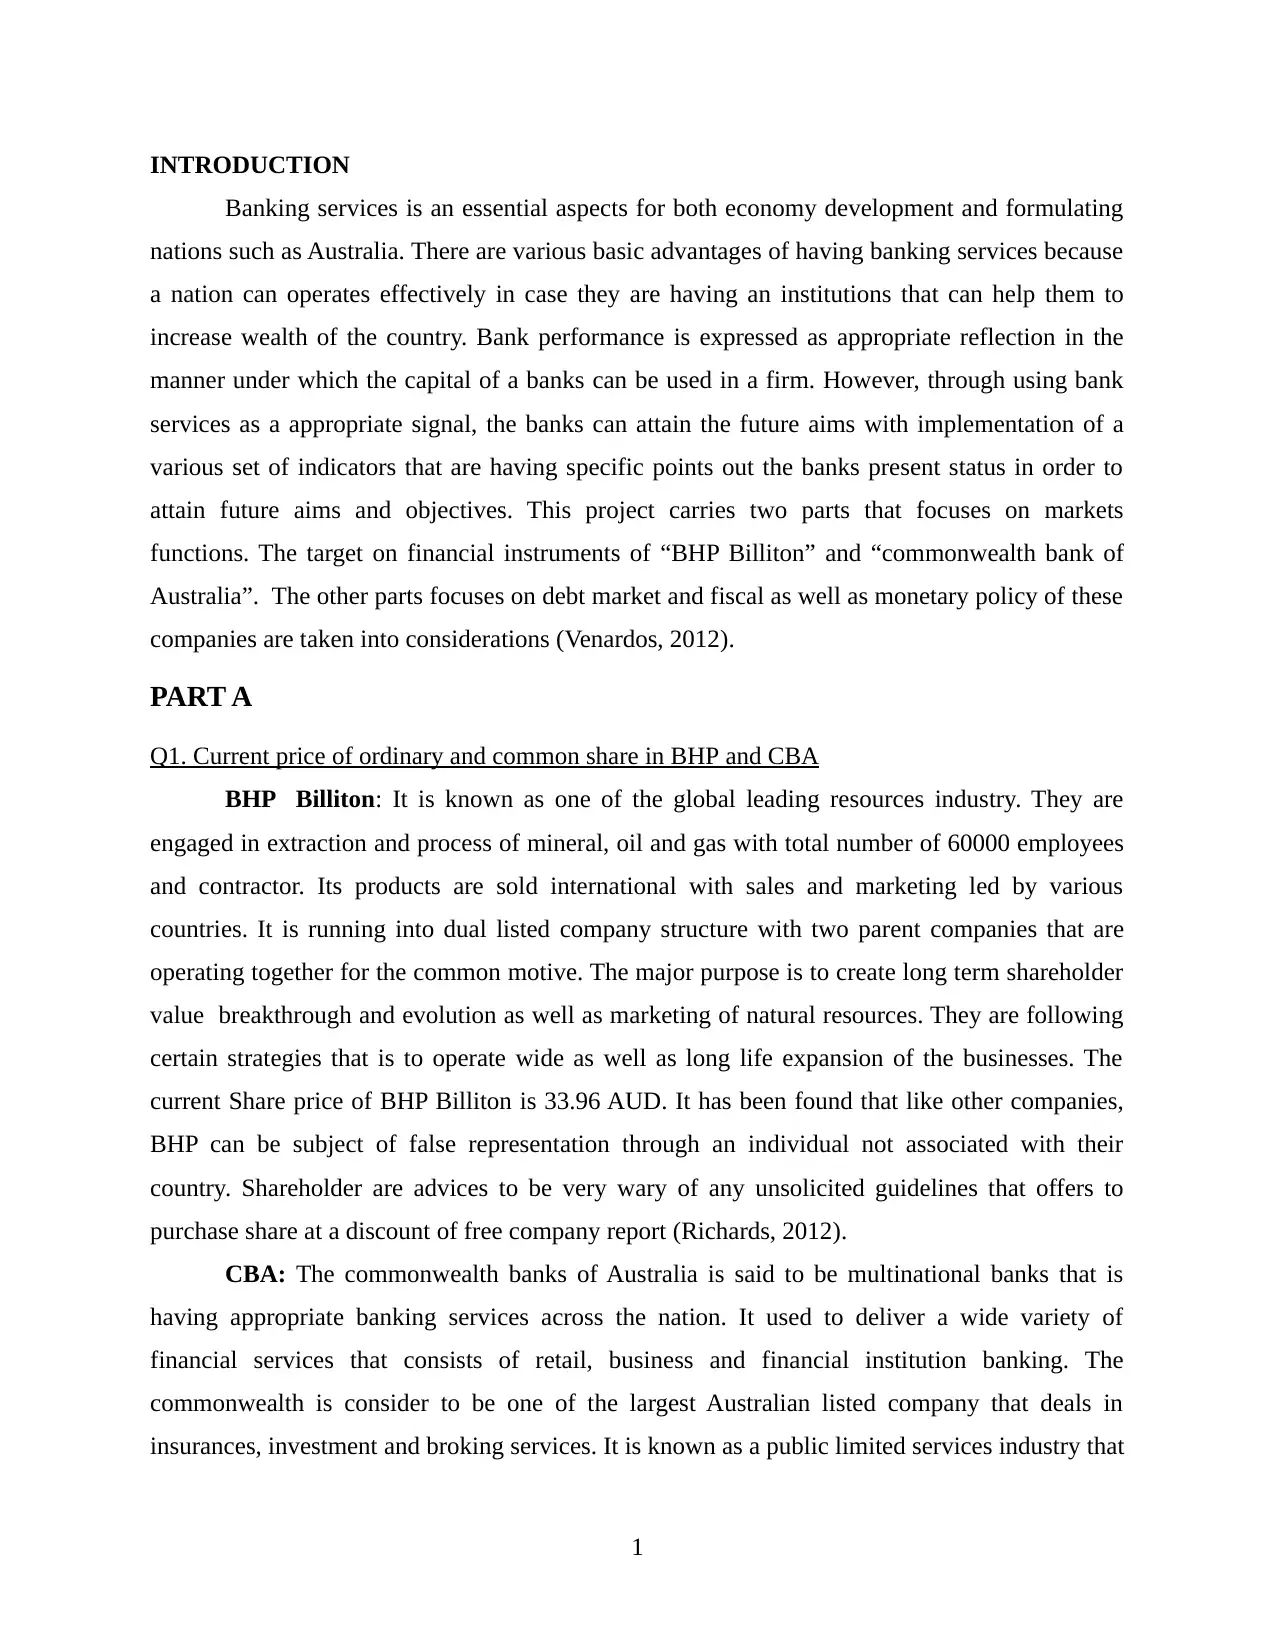
is listed on ASX. The banks role in central banking is expanded gradually after 1920. As per the
current facts the commonwealth banks has generated unaudited cash net profit after tax of total
$2.35billion during the quarter. In their release the cash NPAT was down 2% on the basis of
report which is 9% on an underlying basis (Scholes, 2015).
2
current facts the commonwealth banks has generated unaudited cash net profit after tax of total
$2.35billion during the quarter. In their release the cash NPAT was down 2% on the basis of
report which is 9% on an underlying basis (Scholes, 2015).
2
Paraphrase This Document
Need a fresh take? Get an instant paraphrase of this document with our AI Paraphraser
The current share prices of CBA is recorded with total of 70.09 AUD as on 21st may,
2018.
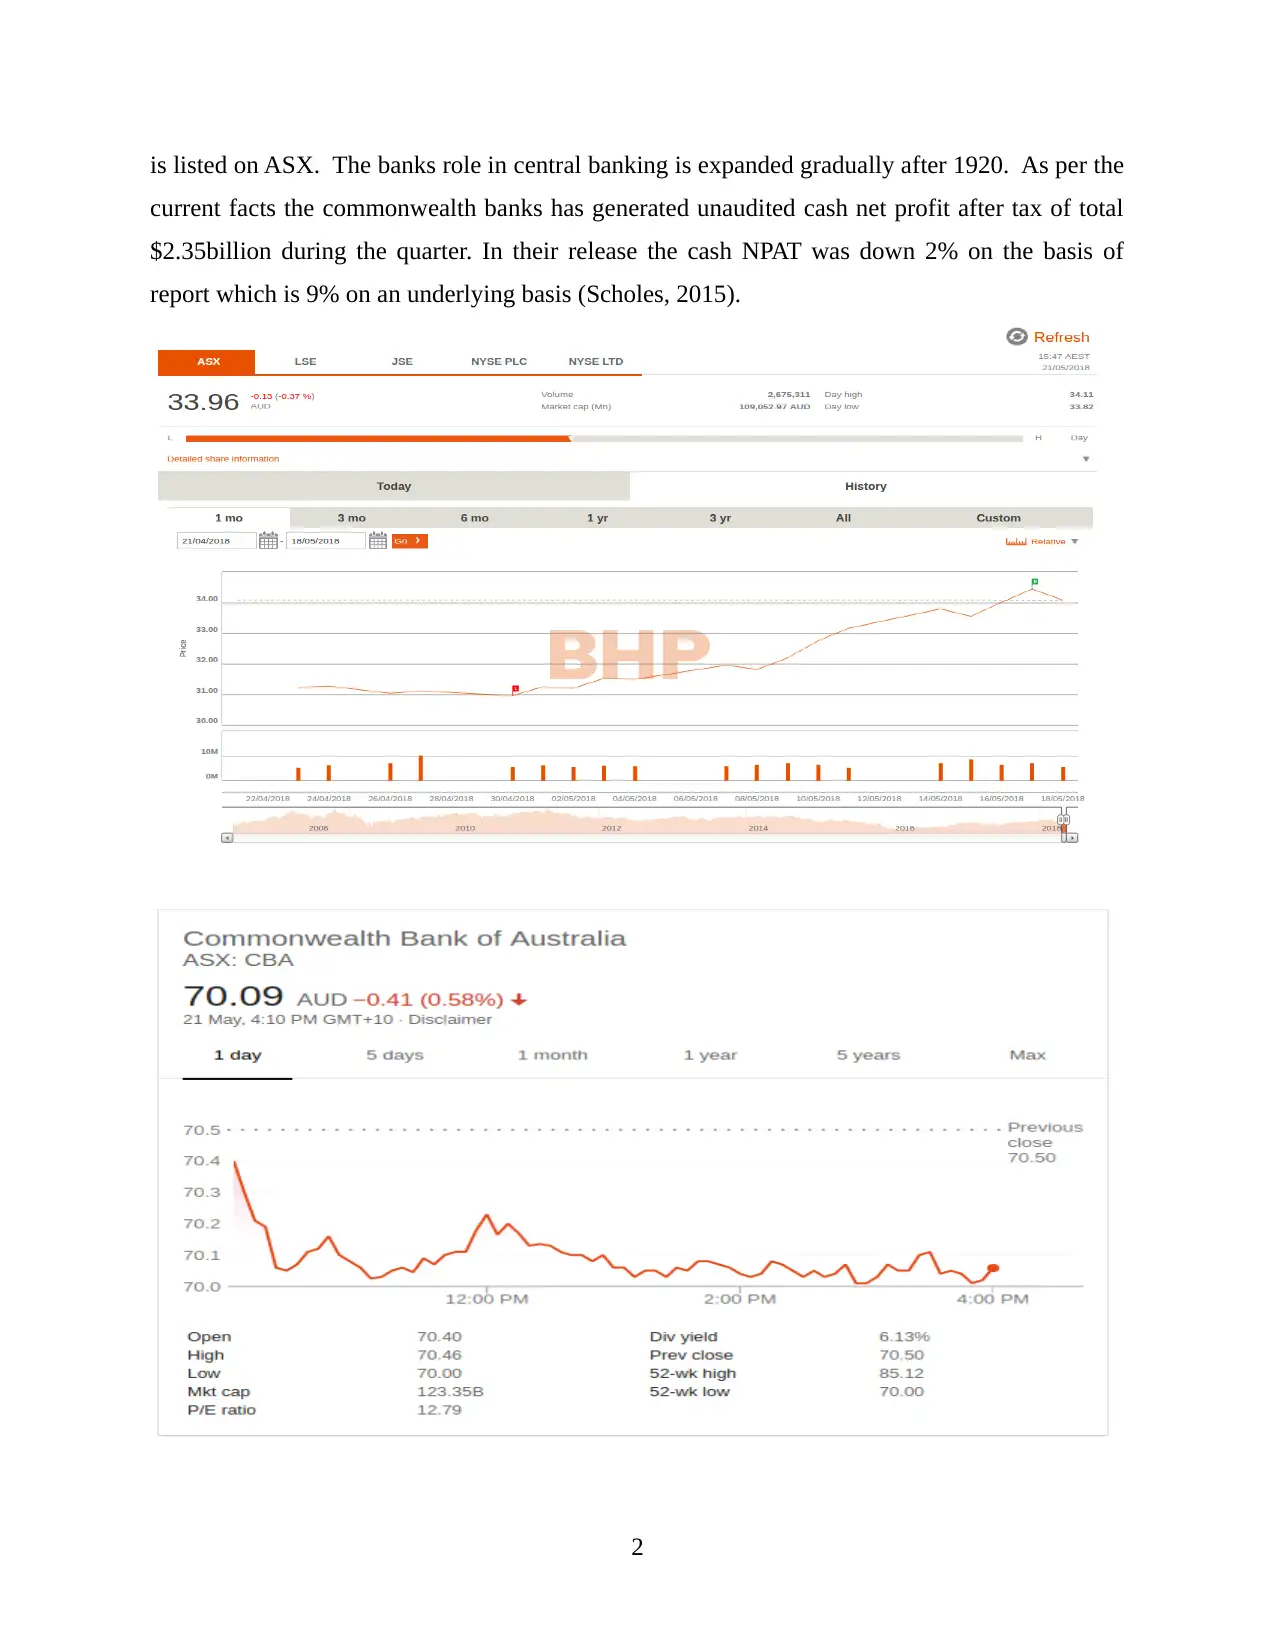
Evolvement in last 5 year share prices of the above mentioned two companies
According to there financial share prices of these two companies, it has been found that
commonwealth banks shares are more effective as compare to BHP (Kettell, 2011). There is
continuous increase in every year. It means that market position of CBA is much more effective
and strong in respect to BHP. This can easily be analyse through observing their historical data
that is mentioned in the below appendix.
Charts representation
From the above charts, it has been indicating performance of BHP Billiton about their
share prices from the last 5 years. The growth in the initial stage of performance is increasing at
constant rate. In the middle stage from 2015 to 2016, it get reducing at very faster rate with only
17.8. after that again it get increasing drastically and reached to a higher level. In current period
of time the value of share is around 33.94.
3
2018.
Evolvement in last 5 year share prices of the above mentioned two companies
According to there financial share prices of these two companies, it has been found that
commonwealth banks shares are more effective as compare to BHP (Kettell, 2011). There is
continuous increase in every year. It means that market position of CBA is much more effective
and strong in respect to BHP. This can easily be analyse through observing their historical data
that is mentioned in the below appendix.
Charts representation
From the above charts, it has been indicating performance of BHP Billiton about their
share prices from the last 5 years. The growth in the initial stage of performance is increasing at
constant rate. In the middle stage from 2015 to 2016, it get reducing at very faster rate with only
17.8. after that again it get increasing drastically and reached to a higher level. In current period
of time the value of share is around 33.94.
3
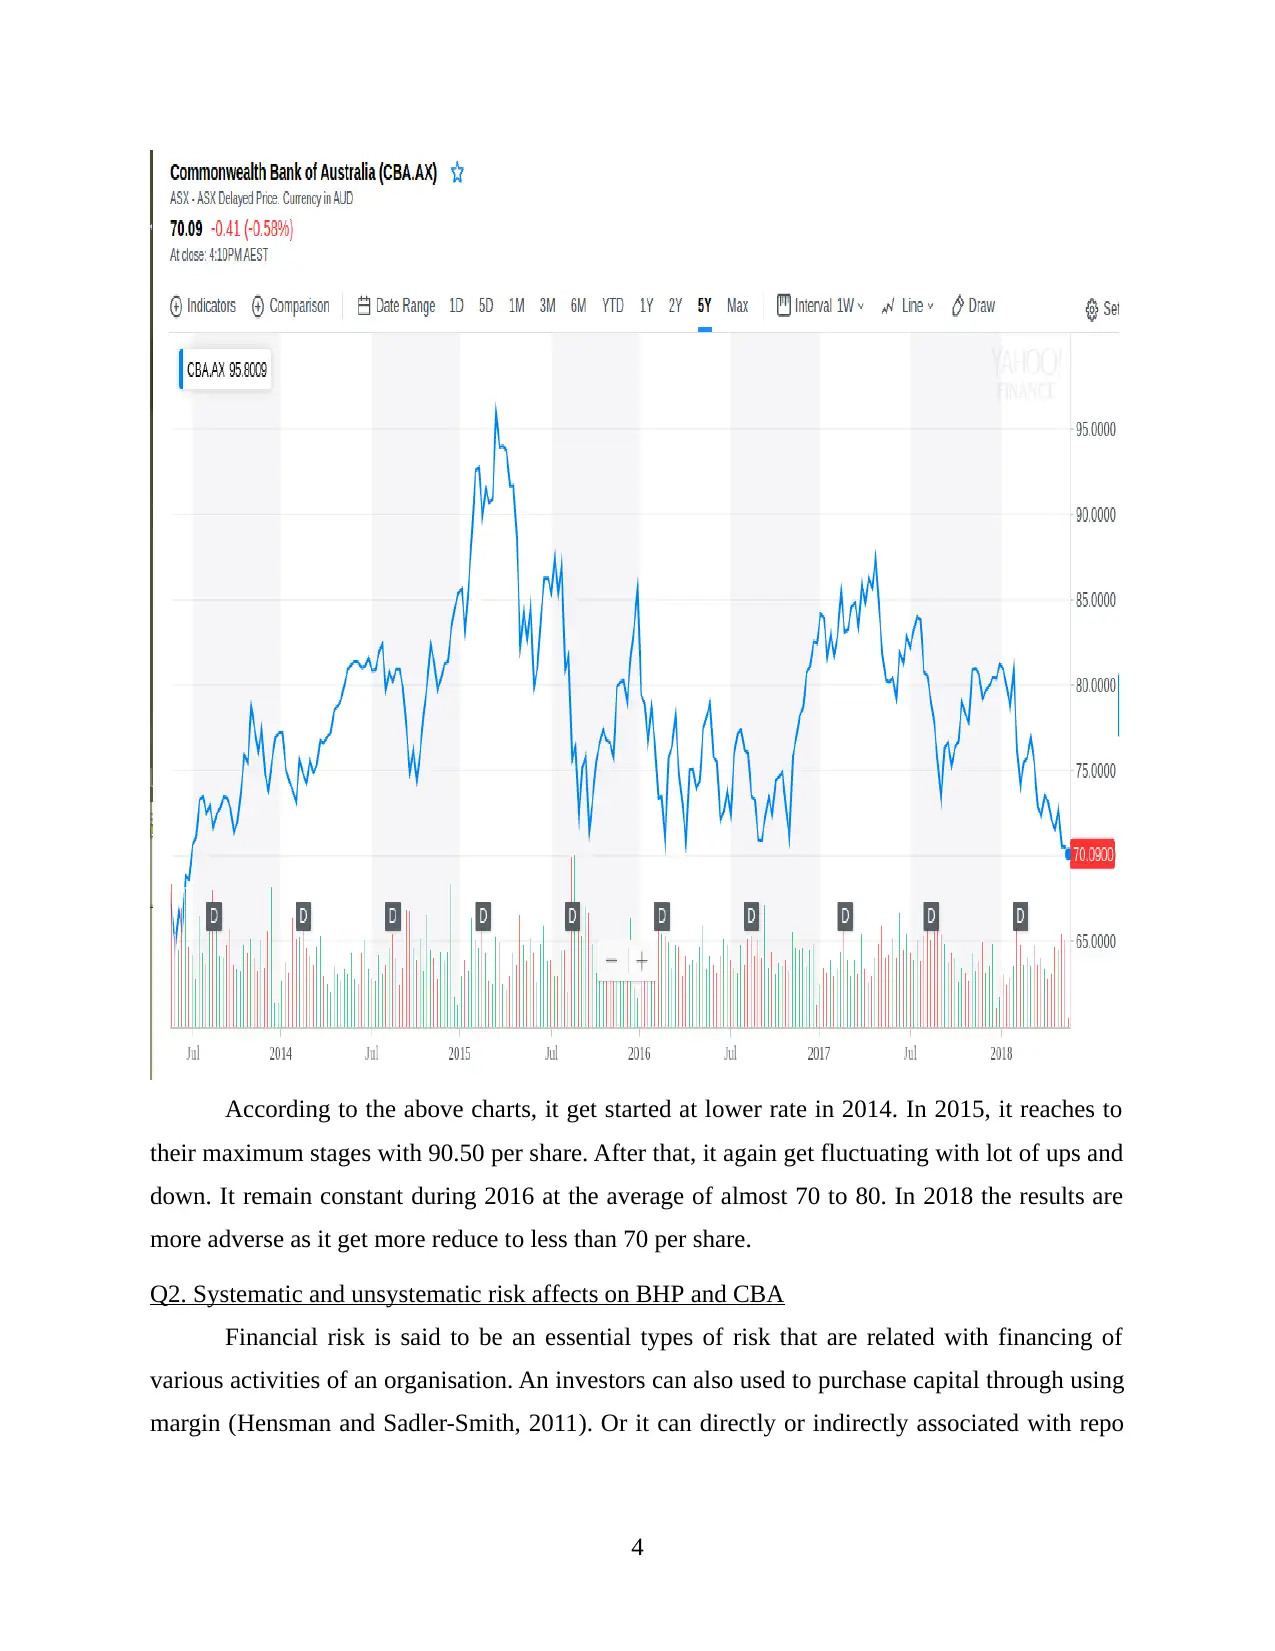
According to the above charts, it get started at lower rate in 2014. In 2015, it reaches to
their maximum stages with 90.50 per share. After that, it again get fluctuating with lot of ups and
down. It remain constant during 2016 at the average of almost 70 to 80. In 2018 the results are
more adverse as it get more reduce to less than 70 per share.
Q2. Systematic and unsystematic risk affects on BHP and CBA
Financial risk is said to be an essential types of risk that are related with financing of
various activities of an organisation. An investors can also used to purchase capital through using
margin (Hensman and Sadler-Smith, 2011). Or it can directly or indirectly associated with repo
4
⊘ This is a preview!⊘
Do you want full access?
Subscribe today to unlock all pages.
Trusted by 1+ million students worldwide
rate and derivative instruments. There are two types of risk that are associated with the company.
Some of them are:
Systematic risk is said to be market risk which is uncertainty inherent to global market
or segment. It consists of day to day fluctuations in stock prices of an organisation. It is used to
measure of risk that is associated with behaviour of investment rather than the reason for their
attitude. The biggest risk determine in case of “BHP Billiton” is associated with Falling Chinese
demand that is have become an important source of international demand for commodities. In
2011, notes BHP Billiton, this would represented 61% of international seaborne iron ore
requirements. 39% of copper demand while rest 40 percent of nickel requirements. It can lead to
slow economy growth that could be results in minimum prices and demand for their products and
negative implication on overall performance of an organisation (Hall, 2012).
In case of commonwealth banks, the prudential regulator has slammed the
commonwealth banks owners, senior management and culture in scathing a well effective report
that lambaste the banks for their general satisfaction, unreasonable complexity and other related
aspects. As per the APRA report, commonwealth bank hits with total $1billion capital charges
during the an accounting period of time.
Unsystematic Risk: These are said to be specific risks that can be diversifier in any kind
of situations. It is a types of uncertainty that comes with any company or sectors in which an
investors used to make investments. This can be overcome through proper diversification. Such
as, a news that is specific to BHP Billiton number of stock, such as sudden strike by the staffs
and employees of a company owner have share in, is appreciable to be unsystematic risk.
While common banks has release a news with detail of various serious cases of systemic
issues within the business that have cost clients and staffs million dollars. The following demand
from RBA governor Philip Lowe, greater transparency. CBA release that a list of problems which
says that putting right for their customers and staffs is primary motive. The issues consists of
selling lines of insurances that could not be paid out over an insurances that will be paid out over
insurances for there home loan customer and defrayal to employees (Dixon, 2012). The CBA
also added a new products to their list that confirming that, it had just inform that ASIC that is
cannot have cancelled insurances to various deceased nations.
5
Paraphrase This Document
Need a fresh take? Get an instant paraphrase of this document with our AI Paraphraser
Relation on share prices with the news over both BHP and CBA
According to specific news that are related with the company would have sever
consequences that lead to make fluctuation in the market prices of both the companies at the
same period of time. The Position of BHP is so effective from starting period of time. There
share prices are remain increasing in the categories of 34 to 40. While commonwealth banks
financial and share market position is much not so stronger as compare to BHP. In the initial
position the share prices fluctuation are not so effective help company to increase growth and
potential in coming period and after 2015, it get increased from 70 to 84 percentage till 2017.
Then after because of impacts in systematic risks that are arises in an organisation had made
impacts on their market position can stated to get reduces (Beck, Demirgüç-Kunt and Merrouche,
2013).
PART B
Q1: Evaluation of current fiscal position of Australian Federal government
Fiscal position is said to be overall deficit that means that Australian government have
total expenses in the year which has exceeded their total earning during the period of time. While
preparation of annual budget both recurrent and non-recurrent norms as well as components are
taken into consideration. National debt obligation is not essentially financially desperate or
property. It is mostly relies on large situations that is uses as a number of term which is used to
measure and compare debts that particular nation. Australia in recent past time has experiences
one of the fastest growing public debts levels in international post global financial crises. It has
been recorded because of large federal budgets deficits driven by upper government spendings.
In respect to determine their sustainable levels, it is vital to examine various implication
those are mentioned in balance sheet. Before formulating some macro-fiscal purpose for
evaluating their sustainable positions it is essential to examine all valuable facts and figures. The
main aim of this is to restore the federal government solvency. Reduce foreign public liabilities.
Or to attain budgetary balances over the period of business cycle. The government medium term
fiscal planning is to attain budget surpluses, an average during the course of economic period of
time. The fiscal strategies is mentioned through the following main policies:
l To make investing a powerful economy through direct government overall spending to
quality investment to boost productivity and participation of overall workforces.
6
l Direct and maintain positive fiscal discipline through controlling expenses to reduce the
governments total share of economy over the period of time.
The local Australian government fiscal planning aims to guide budgets of an organisation
to a sustainable surplus at an effective an responsible pace with a specific target on brining
spending down as a effective proportion of GDP. The government has continuously planning to
attain an effective budget at a sustainable level of expenses, rather than through an unsustainable
enhance in tax burden on Australian economy that will threaten to various people jobs and
successful economic transition (Fiordelisi, Marques-Ibanez and Molyneux, 2011).
Q2: Current Australian yield chart
1
2
3
4
5
6
7
8
9
10
11
12
13
14
15
16
17
18
19
20
21
22
23
24
25
26
27
28
29
30
31
32
33
34
35
36
37
38
39
40
41
42
-10
-5
0
5
10
15
20
25
30
35
5.1
7.4
10.3
6.5
-1.0
10.7
13.3
1.82.9
11.0
16.8
10.5
6.6
9.7
11.6
14.9
13.1
10.1
6.3
26.5
28.8
19.0
17.3
9.59.4
15.4
18.6
16.1
9.49.9
17.6
12.612.7
10.9
8.98.1
2.2
-4.7
1.7
6.0
9.610.2
5.1
2.62.4
7.2
-1.0
5.1
9.6
-0.6
1.3
9.3
12.4
5.9
2.9
6.16.6
9.3
6.6
3.1
-0.7
10.9
6.0
2.4
5.2
1.42.3
4.8
7.3
4.1
-1.4
2.8
11.1
5.15.0
3.8
0.4
1.6
-2.0-6.40.4
4.9
8.17.3
Nominal n.a.
Exponential (
Nominal n.a.)
per cent
change
Real (b) n.a.
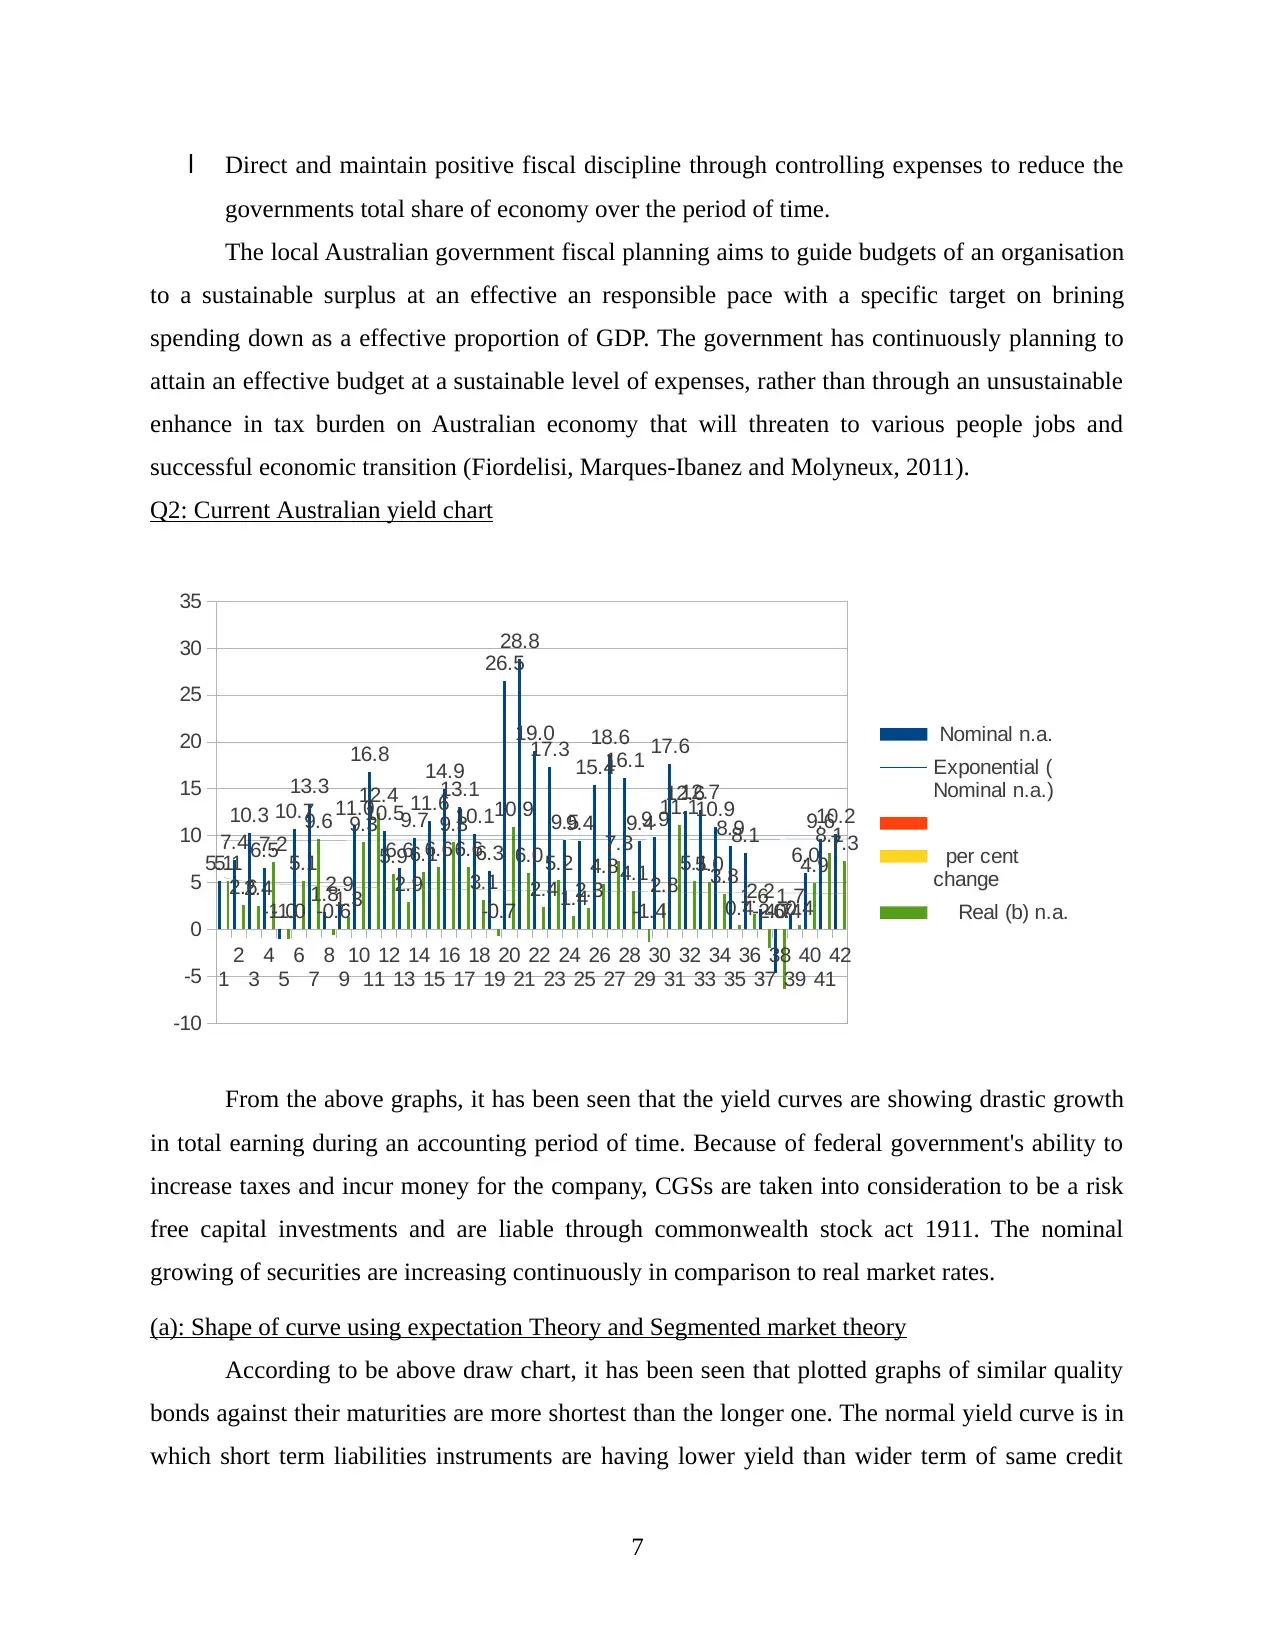
From the above graphs, it has been seen that the yield curves are showing drastic growth
in total earning during an accounting period of time. Because of federal government's ability to
increase taxes and incur money for the company, CGSs are taken into consideration to be a risk
free capital investments and are liable through commonwealth stock act 1911. The nominal
growing of securities are increasing continuously in comparison to real market rates.
(a): Shape of curve using expectation Theory and Segmented market theory
According to be above draw chart, it has been seen that plotted graphs of similar quality
bonds against their maturities are more shortest than the longer one. The normal yield curve is in
which short term liabilities instruments are having lower yield than wider term of same credit
7
governments total share of economy over the period of time.
The local Australian government fiscal planning aims to guide budgets of an organisation
to a sustainable surplus at an effective an responsible pace with a specific target on brining
spending down as a effective proportion of GDP. The government has continuously planning to
attain an effective budget at a sustainable level of expenses, rather than through an unsustainable
enhance in tax burden on Australian economy that will threaten to various people jobs and
successful economic transition (Fiordelisi, Marques-Ibanez and Molyneux, 2011).
Q2: Current Australian yield chart
1
2
3
4
5
6
7
8
9
10
11
12
13
14
15
16
17
18
19
20
21
22
23
24
25
26
27
28
29
30
31
32
33
34
35
36
37
38
39
40
41
42
-10
-5
0
5
10
15
20
25
30
35
5.1
7.4
10.3
6.5
-1.0
10.7
13.3
1.82.9
11.0
16.8
10.5
6.6
9.7
11.6
14.9
13.1
10.1
6.3
26.5
28.8
19.0
17.3
9.59.4
15.4
18.6
16.1
9.49.9
17.6
12.612.7
10.9
8.98.1
2.2
-4.7
1.7
6.0
9.610.2
5.1
2.62.4
7.2
-1.0
5.1
9.6
-0.6
1.3
9.3
12.4
5.9
2.9
6.16.6
9.3
6.6
3.1
-0.7
10.9
6.0
2.4
5.2
1.42.3
4.8
7.3
4.1
-1.4
2.8
11.1
5.15.0
3.8
0.4
1.6
-2.0-6.40.4
4.9
8.17.3
Nominal n.a.
Exponential (
Nominal n.a.)
per cent
change
Real (b) n.a.
From the above graphs, it has been seen that the yield curves are showing drastic growth
in total earning during an accounting period of time. Because of federal government's ability to
increase taxes and incur money for the company, CGSs are taken into consideration to be a risk
free capital investments and are liable through commonwealth stock act 1911. The nominal
growing of securities are increasing continuously in comparison to real market rates.
(a): Shape of curve using expectation Theory and Segmented market theory
According to be above draw chart, it has been seen that plotted graphs of similar quality
bonds against their maturities are more shortest than the longer one. The normal yield curve is in
which short term liabilities instruments are having lower yield than wider term of same credit
7
⊘ This is a preview!⊘
Do you want full access?
Subscribe today to unlock all pages.
Trusted by 1+ million students worldwide
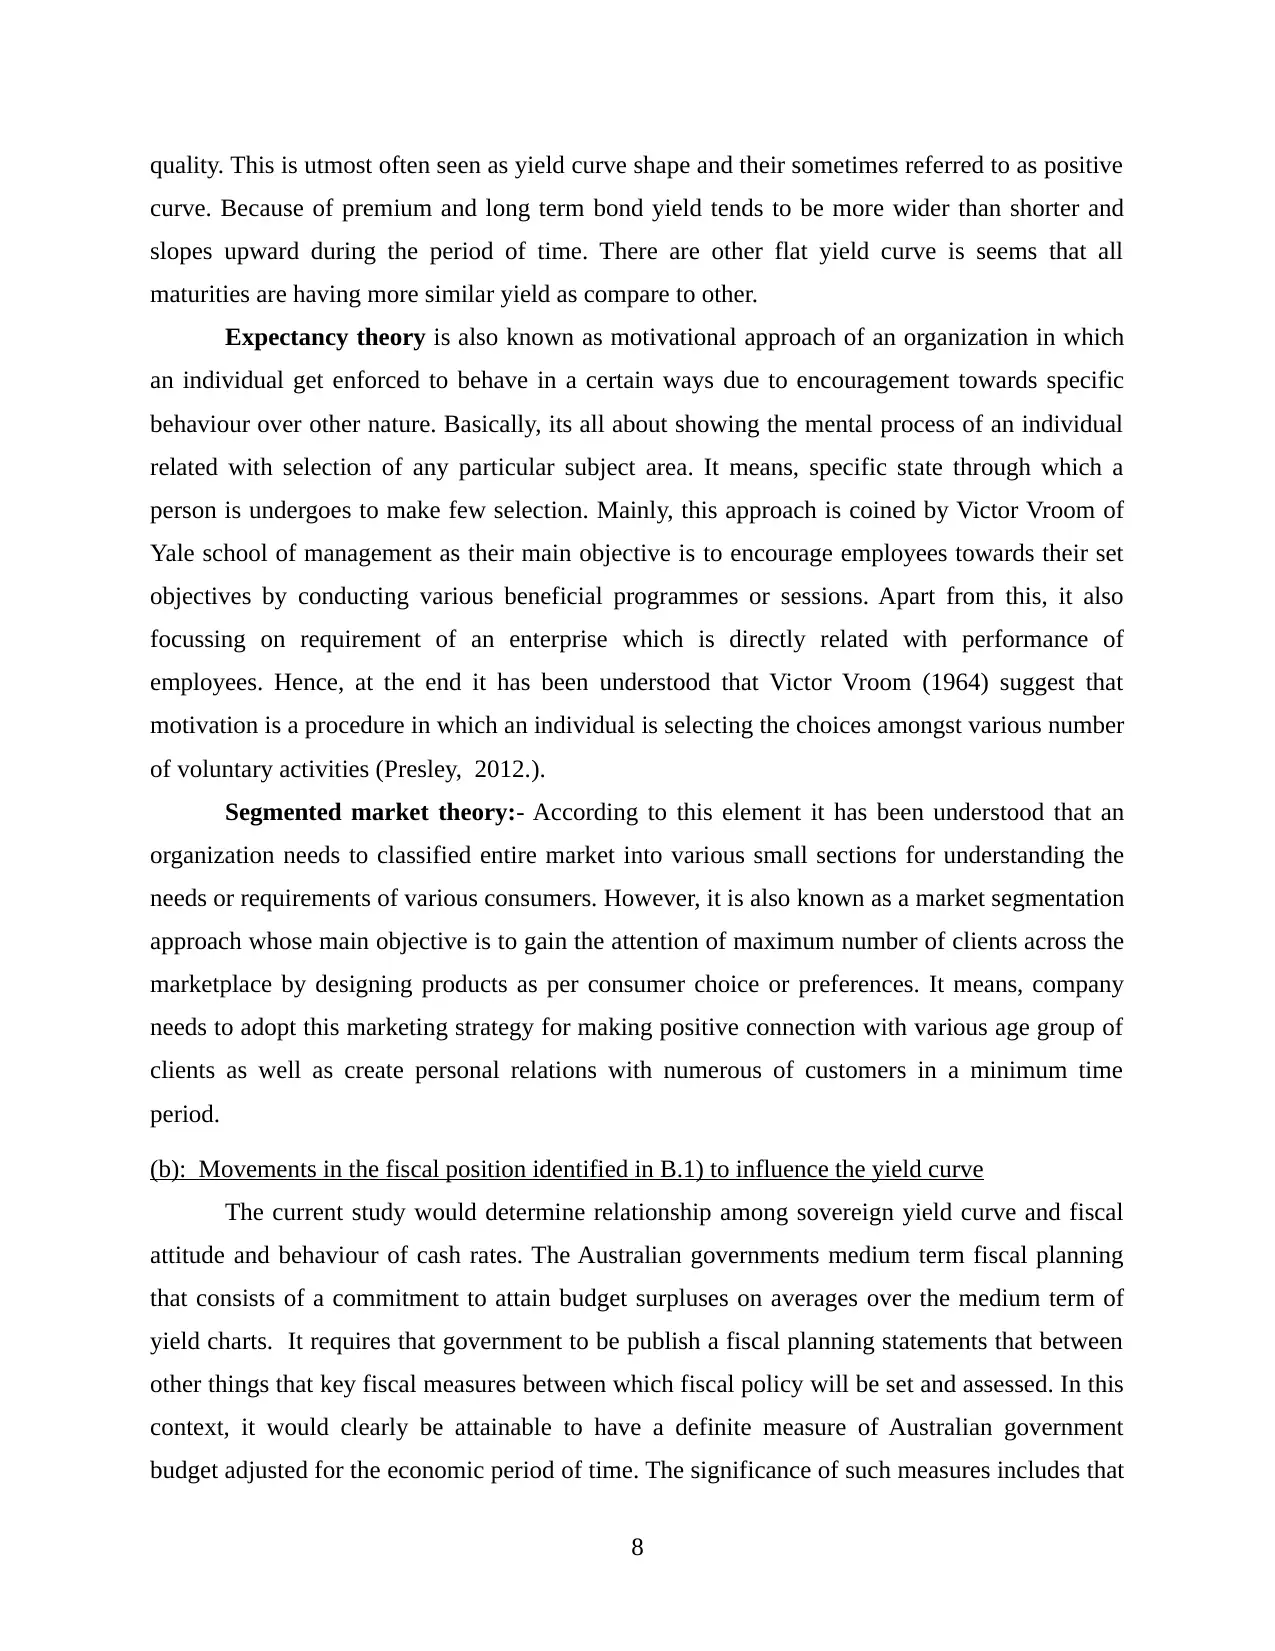
quality. This is utmost often seen as yield curve shape and their sometimes referred to as positive
curve. Because of premium and long term bond yield tends to be more wider than shorter and
slopes upward during the period of time. There are other flat yield curve is seems that all
maturities are having more similar yield as compare to other.
Expectancy theory is also known as motivational approach of an organization in which
an individual get enforced to behave in a certain ways due to encouragement towards specific
behaviour over other nature. Basically, its all about showing the mental process of an individual
related with selection of any particular subject area. It means, specific state through which a
person is undergoes to make few selection. Mainly, this approach is coined by Victor Vroom of
Yale school of management as their main objective is to encourage employees towards their set
objectives by conducting various beneficial programmes or sessions. Apart from this, it also
focussing on requirement of an enterprise which is directly related with performance of
employees. Hence, at the end it has been understood that Victor Vroom (1964) suggest that
motivation is a procedure in which an individual is selecting the choices amongst various number
of voluntary activities (Presley, 2012.).
Segmented market theory:- According to this element it has been understood that an
organization needs to classified entire market into various small sections for understanding the
needs or requirements of various consumers. However, it is also known as a market segmentation
approach whose main objective is to gain the attention of maximum number of clients across the
marketplace by designing products as per consumer choice or preferences. It means, company
needs to adopt this marketing strategy for making positive connection with various age group of
clients as well as create personal relations with numerous of customers in a minimum time
period.
(b): Movements in the fiscal position identified in B.1) to influence the yield curve
The current study would determine relationship among sovereign yield curve and fiscal
attitude and behaviour of cash rates. The Australian governments medium term fiscal planning
that consists of a commitment to attain budget surpluses on averages over the medium term of
yield charts. It requires that government to be publish a fiscal planning statements that between
other things that key fiscal measures between which fiscal policy will be set and assessed. In this
context, it would clearly be attainable to have a definite measure of Australian government
budget adjusted for the economic period of time. The significance of such measures includes that
8
Paraphrase This Document
Need a fresh take? Get an instant paraphrase of this document with our AI Paraphraser
the appropriate fiscal policy would response to structural shifts in the budget position which is
likely to be more different. Even in a definitive measure that could be determine that it would
cover one aspects of an fiscal sustainability. The state of government balances sheet report that
should consists of level of important components of fiscal sustainability. In practices, there are
taken into consideration on the basis of wide range of methods to obtain theses estimates about
outcomes which can varies as per the market trends.
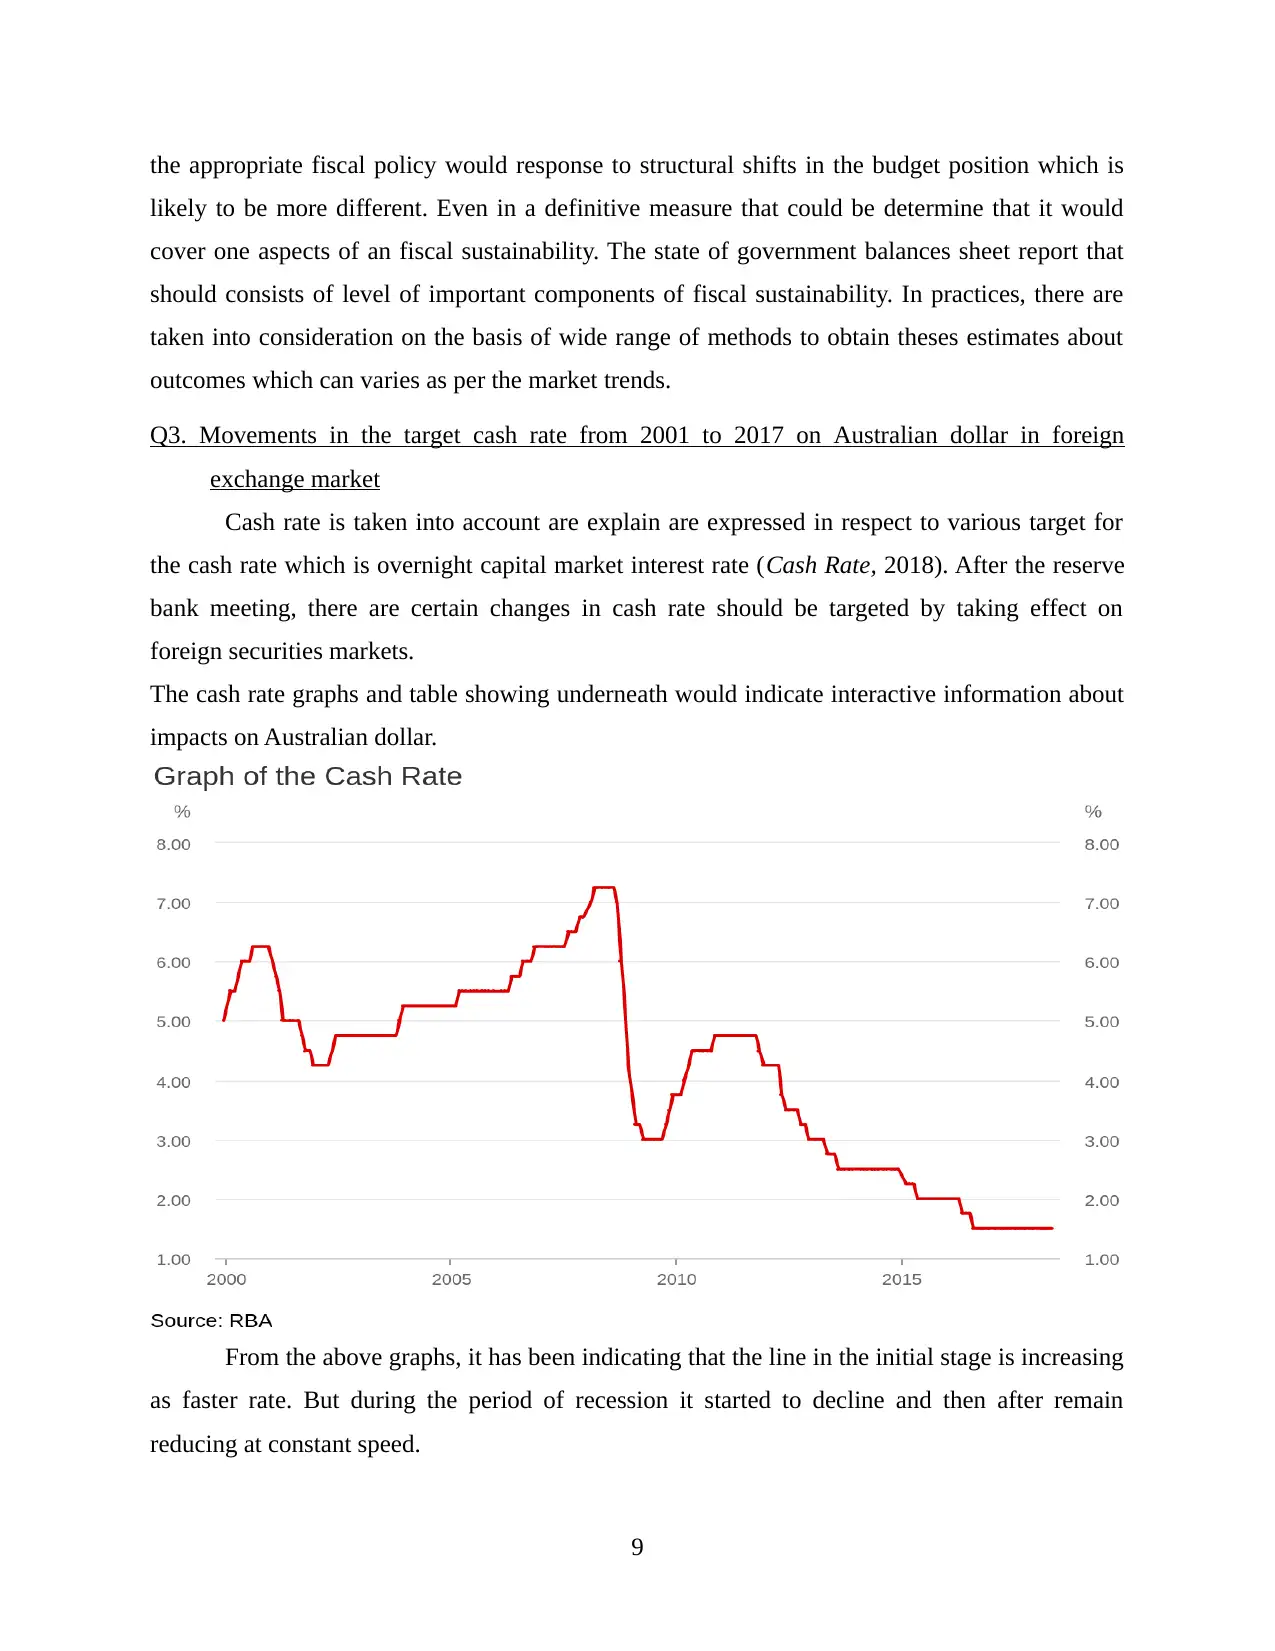
Q3. Movements in the target cash rate from 2001 to 2017 on Australian dollar in foreign
exchange market
Cash rate is taken into account are explain are expressed in respect to various target for
the cash rate which is overnight capital market interest rate (Cash Rate, 2018). After the reserve
bank meeting, there are certain changes in cash rate should be targeted by taking effect on
foreign securities markets.
The cash rate graphs and table showing underneath would indicate interactive information about
impacts on Australian dollar.
From the above graphs, it has been indicating that the line in the initial stage is increasing
as faster rate. But during the period of recession it started to decline and then after remain
reducing at constant speed.
9
likely to be more different. Even in a definitive measure that could be determine that it would
cover one aspects of an fiscal sustainability. The state of government balances sheet report that
should consists of level of important components of fiscal sustainability. In practices, there are
taken into consideration on the basis of wide range of methods to obtain theses estimates about
outcomes which can varies as per the market trends.
Q3. Movements in the target cash rate from 2001 to 2017 on Australian dollar in foreign
exchange market
Cash rate is taken into account are explain are expressed in respect to various target for
the cash rate which is overnight capital market interest rate (Cash Rate, 2018). After the reserve
bank meeting, there are certain changes in cash rate should be targeted by taking effect on
foreign securities markets.
The cash rate graphs and table showing underneath would indicate interactive information about
impacts on Australian dollar.
From the above graphs, it has been indicating that the line in the initial stage is increasing
as faster rate. But during the period of recession it started to decline and then after remain
reducing at constant speed.
9

CONCLUSION
From the above project report, it has been concluded that banking and other vital sectors
are more effective have certain kind of implications. This project determine all necessary issues
and implication that are affecting their growth and financial sustainability during the period of
time. The main motive of this report is to analyse all fact and figures those are associated with
BHP and CBA.
10
⊘ This is a preview!⊘
Do you want full access?
Subscribe today to unlock all pages.
Trusted by 1+ million students worldwide
1 out of 19
Related Documents


Your All-in-One AI-Powered Toolkit for Academic Success.
+13062052269
info@desklib.com
Available 24*7 on WhatsApp / Email
![[object Object]](/_next/static/media/star-bottom.7253800d.svg)
Unlock your academic potential
Copyright © 2020–2026 A2Z Services. All Rights Reserved. Developed and managed by ZUCOL.