Comparative Financial Analysis: BHP Billiton vs Fortescue Metals Group
VerifiedAdded on 2022/09/01
|15
|2982
|20
Report
AI Summary
This report presents a financial analysis of two major mining companies, BHP Billiton Limited and Fortescue Metals Group Limited. The analysis employs various financial tools, including ratio analysis (liquidity, profitability, and capital structure ratios) and common size analysis (both horizontal and vertical), to evaluate and compare the companies' financial performance. The report examines key financial metrics, such as current ratio, quick ratio, net profit margin, return on capital employed, return on equity, and debt-to-equity ratio, over a specific period. It also delves into the interpretation and evaluation of these ratios to assess the financial health, efficiency, and stability of each company. Furthermore, the study includes a comparative analysis of the income statements and balance sheets using common size analysis to identify trends and differences in financial structure and performance between the two organizations. The findings highlight the strengths and weaknesses of each company, offering insights into their financial strategies and overall market positions.
ACCOUNTING AND FINANCE
Paraphrase This Document
Need a fresh take? Get an instant paraphrase of this document with our AI Paraphraser
Contents
Introduction................................................................................................................................2
BHP Billiton limited..................................................................................................................2
Fortescue metals group..............................................................................................................2
Interpretation and evaluation......................................................................................................3
Ratio Analysis............................................................................................................................3
Horizontal common size analysis...............................................................................................9
Vertical common size analysis.................................................................................................11
References................................................................................................................................13
Introduction
Financial analysis is the procedure of evaluating projects, budgets, and businesses to
determine the suitability and performance. The report analyse the financial analysis of two
companies of mining industry. Financial analysis conducts by focusing on ratios and
conducting comparison between both the organisations named as BHP Billiton limited and
Fortescue metal group limited. For vertical and horizontal analysis, common size analysis is
the way through which each element of the financial statement is measured as a proportion
base for same period. For this, the company can use and analyse through balance sheet and
income statement. Moreover, it is important to conduct common size financial statement
analysis displaying all the particular items as a proportion of common figure rather than the
exact numerical figures. This analysis is conducted to examine the financial statement by
comparing it within the organisation (Brigham, & Houston, 2012).
BHP Billiton limited
BHP Billiton limited is ASX registered multinational mining, petroleum and Metal Company.
The company is headquartered in Victoria, Australia. In 2017, BHP Billiton is the largest
mining organisation based on market capitalisation. The company offers coal, petroleum,
natural gas, uranium, and nickel with current employee base of 62000 people. In 2018, the
revenue generated was 43.638 billion dollars. In 2018, the operating income is US$ 17.561
billion. In 2018, net income is US$ 4.823 billion in 2018. Total assets owned is estimated at
US$ 111993000000 (BHP Billiton limited, 2018).
Fortescue metals group
Fortescue metal group limited is an ASX registered iron ore organisation. Fortescue is fourth
largest producer of iron ore after Rio Tinto, and BHP Billiton. The company is headquartered
⊘ This is a preview!⊘
Do you want full access?
Subscribe today to unlock all pages.
Trusted by 1+ million students worldwide
in Western Australia by offering products such as Steel, Copper, Gold, Iron ore and Lithium.
The organisation was founded in 2003. Currently, the company has been serving worldwide.
In 2019, the revenue is estimated at 14.37 billion dollars. In 2019, the operating income is
nearly 8.84 billion dollars. In 2019, net income is estimated at $4.71 billion. In 2019, total
assets are estimated at $22.26 billion and total equity is estimated at $22.26 billion. Currently,
the company has an employee base of 5455 (Fortescue metal group, 2018).
Interpretation and evaluation
Ratio Analysis
For analysis, first tool used is ratio analysis.
For the liquidity analysis, liquidity ratios are calculated, which are among the class of
financial metrics utilised to predict the company`s ability to pay off the current obligations.
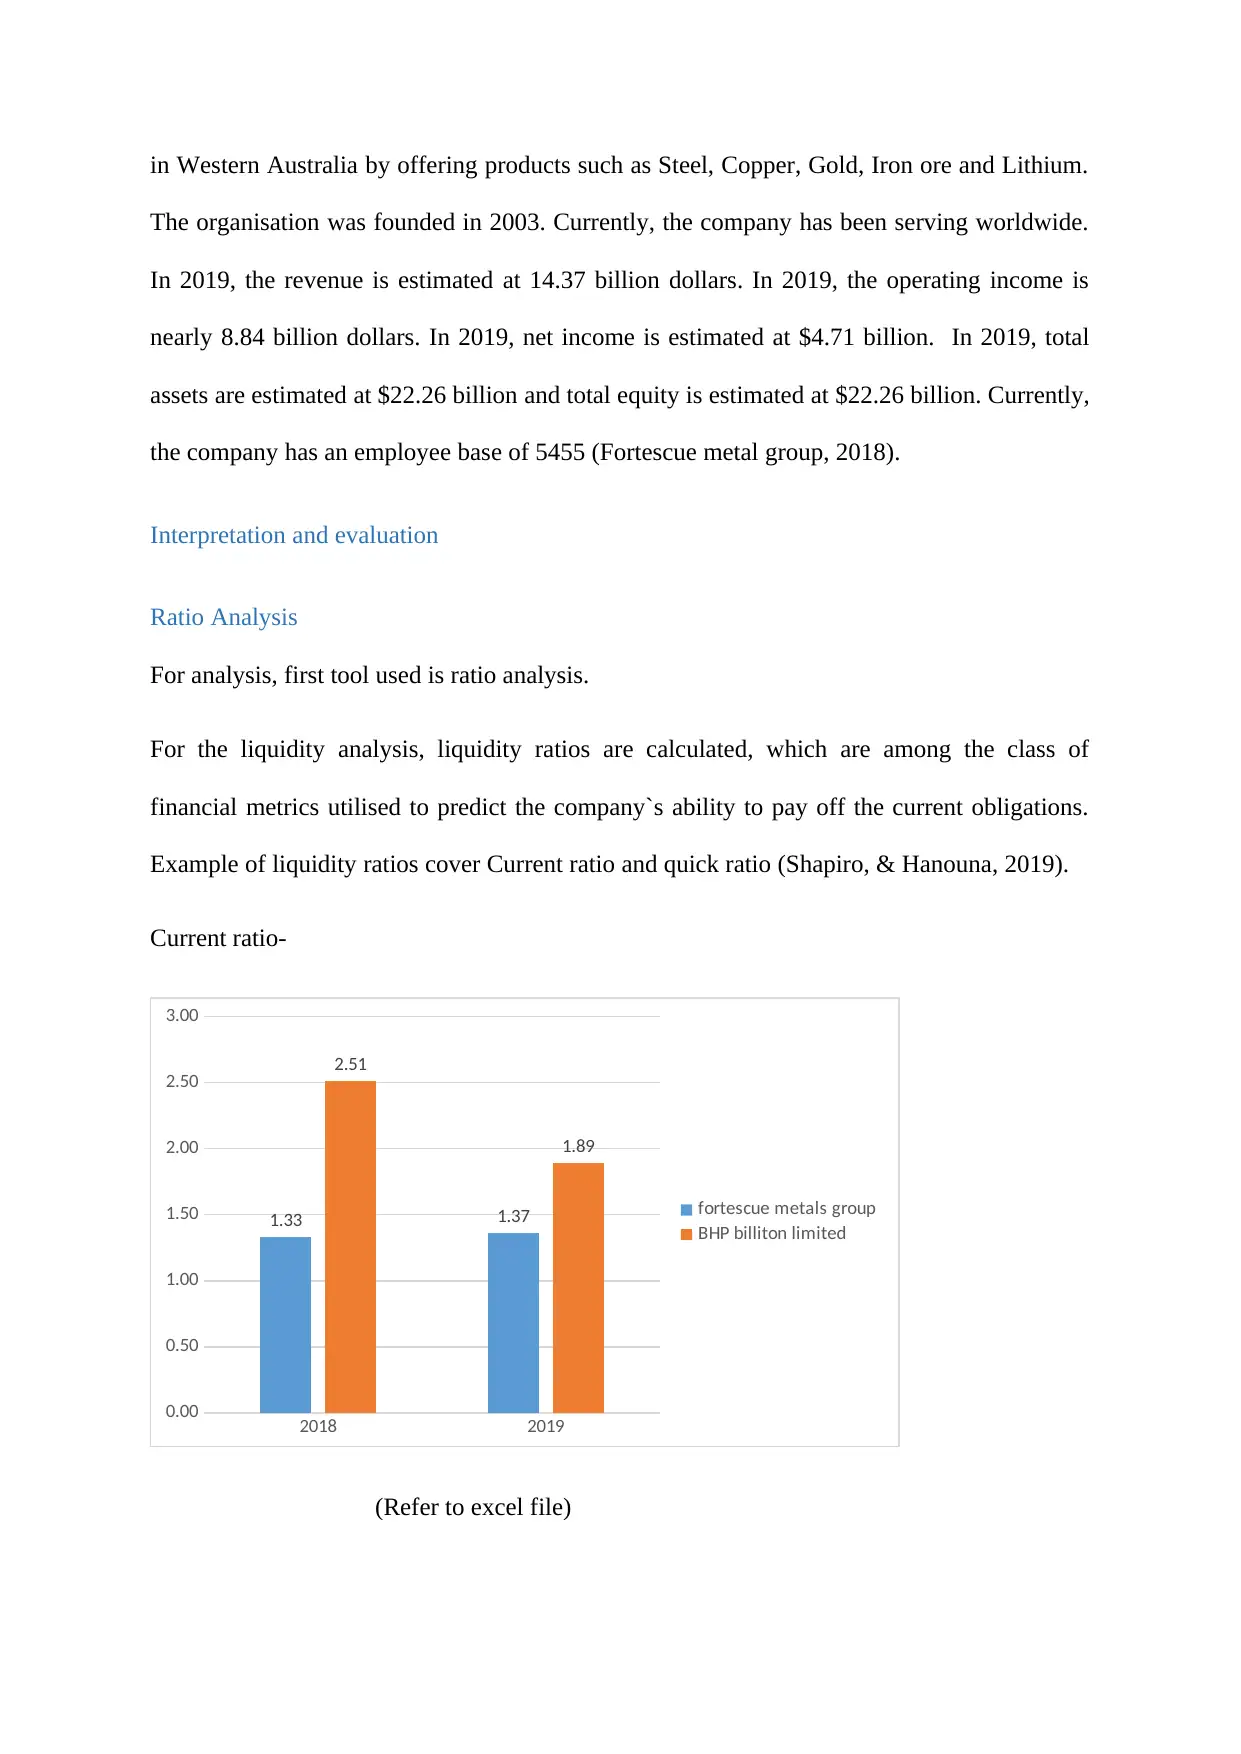
Example of liquidity ratios cover Current ratio and quick ratio (Shapiro, & Hanouna, 2019).
Current ratio-
2018 2019
0.00
0.50
1.00
1.50
2.00
2.50
3.00
1.33 1.37
2.51
1.89
fortescue metals group
BHP billiton limited
(Refer to excel file)
The organisation was founded in 2003. Currently, the company has been serving worldwide.
In 2019, the revenue is estimated at 14.37 billion dollars. In 2019, the operating income is
nearly 8.84 billion dollars. In 2019, net income is estimated at $4.71 billion. In 2019, total
assets are estimated at $22.26 billion and total equity is estimated at $22.26 billion. Currently,
the company has an employee base of 5455 (Fortescue metal group, 2018).
Interpretation and evaluation
Ratio Analysis
For analysis, first tool used is ratio analysis.
For the liquidity analysis, liquidity ratios are calculated, which are among the class of
financial metrics utilised to predict the company`s ability to pay off the current obligations.
Example of liquidity ratios cover Current ratio and quick ratio (Shapiro, & Hanouna, 2019).
Current ratio-
2018 2019
0.00
0.50
1.00
1.50
2.00
2.50
3.00
1.33 1.37
2.51
1.89
fortescue metals group
BHP billiton limited
(Refer to excel file)
Paraphrase This Document
Need a fresh take? Get an instant paraphrase of this document with our AI Paraphraser
This ratio determines the ability of the organisation to pay off its current obligations claimed
against the current assets of company. The ideal ratio of current ratio is 2:1.
For the analysis, Fortescue metal group generates a current ratio of 1.33 in 2018, and 1.37 in
2019. The company`s current assets are more than current liabilities. The company holds 30
percent more of the current assets to the current liabilities. It is suggested that the company
has to improve the maintenance of current assets such as it can increase its sales to increase
cash and cash equivalents or net receivables (BHP Billiton limited, 2018).
Current ratio of BHP Billiton is generated as 2.51 in 2018 and 1.89 in 2019. Furthermore, the
company has been appropriately maintaining the current assets. For 2018, the company holds
1.5 times of current assets as compared to current liabilities, which is more than ideal ratio.
Therefore, absolute increasing current ratio is not a good sign of maintaining more working
capital and not paying the current obligations. Between both the companies, BHP Billiton
limited has good hold on liquidity ratios (Błaszczyk, & Orawiec, 2011).
Quick ratio-
2018 2019
0.00
0.50
1.00
1.50
2.00
2.50
0.93
1.07
2.24
1.58
fortescue metals group
BHP billiton limited
(Refer to excel file)
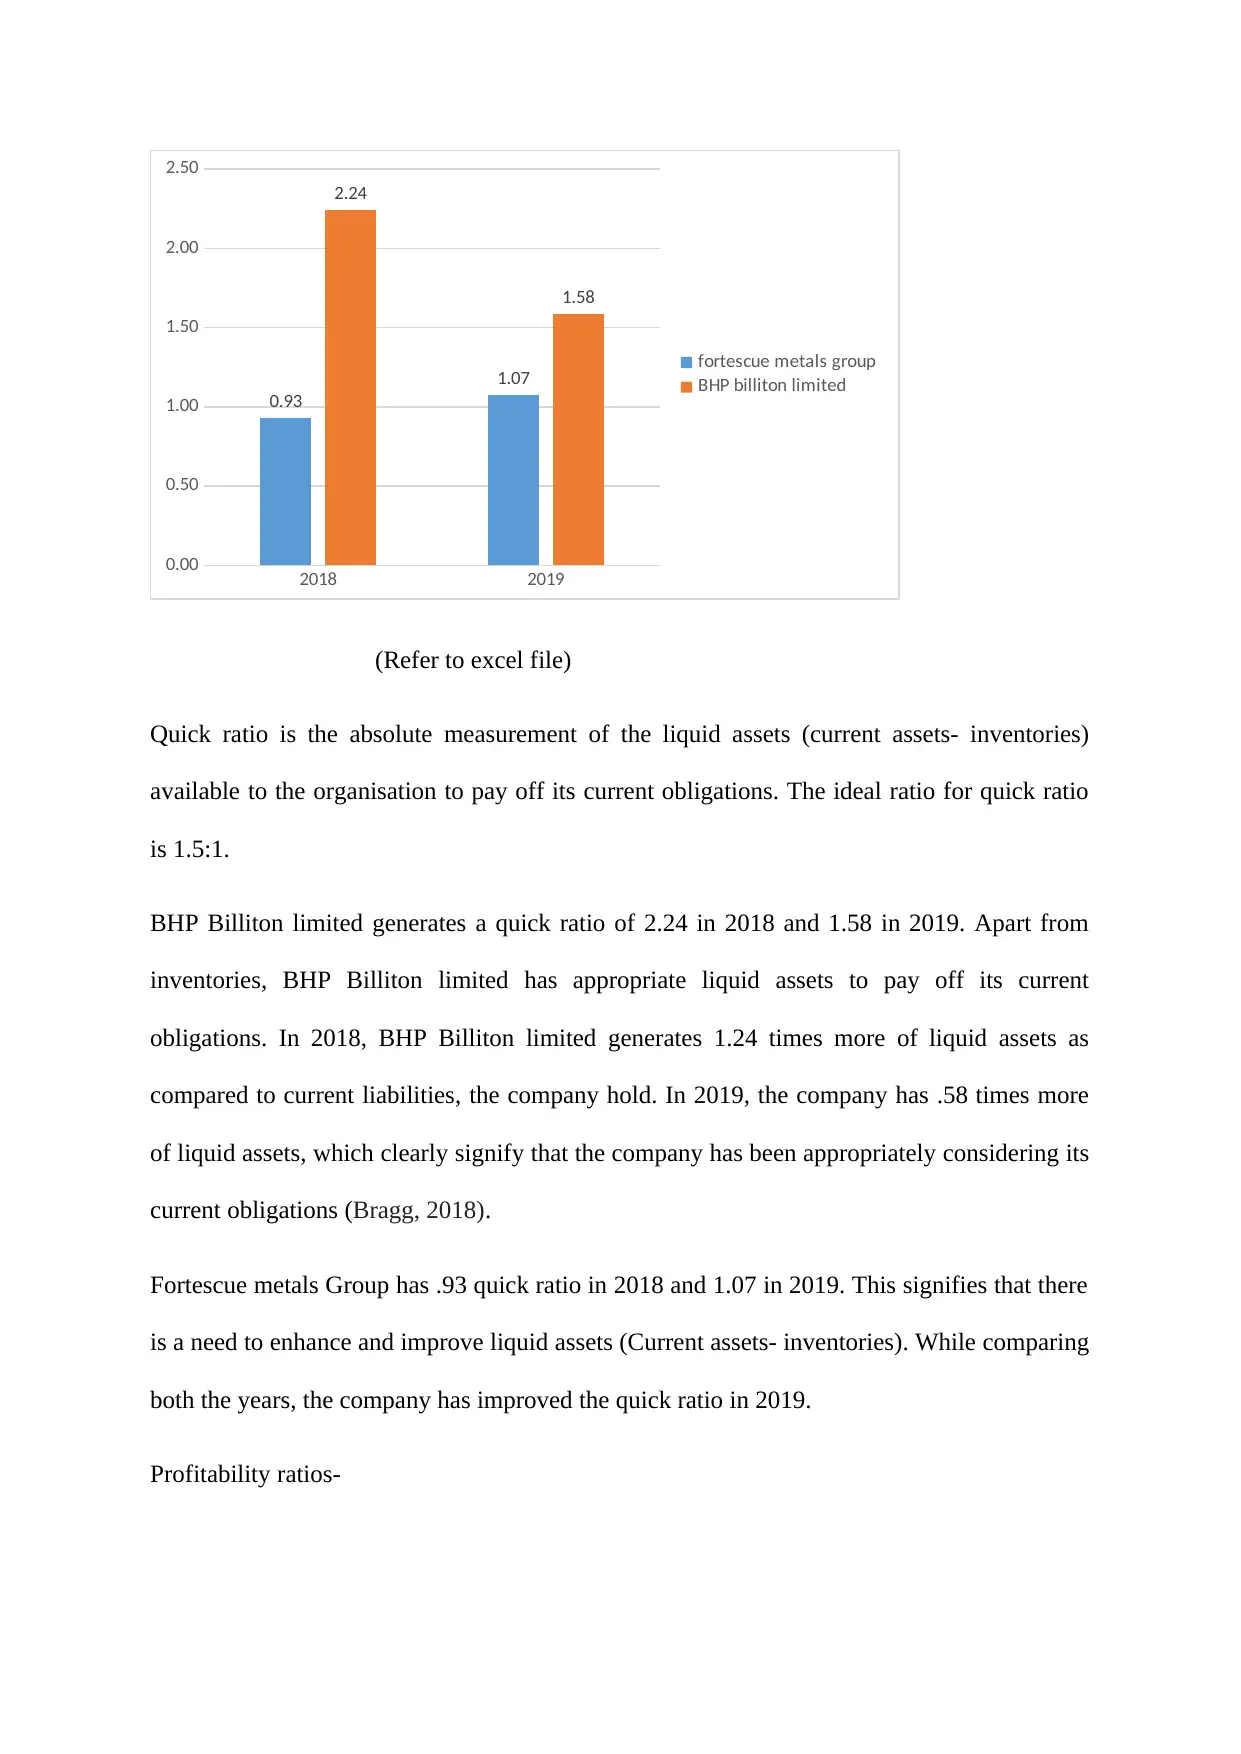
Quick ratio is the absolute measurement of the liquid assets (current assets- inventories)
available to the organisation to pay off its current obligations. The ideal ratio for quick ratio
is 1.5:1.
BHP Billiton limited generates a quick ratio of 2.24 in 2018 and 1.58 in 2019. Apart from
inventories, BHP Billiton limited has appropriate liquid assets to pay off its current
obligations. In 2018, BHP Billiton limited generates 1.24 times more of liquid assets as
compared to current liabilities, the company hold. In 2019, the company has .58 times more
of liquid assets, which clearly signify that the company has been appropriately considering its
current obligations (Bragg, 2018).
Fortescue metals Group has .93 quick ratio in 2018 and 1.07 in 2019. This signifies that there
is a need to enhance and improve liquid assets (Current assets- inventories). While comparing
both the years, the company has improved the quick ratio in 2019.
Profitability ratios-
0.00
0.50
1.00
1.50
2.00
2.50
0.93
1.07
2.24
1.58
fortescue metals group
BHP billiton limited
(Refer to excel file)
Quick ratio is the absolute measurement of the liquid assets (current assets- inventories)
available to the organisation to pay off its current obligations. The ideal ratio for quick ratio
is 1.5:1.
BHP Billiton limited generates a quick ratio of 2.24 in 2018 and 1.58 in 2019. Apart from
inventories, BHP Billiton limited has appropriate liquid assets to pay off its current
obligations. In 2018, BHP Billiton limited generates 1.24 times more of liquid assets as
compared to current liabilities, the company hold. In 2019, the company has .58 times more
of liquid assets, which clearly signify that the company has been appropriately considering its
current obligations (Bragg, 2018).
Fortescue metals Group has .93 quick ratio in 2018 and 1.07 in 2019. This signifies that there
is a need to enhance and improve liquid assets (Current assets- inventories). While comparing
both the years, the company has improved the quick ratio in 2019.
Profitability ratios-
⊘ This is a preview!⊘
Do you want full access?
Subscribe today to unlock all pages.
Trusted by 1+ million students worldwide
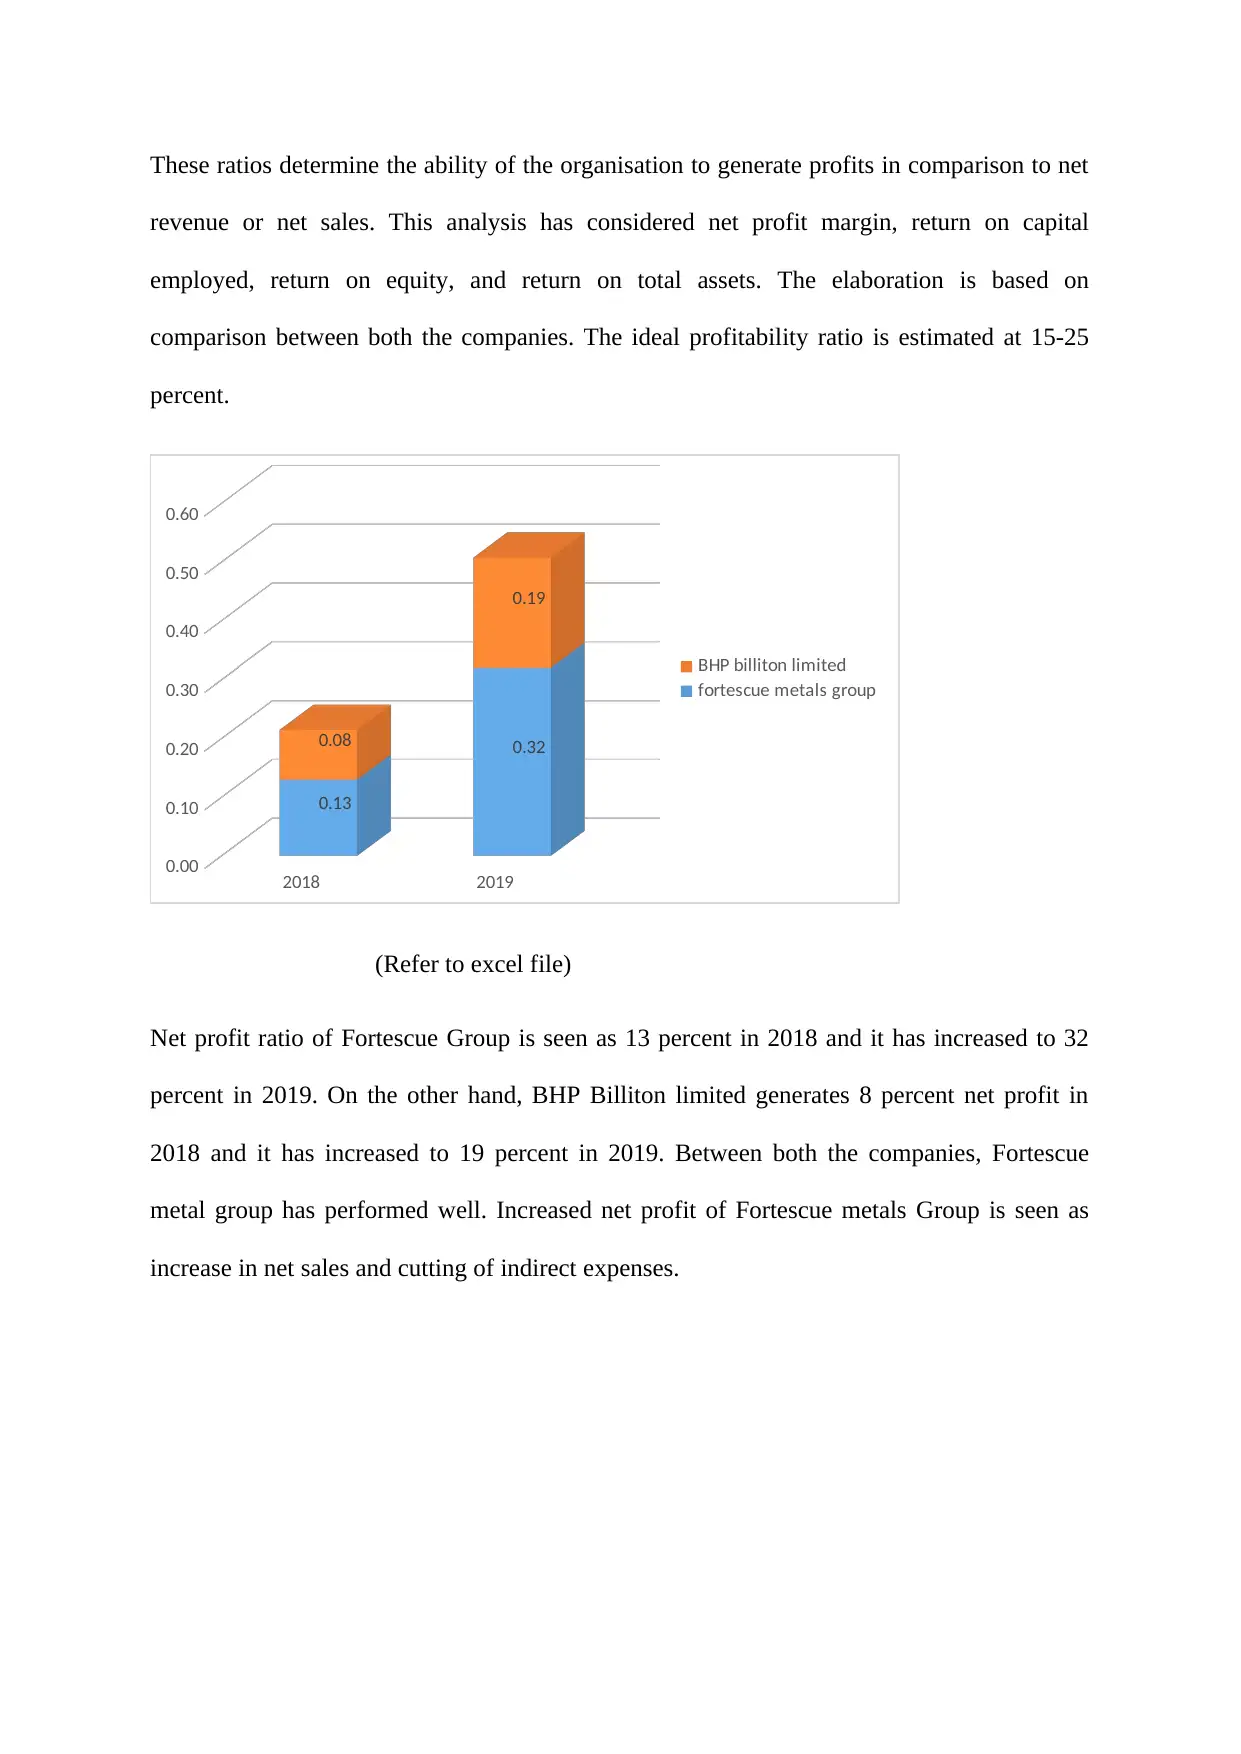
These ratios determine the ability of the organisation to generate profits in comparison to net
revenue or net sales. This analysis has considered net profit margin, return on capital
employed, return on equity, and return on total assets. The elaboration is based on
comparison between both the companies. The ideal profitability ratio is estimated at 15-25
percent.
2018 2019
0.00
0.10
0.20
0.30
0.40
0.50
0.60
0.13
0.320.08
0.19
BHP billiton limited
fortescue metals group
(Refer to excel file)
Net profit ratio of Fortescue Group is seen as 13 percent in 2018 and it has increased to 32
percent in 2019. On the other hand, BHP Billiton limited generates 8 percent net profit in
2018 and it has increased to 19 percent in 2019. Between both the companies, Fortescue
metal group has performed well. Increased net profit of Fortescue metals Group is seen as
increase in net sales and cutting of indirect expenses.
Paraphrase This Document
Need a fresh take? Get an instant paraphrase of this document with our AI Paraphraser
2018 2019
0.00
0.05
0.10
0.15
0.20
0.25
0.30
0.35
0.40
0.45
0.11
0.270.06
0.16
BHP billiton limited
fortescue metals group
(Refer to excel file)
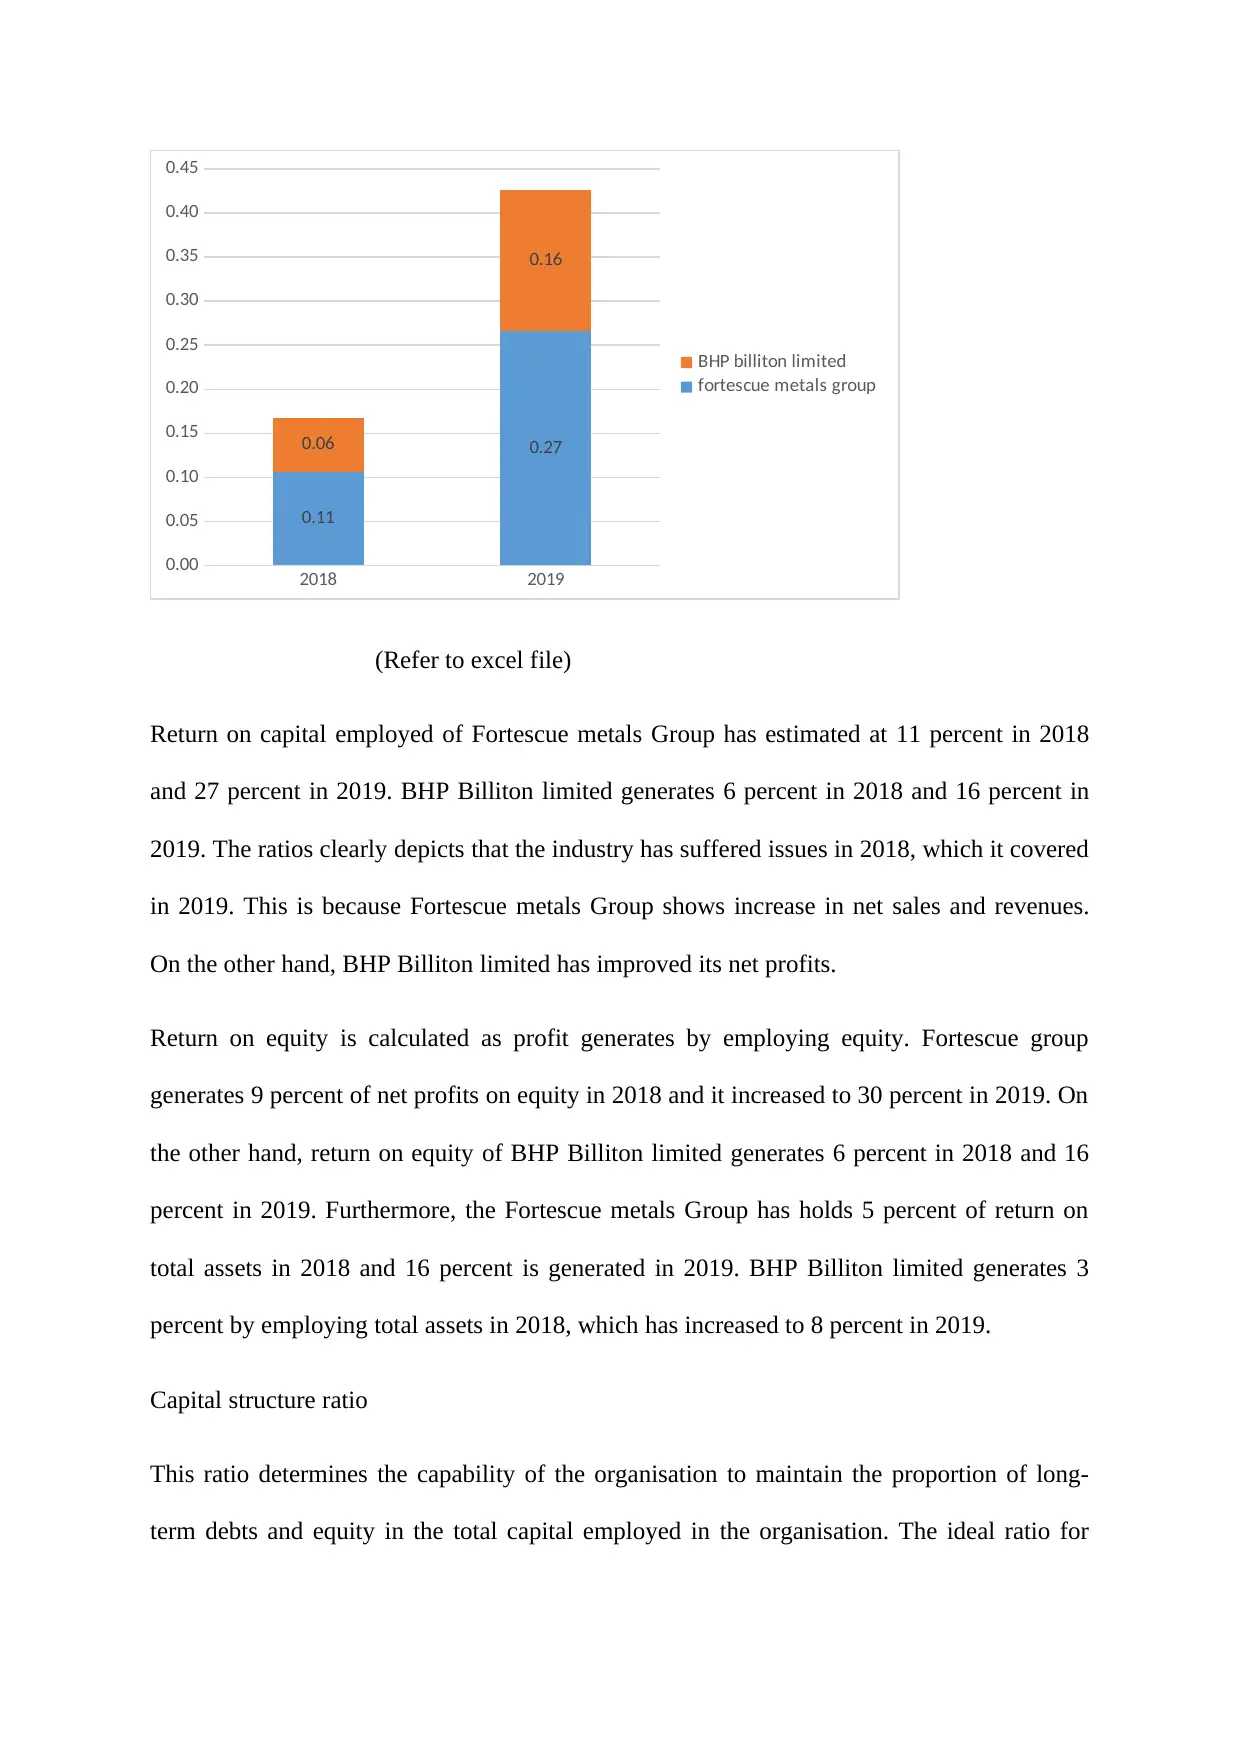
Return on capital employed of Fortescue metals Group has estimated at 11 percent in 2018
and 27 percent in 2019. BHP Billiton limited generates 6 percent in 2018 and 16 percent in
2019. The ratios clearly depicts that the industry has suffered issues in 2018, which it covered
in 2019. This is because Fortescue metals Group shows increase in net sales and revenues.
On the other hand, BHP Billiton limited has improved its net profits.
Return on equity is calculated as profit generates by employing equity. Fortescue group
generates 9 percent of net profits on equity in 2018 and it increased to 30 percent in 2019. On
the other hand, return on equity of BHP Billiton limited generates 6 percent in 2018 and 16
percent in 2019. Furthermore, the Fortescue metals Group has holds 5 percent of return on
total assets in 2018 and 16 percent is generated in 2019. BHP Billiton limited generates 3
percent by employing total assets in 2018, which has increased to 8 percent in 2019.
Capital structure ratio
This ratio determines the capability of the organisation to maintain the proportion of long-
term debts and equity in the total capital employed in the organisation. The ideal ratio for
0.00
0.05
0.10
0.15
0.20
0.25
0.30
0.35
0.40
0.45
0.11
0.270.06
0.16
BHP billiton limited
fortescue metals group
(Refer to excel file)
Return on capital employed of Fortescue metals Group has estimated at 11 percent in 2018
and 27 percent in 2019. BHP Billiton limited generates 6 percent in 2018 and 16 percent in
2019. The ratios clearly depicts that the industry has suffered issues in 2018, which it covered
in 2019. This is because Fortescue metals Group shows increase in net sales and revenues.
On the other hand, BHP Billiton limited has improved its net profits.
Return on equity is calculated as profit generates by employing equity. Fortescue group
generates 9 percent of net profits on equity in 2018 and it increased to 30 percent in 2019. On
the other hand, return on equity of BHP Billiton limited generates 6 percent in 2018 and 16
percent in 2019. Furthermore, the Fortescue metals Group has holds 5 percent of return on
total assets in 2018 and 16 percent is generated in 2019. BHP Billiton limited generates 3
percent by employing total assets in 2018, which has increased to 8 percent in 2019.
Capital structure ratio
This ratio determines the capability of the organisation to maintain the proportion of long-
term debts and equity in the total capital employed in the organisation. The ideal ratio for
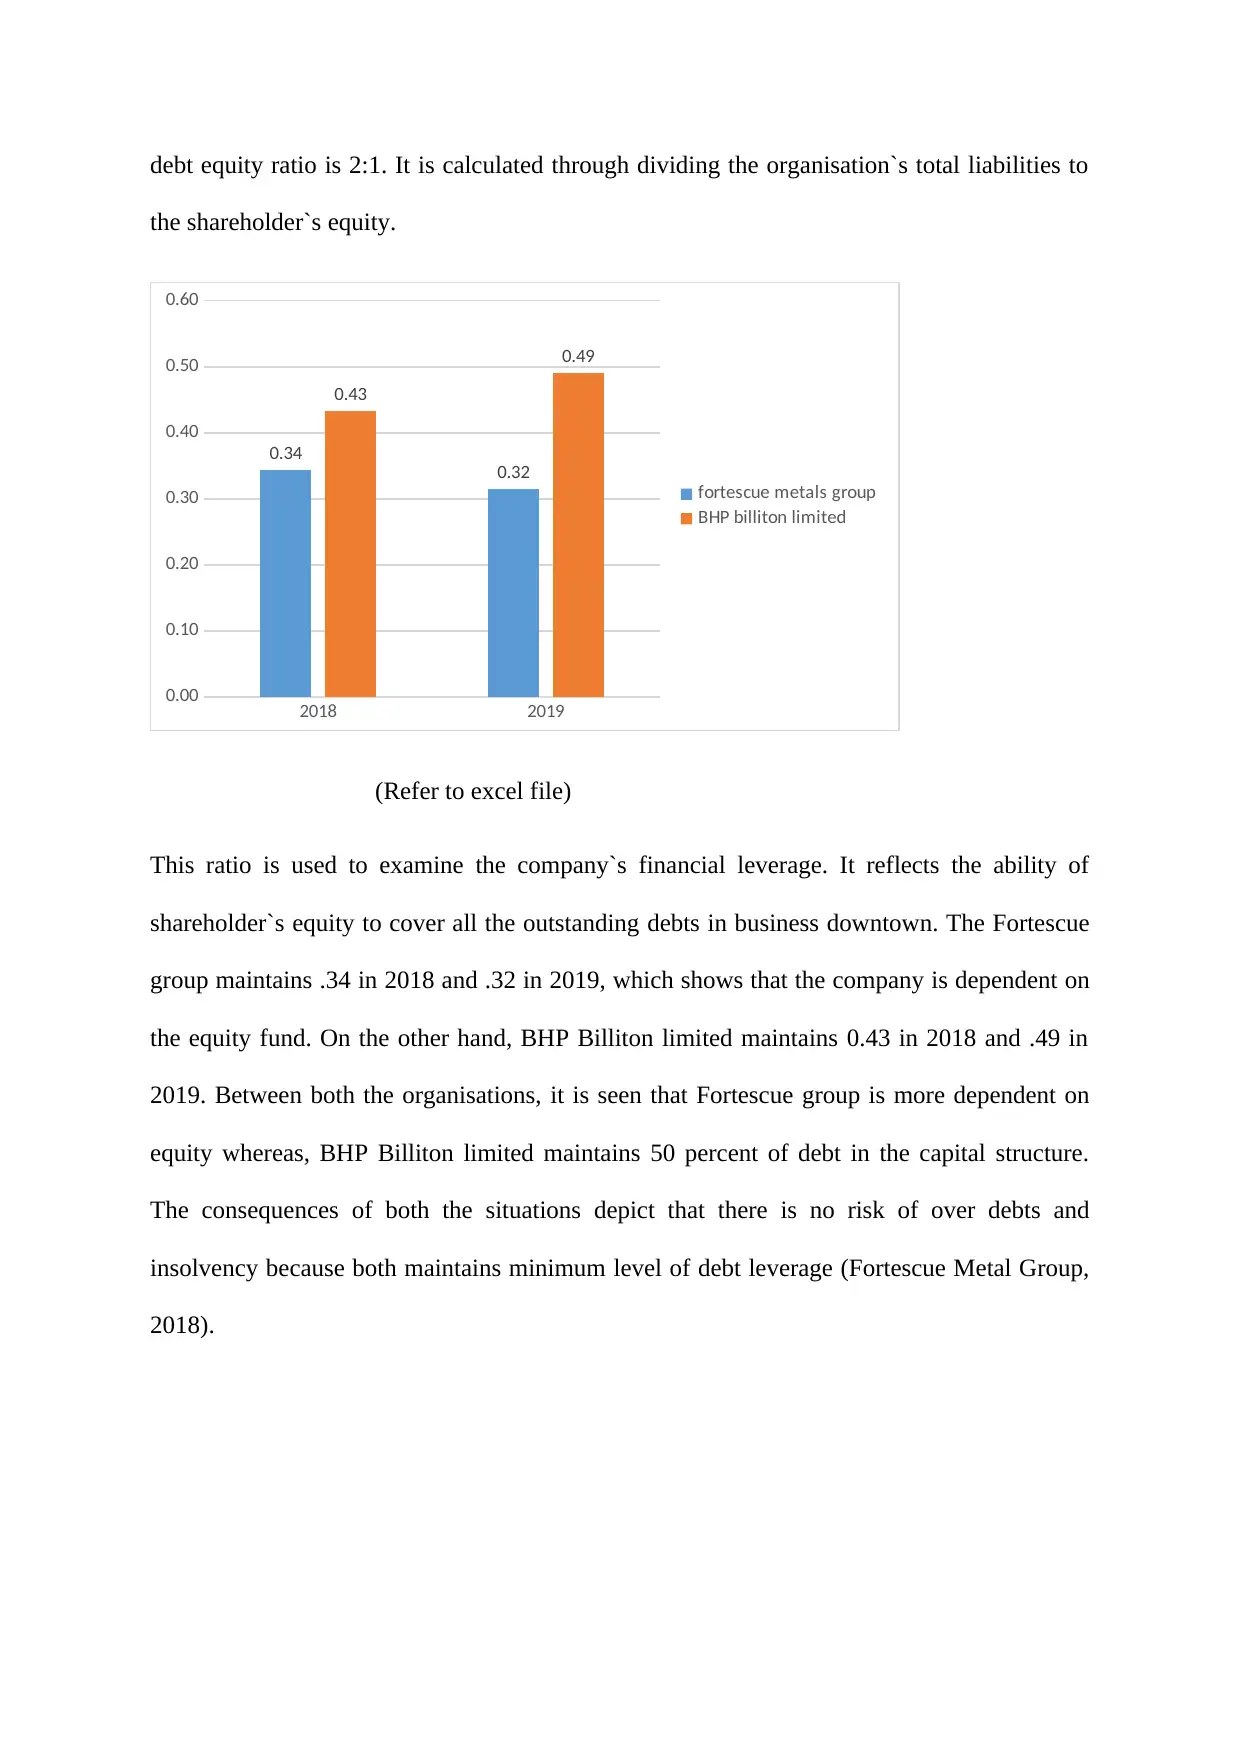
debt equity ratio is 2:1. It is calculated through dividing the organisation`s total liabilities to
the shareholder`s equity.
2018 2019
0.00
0.10
0.20
0.30
0.40
0.50
0.60
0.34
0.32
0.43
0.49
fortescue metals group
BHP billiton limited
(Refer to excel file)
This ratio is used to examine the company`s financial leverage. It reflects the ability of
shareholder`s equity to cover all the outstanding debts in business downtown. The Fortescue
group maintains .34 in 2018 and .32 in 2019, which shows that the company is dependent on
the equity fund. On the other hand, BHP Billiton limited maintains 0.43 in 2018 and .49 in
2019. Between both the organisations, it is seen that Fortescue group is more dependent on
equity whereas, BHP Billiton limited maintains 50 percent of debt in the capital structure.
The consequences of both the situations depict that there is no risk of over debts and
insolvency because both maintains minimum level of debt leverage (Fortescue Metal Group,
2018).
⊘ This is a preview!⊘
Do you want full access?
Subscribe today to unlock all pages.
Trusted by 1+ million students worldwide
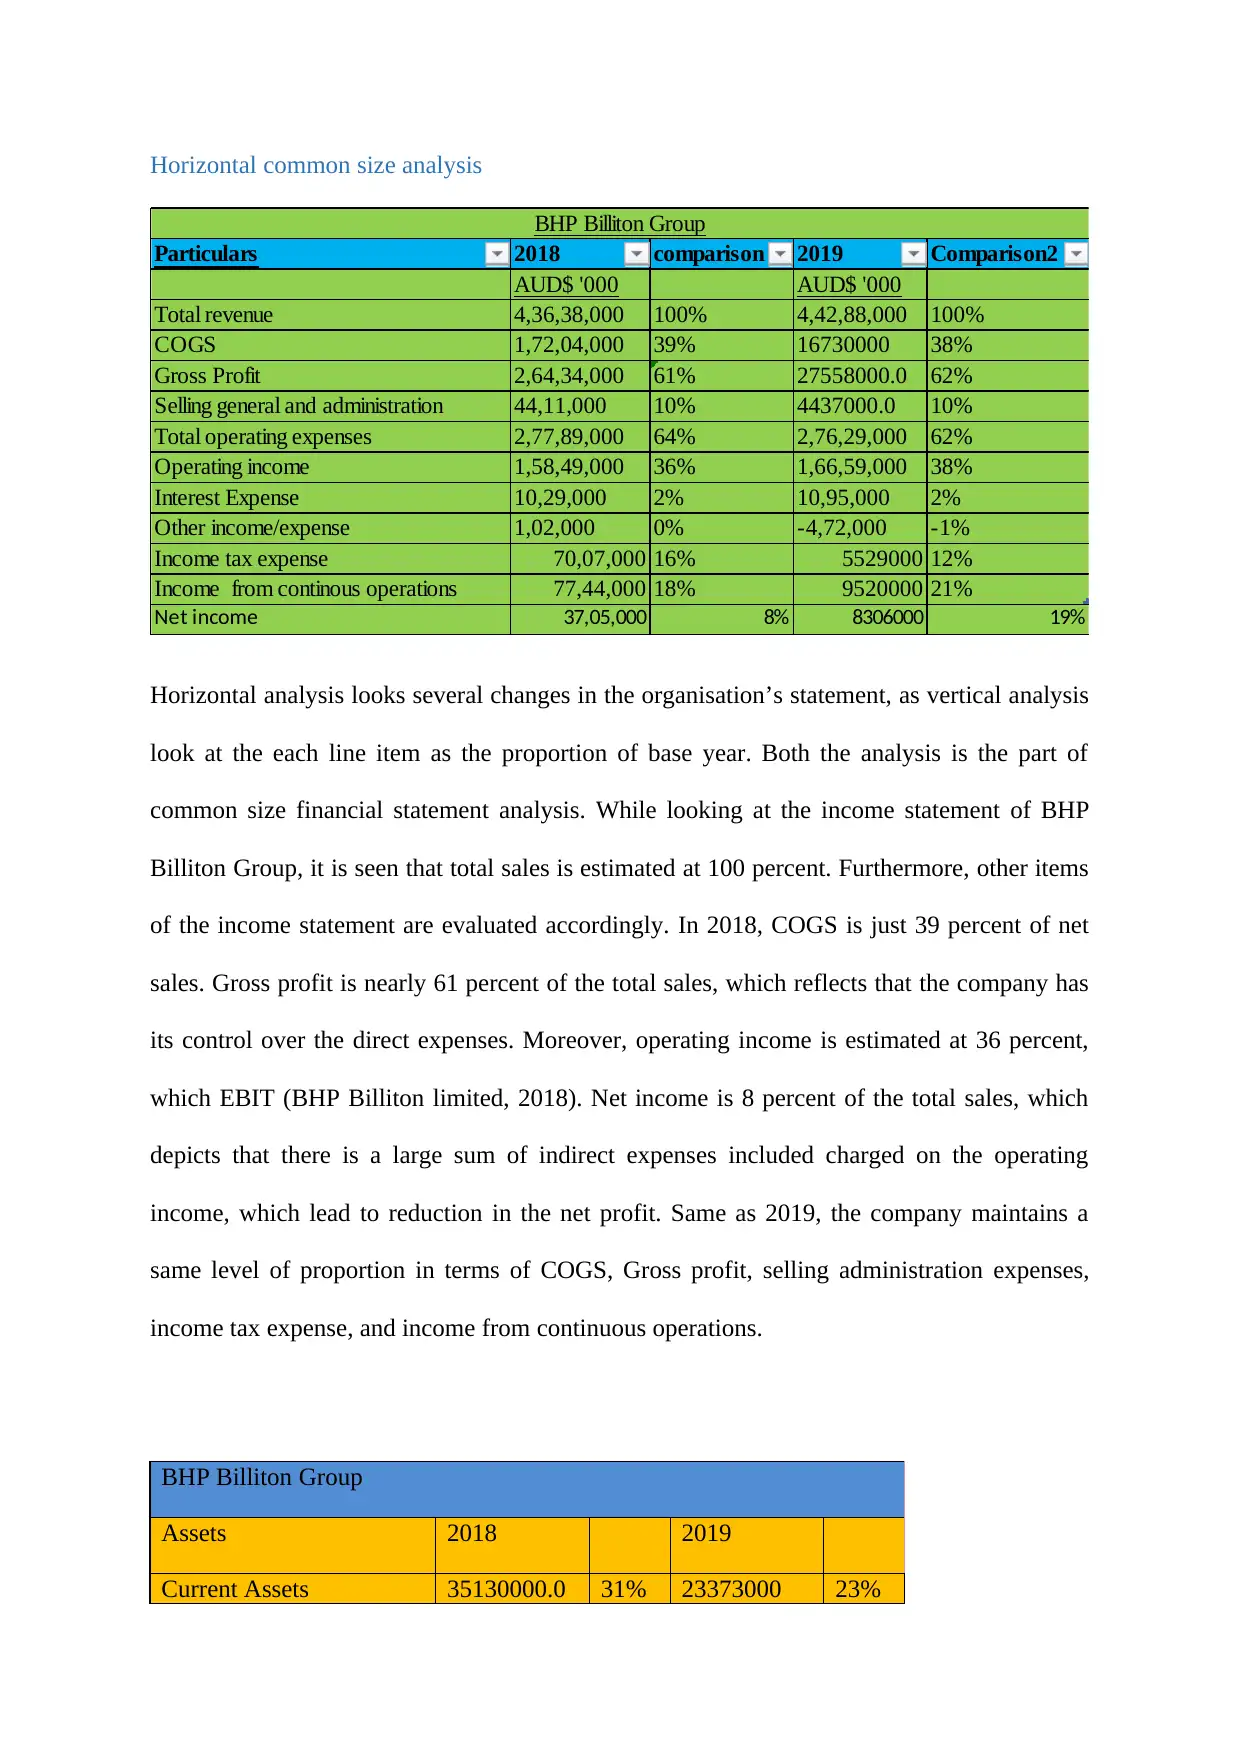
Horizontal common size analysis
Particulars 2018 comparison 2019 Comparison2
AUD$ '000 AUD$ '000
Total revenue 4,36,38,000 100% 4,42,88,000 100%
COGS 1,72,04,000 39% 16730000 38%
Gross Profit 2,64,34,000 61% 27558000.0 62%
Selling general and administration 44,11,000 10% 4437000.0 10%
Total operating expenses 2,77,89,000 64% 2,76,29,000 62%
Operating income 1,58,49,000 36% 1,66,59,000 38%
Interest Expense 10,29,000 2% 10,95,000 2%
Other income/expense 1,02,000 0% -4,72,000 -1%
Income tax expense 70,07,000 16% 5529000 12%
Income from continous operations 77,44,000 18% 9520000 21%
Net income 37,05,000 8% 8306000 19%
BHP Billiton Group
Horizontal analysis looks several changes in the organisation’s statement, as vertical analysis
look at the each line item as the proportion of base year. Both the analysis is the part of
common size financial statement analysis. While looking at the income statement of BHP
Billiton Group, it is seen that total sales is estimated at 100 percent. Furthermore, other items
of the income statement are evaluated accordingly. In 2018, COGS is just 39 percent of net
sales. Gross profit is nearly 61 percent of the total sales, which reflects that the company has
its control over the direct expenses. Moreover, operating income is estimated at 36 percent,
which EBIT (BHP Billiton limited, 2018). Net income is 8 percent of the total sales, which
depicts that there is a large sum of indirect expenses included charged on the operating
income, which lead to reduction in the net profit. Same as 2019, the company maintains a
same level of proportion in terms of COGS, Gross profit, selling administration expenses,
income tax expense, and income from continuous operations.
BHP Billiton Group
Assets 2018 2019
Current Assets 35130000.0 31% 23373000 23%
Paraphrase This Document
Need a fresh take? Get an instant paraphrase of this document with our AI Paraphraser
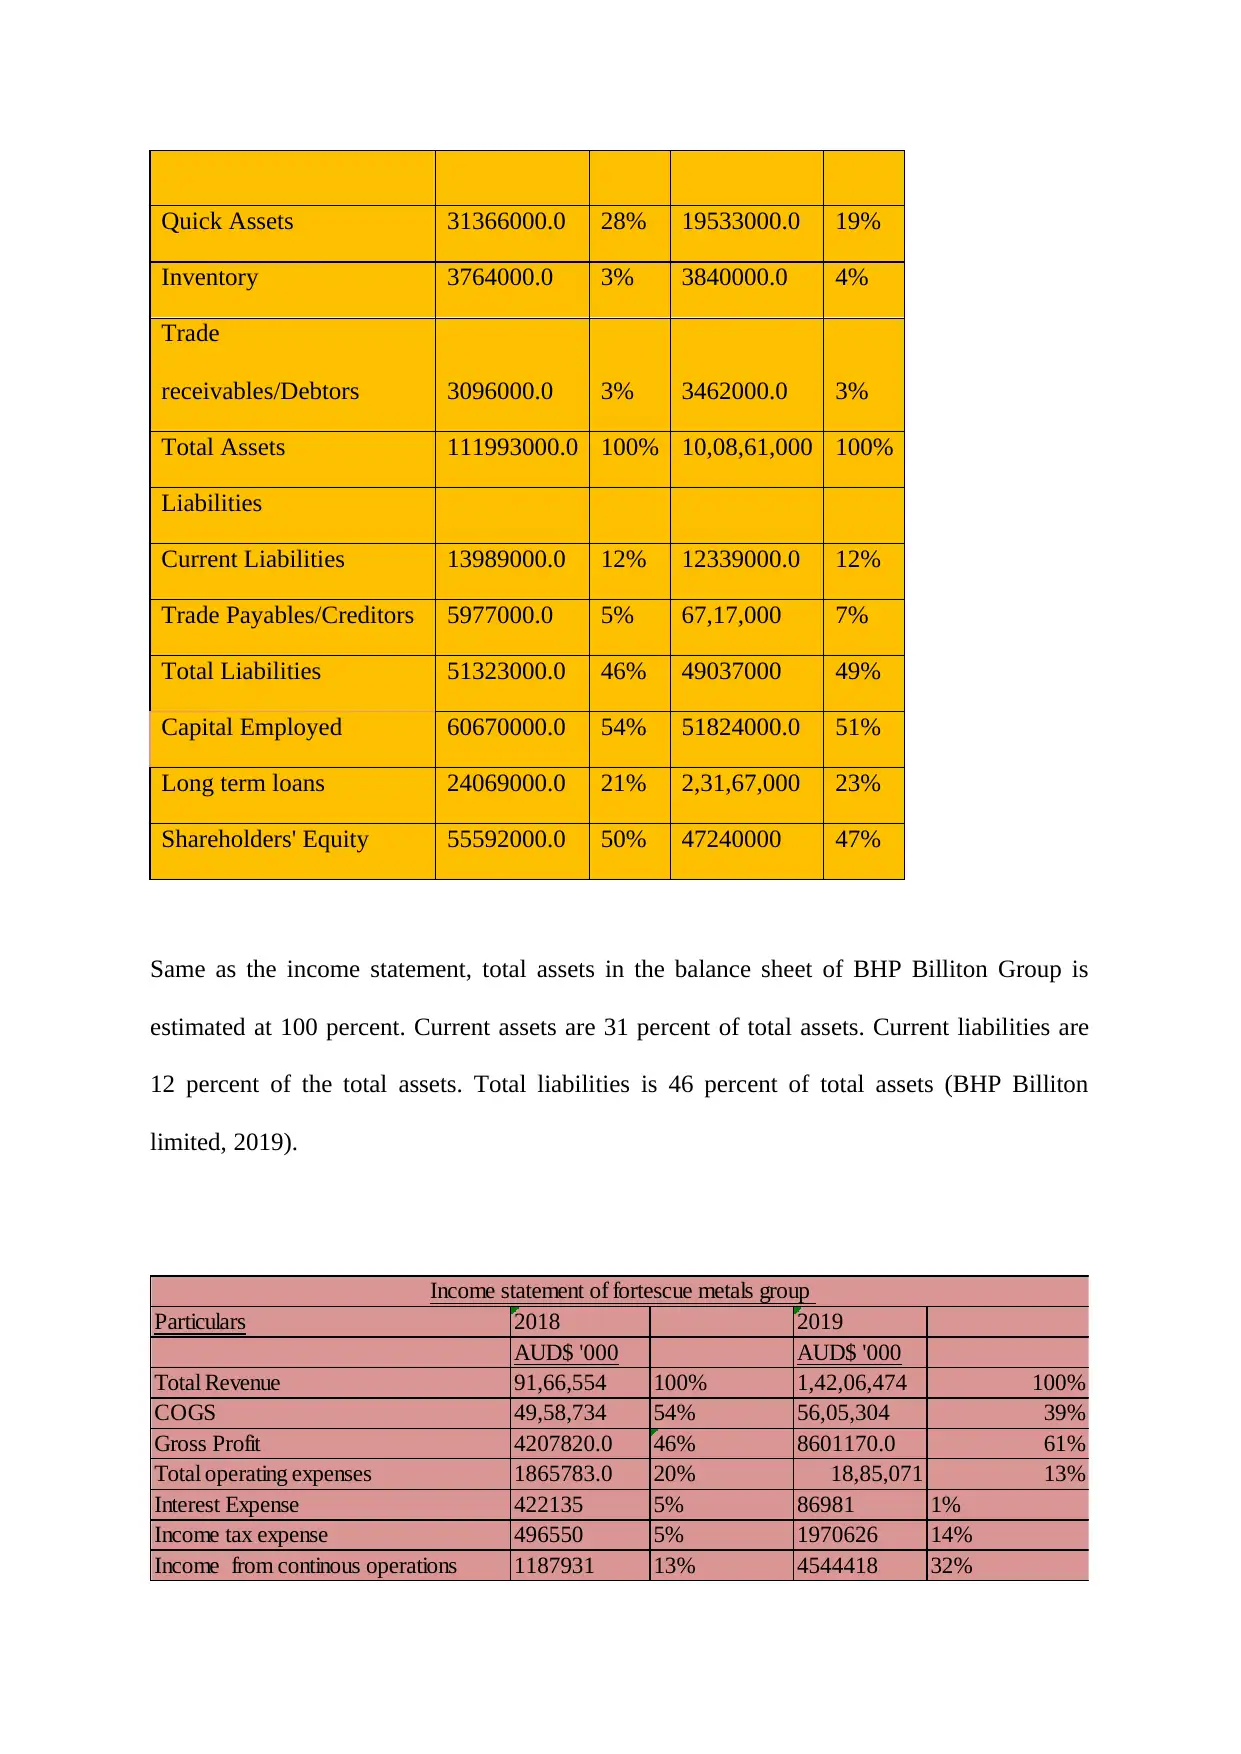
Quick Assets 31366000.0 28% 19533000.0 19%
Inventory 3764000.0 3% 3840000.0 4%
Trade
receivables/Debtors 3096000.0 3% 3462000.0 3%
Total Assets 111993000.0 100% 10,08,61,000 100%
Liabilities
Current Liabilities 13989000.0 12% 12339000.0 12%
Trade Payables/Creditors 5977000.0 5% 67,17,000 7%
Total Liabilities 51323000.0 46% 49037000 49%
Capital Employed 60670000.0 54% 51824000.0 51%
Long term loans 24069000.0 21% 2,31,67,000 23%
Shareholders' Equity 55592000.0 50% 47240000 47%
Same as the income statement, total assets in the balance sheet of BHP Billiton Group is
estimated at 100 percent. Current assets are 31 percent of total assets. Current liabilities are
12 percent of the total assets. Total liabilities is 46 percent of total assets (BHP Billiton
limited, 2019).
Particulars 2018 2019
AUD$ '000 AUD$ '000
Total Revenue 91,66,554 100% 1,42,06,474 100%
COGS 49,58,734 54% 56,05,304 39%
Gross Profit 4207820.0 46% 8601170.0 61%
Total operating expenses 1865783.0 20% 18,85,071 13%
Interest Expense 422135 5% 86981 1%
Income tax expense 496550 5% 1970626 14%
Income from continous operations 1187931 13% 4544418 32%
Income statement of fortescue metals group
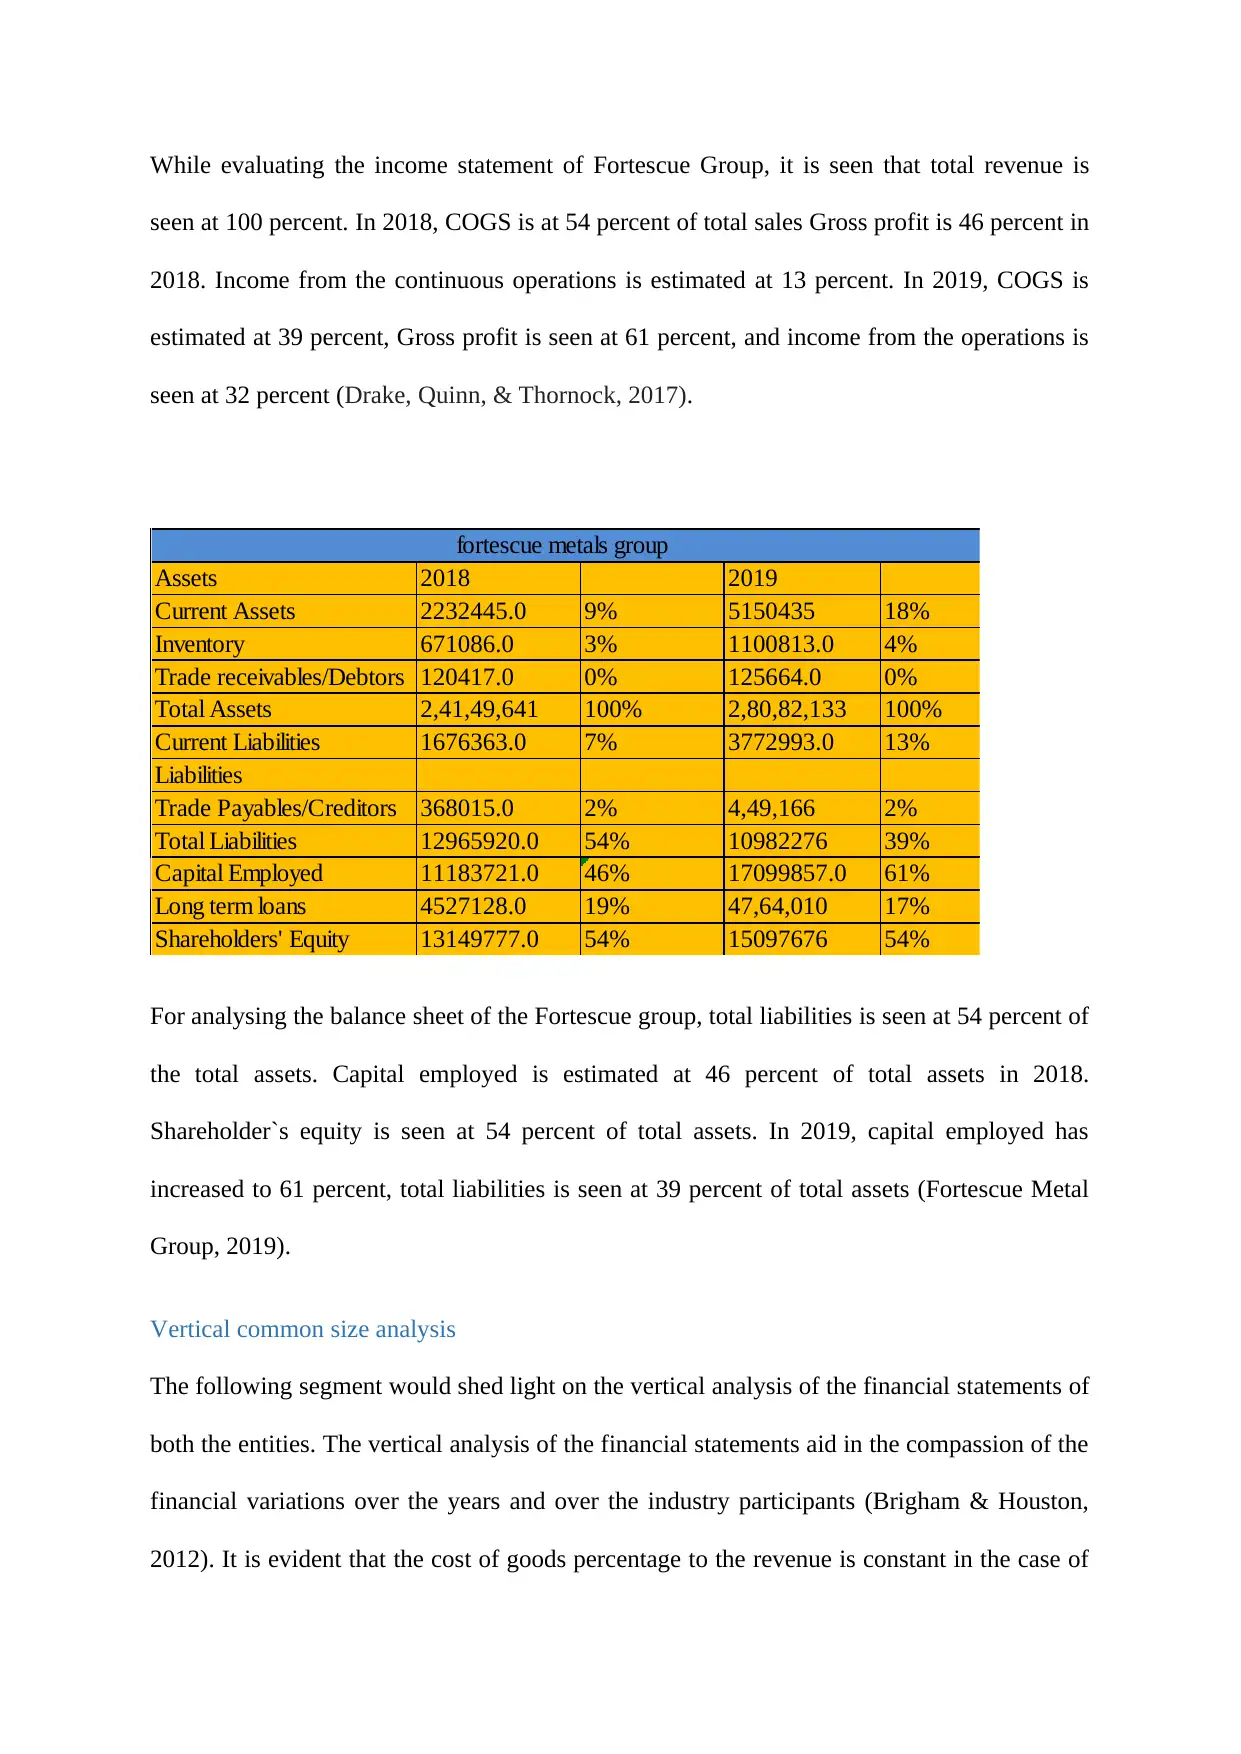
While evaluating the income statement of Fortescue Group, it is seen that total revenue is
seen at 100 percent. In 2018, COGS is at 54 percent of total sales Gross profit is 46 percent in
2018. Income from the continuous operations is estimated at 13 percent. In 2019, COGS is
estimated at 39 percent, Gross profit is seen at 61 percent, and income from the operations is
seen at 32 percent (Drake, Quinn, & Thornock, 2017).
Assets 2018 2019
Current Assets 2232445.0 9% 5150435 18%
Inventory 671086.0 3% 1100813.0 4%
Trade receivables/Debtors 120417.0 0% 125664.0 0%
Total Assets 2,41,49,641 100% 2,80,82,133 100%
Current Liabilities 1676363.0 7% 3772993.0 13%
Liabilities
Trade Payables/Creditors 368015.0 2% 4,49,166 2%
Total Liabilities 12965920.0 54% 10982276 39%
Capital Employed 11183721.0 46% 17099857.0 61%
Long term loans 4527128.0 19% 47,64,010 17%
Shareholders' Equity 13149777.0 54% 15097676 54%
fortescue metals group
For analysing the balance sheet of the Fortescue group, total liabilities is seen at 54 percent of
the total assets. Capital employed is estimated at 46 percent of total assets in 2018.
Shareholder`s equity is seen at 54 percent of total assets. In 2019, capital employed has
increased to 61 percent, total liabilities is seen at 39 percent of total assets (Fortescue Metal
Group, 2019).
Vertical common size analysis
The following segment would shed light on the vertical analysis of the financial statements of
both the entities. The vertical analysis of the financial statements aid in the compassion of the
financial variations over the years and over the industry participants (Brigham & Houston,
2012). It is evident that the cost of goods percentage to the revenue is constant in the case of
⊘ This is a preview!⊘
Do you want full access?
Subscribe today to unlock all pages.
Trusted by 1+ million students worldwide
1 out of 15
Related Documents


Your All-in-One AI-Powered Toolkit for Academic Success.
+13062052269
info@desklib.com
Available 24*7 on WhatsApp / Email
![[object Object]](/_next/static/media/star-bottom.7253800d.svg)
Unlock your academic potential
Copyright © 2020–2026 A2Z Services. All Rights Reserved. Developed and managed by ZUCOL.