Report: Financial Analysis of Billabong International - 2015-2016
VerifiedAdded on 2020/04/07
|12
|3933
|58
Report
AI Summary
This report presents a financial analysis of Billabong International Ltd, focusing on the years 2015 and 2016. The analysis employs ratio analysis to evaluate the company's performance across various dimensions, including profitability, efficiency, liquidity, and gearing. The executive summary highlights that Billabong's financial performance requires improvement, with challenges in profitability and efficiency. The report delves into specific ratios, such as net margin, operating margin, gross margin, cash conversion cycle, inventory turnover, and current and quick ratios, to assess the company's financial health. The findings indicate that Billabong struggles with earning adequate profits, inefficient operations, and high reliance on debt. The report concludes with recommendations for financial planning and a focus on retained earnings to improve the company's financial standing. The analysis is based on publicly available financial data from Billabong's annual reports and other sources.

Principles of accounting and finance
Paraphrase This Document
Need a fresh take? Get an instant paraphrase of this document with our AI Paraphraser
Table of Contents
EXCUTIVE SUMMARY................................................................................................................1
BACKGROUND AND COMPANY OVERVIEW........................................................................1
ANALYSIS......................................................................................................................................3
Profitability..................................................................................................................................3
Efficiency.....................................................................................................................................4
Liquidity......................................................................................................................................5
Gearing (Leverage)......................................................................................................................6
Investment Ratios........................................................................................................................6
CONCLUSION AND FINDINGS..................................................................................................7
RECOMMENDATIONS.................................................................................................................8
APPENDIX......................................................................................................................................8
REFERENCES..............................................................................................................................10
EXCUTIVE SUMMARY
The financial analysis allows organization in knowing its present performance in the
market. The present report carried out is based on Billabong International Ltd where the
organization is indulged in the practice of wholesaling and retailing of surf, stake snow, sports
apparel, etc. The products of the company are licensed in more than 100 countries, and its
services are rendered at approximately 10,000 locations worldwide (Billabong, ANNUAL
GENERAL MEETING AND ANNUAL REPORT , 2016). Ratio analysis of the company has
been carried out where profitability, efficiency, liquidity, gearing and investing ratios have been
computed. Calculation of profitability ratios has supported in knowing that company is not able
to earn adequate profits by carrying out its overall operations in the market.
Apart from this, analysis of efficiency ratios of Billabong International has shown that
business is not at all efficient. Cash conversion cycle of the company is high and along with this
inventory turnover ratio is also high. Leverage ratio has shown unfavorable results where the
company has the high dependency on debt as compared with the equity (Bodie, 2013).
Therefore, the overall findings are that financial performance of Billabong International requires
improvement and is not up to the mark. It is recommended to business to indulge in the practice
of financial planning, and it is required for the business to focus more on retained earnings rather
than focusing on the external source of finance.
BACKGROUND AND COMPANY OVERVIEW
Financial analysis plays most important role in the organization as it allows in knowing
whether the business is performing efficiently or not. Further, in the modern era the market
where organizations operate is highly competitive and due to this reason every organization is
interested in knowing its financial performance and in turn corrective actions are applied for
performance enhancement (Babalola & Abiola, 2013). The present report carried out is based on
Billabong International Ltd where the organization is indulged in the practice of wholesaling and
retailing of surf, stake snow, sports apparel, etc. The firm was founded in the year 1973 and is
headquartered in Queensland, Australia.
The organization is engaged in the practice of marketing, distribution, wholesale of
different type of retail commodities as per the need and requirement of the target market
(Billabong, Corporate Overview, 2017). The present study has been carried out with the motive
to know the financial performance of Billabong International Ltd where ratio analysis has been
1
⊘ This is a preview!⊘
Do you want full access?
Subscribe today to unlock all pages.
Trusted by 1+ million students worldwide
carried out of 2016 and 2015 to know how to present performance of the entity has been
enhanced as compared with the past. Ratio analysis of the company has been carried out where
profitability, efficiency, liquidity, gearing and investing ratios has been computed. Calculating
all these ratios is considered to be most significant for the business as it allows business in
knowing its efficiency.
The products of the company are licensed in more than 100 countries, and its services are
rendered at approximately 10,000 locations worldwide (Bloomberg, 2017). The range of
techniques adopted for distribution purpose involves specialized broad sports retailers along with
the firm’s own branded retailer outlet. The main criteria undertaken by business to boost its
overall performance is operating with the help of its own store that enhances sales volume along
with the profitability of the company in every possible manner. In order to know the financial
performance of the entity, its annual report has been accessed through which profitability and
sales related information has been accessed by the business.
Profitability ratios have been calculated that involves net profit, gross profit, etc. through
which it is possible to know whether the present profitability level of the enterprise has been
increased or not as compared with the past. Apart from this, liquidity ratios have been computed
in order to know whether cash position of the enterprise is strong or not. Billabong hires approx
4000 staff members worldwide with the motive to meet with the expectations of the target
market (Reuters, 2017). A major part of the revenue earned by the company is from wholly
owned operations carried out in the market of Australia, North America, Europe, Japan, New
Zealand, South Africa and Brazil. These are the most significant markets through which
enterprise is earning revenue and has allowed recovering the major costs.
The company is publicly listed on the Australian Securities Exchange. Apart from this,
the market where Billabong operates is highly competitive, and in turn, many players are
operating in the market. Due to this basic reason financial analysis has to be carried out by the
business. By comparing the present profitability position of the business and its comparison with
the past can surely provide long-term benefits to the business (Terry-Armstrong, 2014). This is
the main reason due to which comparative analysis of Billabong has been carried out through
ratio analysis. Apart from this, recommendations have been provided to the business on the basis
of the present performance so that more effective strategies can be developed for the future and
this can allow in operating efficiently. Ratio analysis is considered to be one of the most
2
Paraphrase This Document
Need a fresh take? Get an instant paraphrase of this document with our AI Paraphraser
effective ways to know the present performance of the company and the actions that can be taken
for enhancing future performance.
ANALYSIS
Profitability
Ratio 2016 2015 % change
Net Margin % (2.16) 0.39 Nil
Operating margin 15.00 (1.00) Nil
Gross margin 50.7 52.9 (4.15)
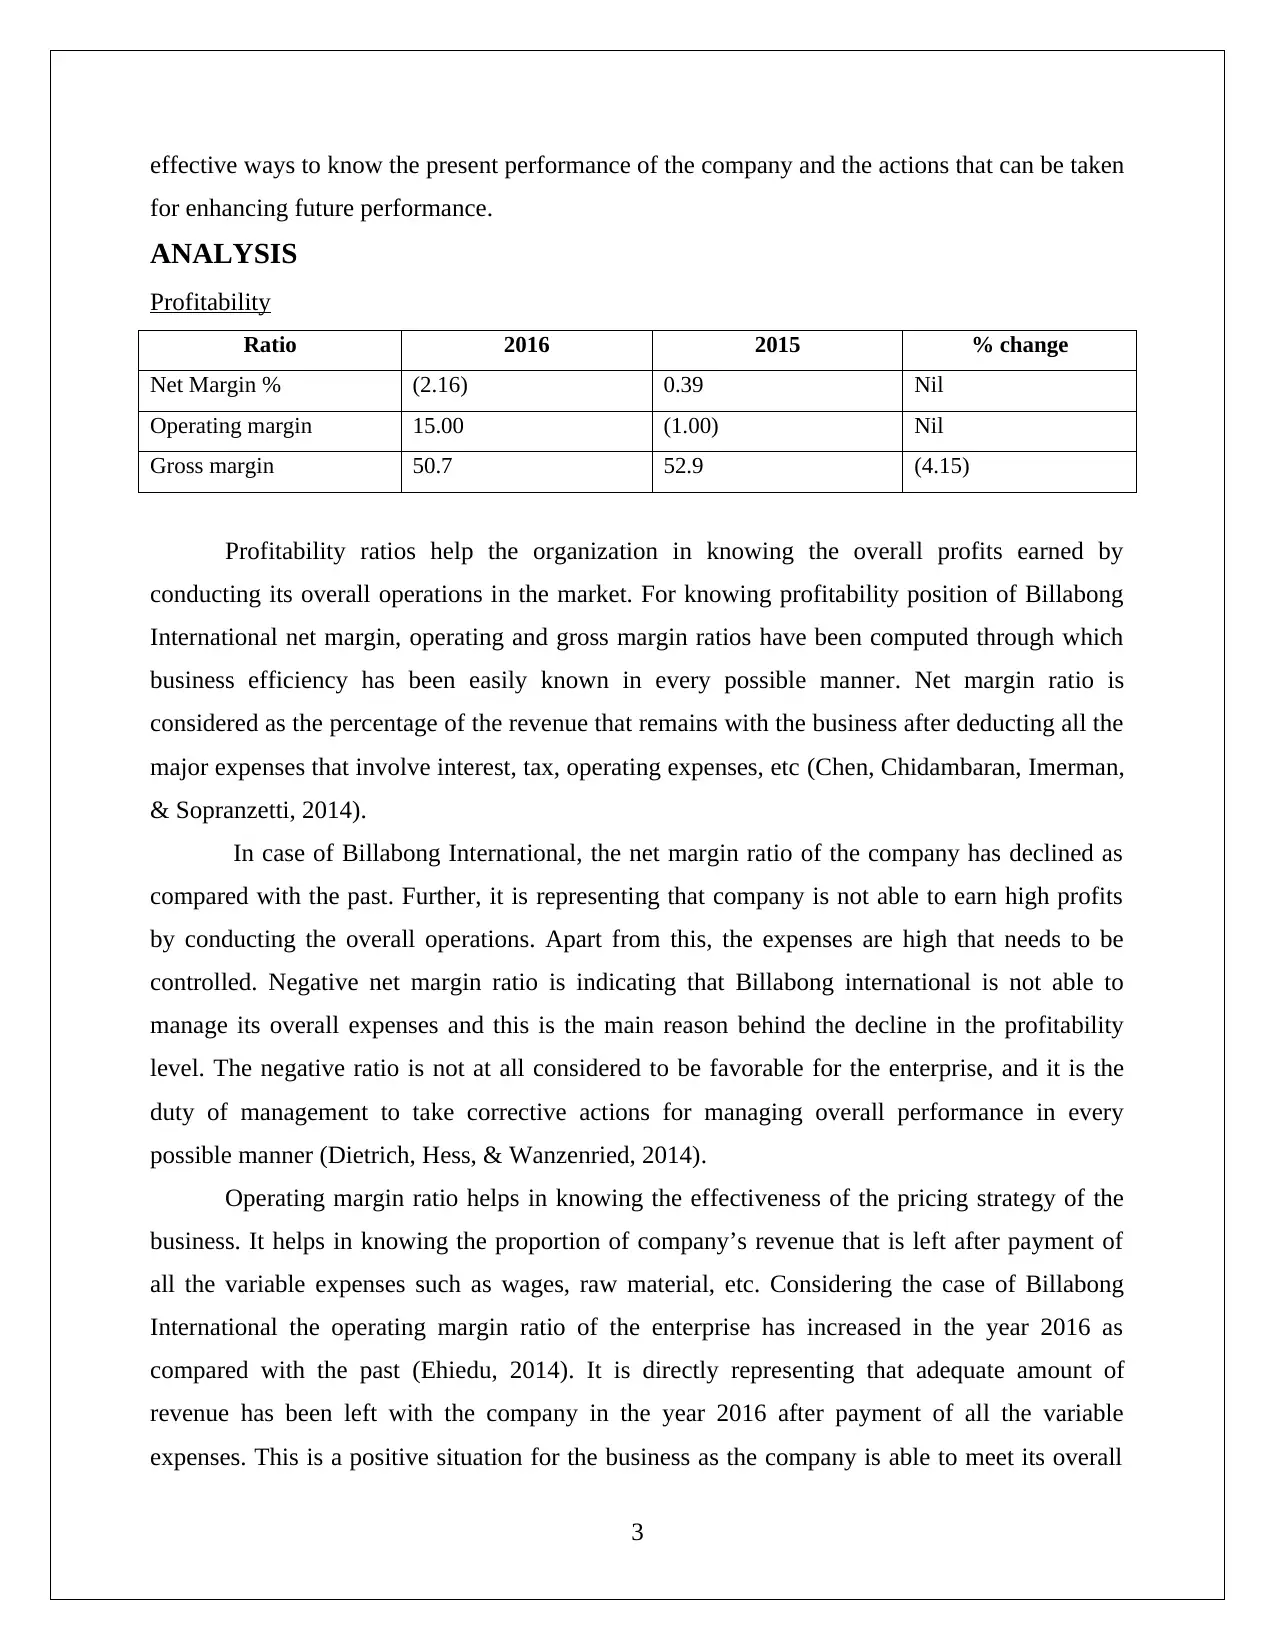
Profitability ratios help the organization in knowing the overall profits earned by
conducting its overall operations in the market. For knowing profitability position of Billabong
International net margin, operating and gross margin ratios have been computed through which
business efficiency has been easily known in every possible manner. Net margin ratio is
considered as the percentage of the revenue that remains with the business after deducting all the
major expenses that involve interest, tax, operating expenses, etc (Chen, Chidambaran, Imerman,
& Sopranzetti, 2014).
In case of Billabong International, the net margin ratio of the company has declined as
compared with the past. Further, it is representing that company is not able to earn high profits
by conducting the overall operations. Apart from this, the expenses are high that needs to be
controlled. Negative net margin ratio is indicating that Billabong international is not able to
manage its overall expenses and this is the main reason behind the decline in the profitability
level. The negative ratio is not at all considered to be favorable for the enterprise, and it is the
duty of management to take corrective actions for managing overall performance in every
possible manner (Dietrich, Hess, & Wanzenried, 2014).
Operating margin ratio helps in knowing the effectiveness of the pricing strategy of the
business. It helps in knowing the proportion of company’s revenue that is left after payment of
all the variable expenses such as wages, raw material, etc. Considering the case of Billabong
International the operating margin ratio of the enterprise has increased in the year 2016 as
compared with the past (Ehiedu, 2014). It is directly representing that adequate amount of
revenue has been left with the company in the year 2016 after payment of all the variable
expenses. This is a positive situation for the business as the company is able to meet its overall
3
for enhancing future performance.
ANALYSIS
Profitability
Ratio 2016 2015 % change
Net Margin % (2.16) 0.39 Nil
Operating margin 15.00 (1.00) Nil
Gross margin 50.7 52.9 (4.15)
Profitability ratios help the organization in knowing the overall profits earned by
conducting its overall operations in the market. For knowing profitability position of Billabong
International net margin, operating and gross margin ratios have been computed through which
business efficiency has been easily known in every possible manner. Net margin ratio is
considered as the percentage of the revenue that remains with the business after deducting all the
major expenses that involve interest, tax, operating expenses, etc (Chen, Chidambaran, Imerman,
& Sopranzetti, 2014).
In case of Billabong International, the net margin ratio of the company has declined as
compared with the past. Further, it is representing that company is not able to earn high profits
by conducting the overall operations. Apart from this, the expenses are high that needs to be
controlled. Negative net margin ratio is indicating that Billabong international is not able to
manage its overall expenses and this is the main reason behind the decline in the profitability
level. The negative ratio is not at all considered to be favorable for the enterprise, and it is the
duty of management to take corrective actions for managing overall performance in every
possible manner (Dietrich, Hess, & Wanzenried, 2014).
Operating margin ratio helps in knowing the effectiveness of the pricing strategy of the
business. It helps in knowing the proportion of company’s revenue that is left after payment of
all the variable expenses such as wages, raw material, etc. Considering the case of Billabong
International the operating margin ratio of the enterprise has increased in the year 2016 as
compared with the past (Ehiedu, 2014). It is directly representing that adequate amount of
revenue has been left with the company in the year 2016 after payment of all the variable
expenses. This is a positive situation for the business as the company is able to meet its overall
3
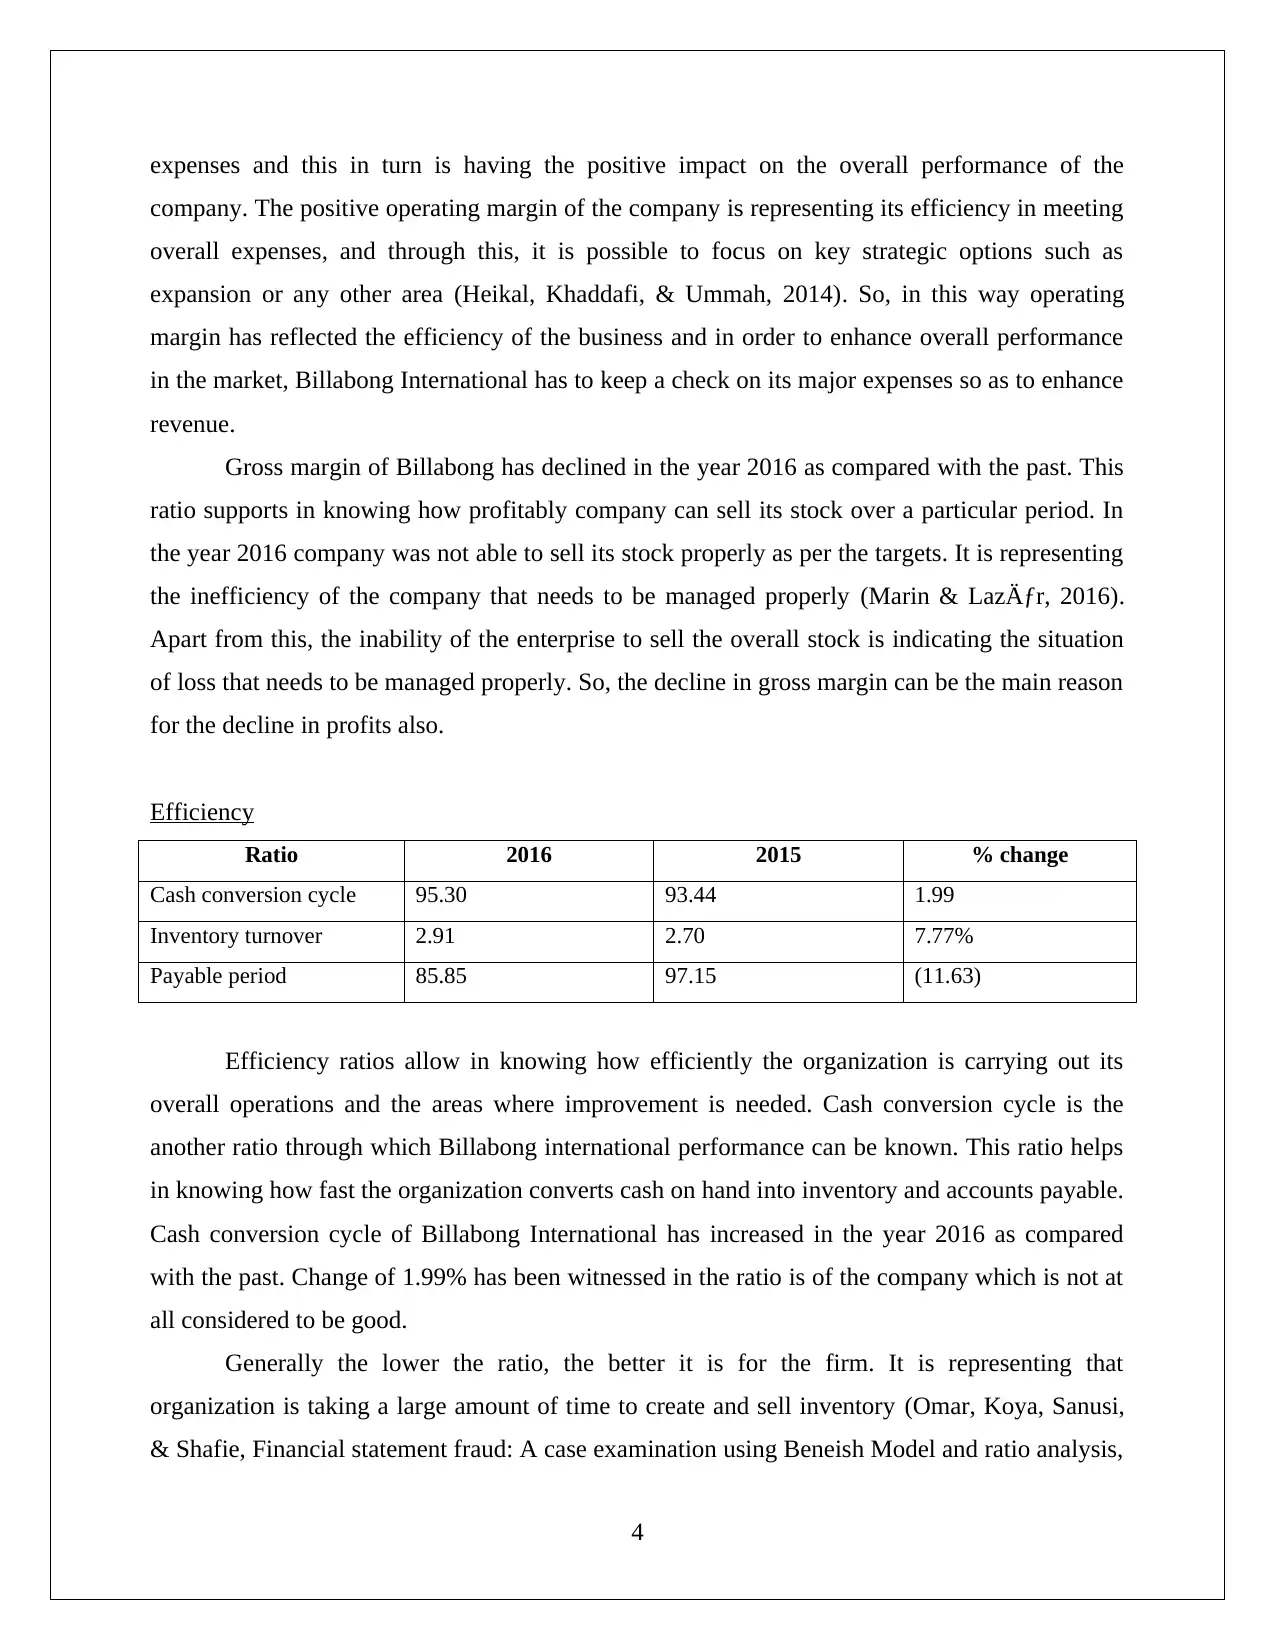
expenses and this in turn is having the positive impact on the overall performance of the
company. The positive operating margin of the company is representing its efficiency in meeting
overall expenses, and through this, it is possible to focus on key strategic options such as
expansion or any other area (Heikal, Khaddafi, & Ummah, 2014). So, in this way operating
margin has reflected the efficiency of the business and in order to enhance overall performance
in the market, Billabong International has to keep a check on its major expenses so as to enhance
revenue.
Gross margin of Billabong has declined in the year 2016 as compared with the past. This
ratio supports in knowing how profitably company can sell its stock over a particular period. In
the year 2016 company was not able to sell its stock properly as per the targets. It is representing
the inefficiency of the company that needs to be managed properly (Marin & Lazăr, 2016).
Apart from this, the inability of the enterprise to sell the overall stock is indicating the situation
of loss that needs to be managed properly. So, the decline in gross margin can be the main reason
for the decline in profits also.
Efficiency
Ratio 2016 2015 % change
Cash conversion cycle 95.30 93.44 1.99
Inventory turnover 2.91 2.70 7.77%
Payable period 85.85 97.15 (11.63)
Efficiency ratios allow in knowing how efficiently the organization is carrying out its
overall operations and the areas where improvement is needed. Cash conversion cycle is the
another ratio through which Billabong international performance can be known. This ratio helps
in knowing how fast the organization converts cash on hand into inventory and accounts payable.
Cash conversion cycle of Billabong International has increased in the year 2016 as compared
with the past. Change of 1.99% has been witnessed in the ratio is of the company which is not at
all considered to be good.
Generally the lower the ratio, the better it is for the firm. It is representing that
organization is taking a large amount of time to create and sell inventory (Omar, Koya, Sanusi,
& Shafie, Financial statement fraud: A case examination using Beneish Model and ratio analysis,
4
⊘ This is a preview!⊘
Do you want full access?
Subscribe today to unlock all pages.
Trusted by 1+ million students worldwide
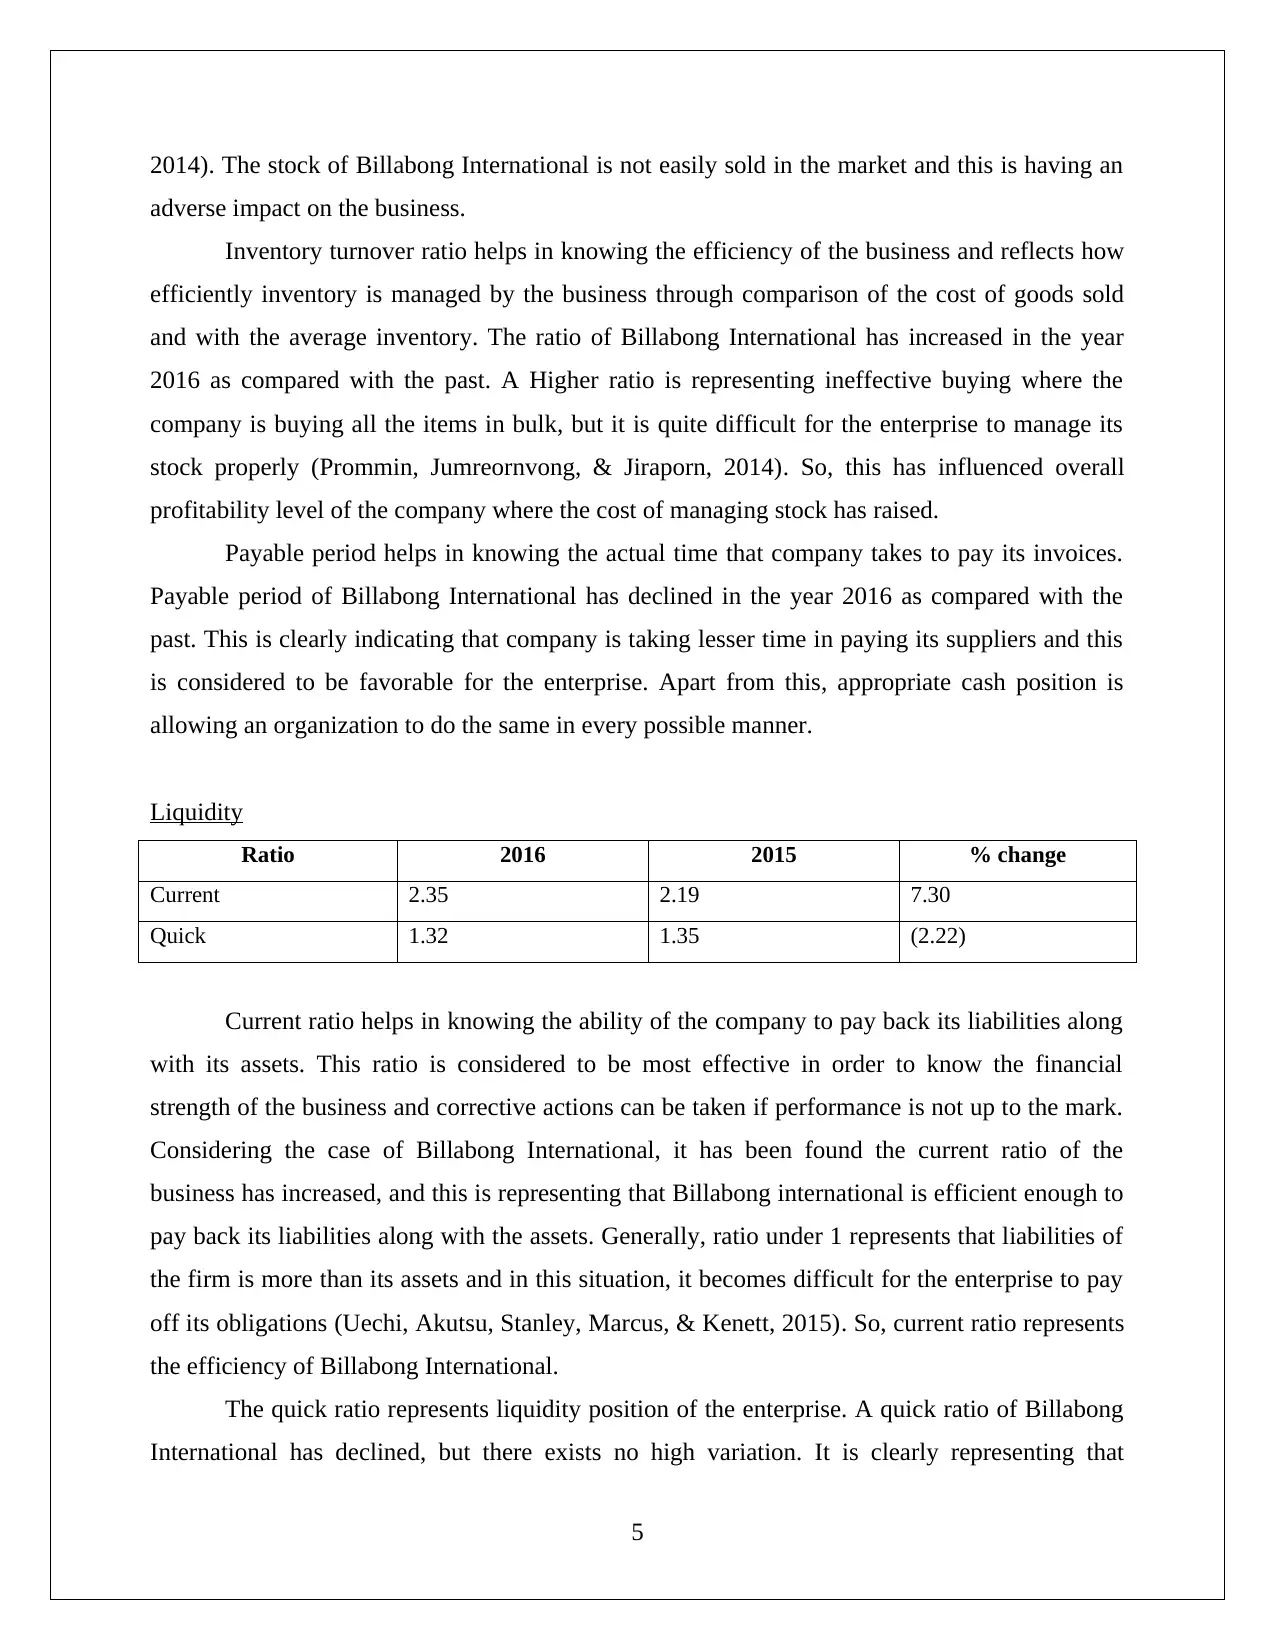
2014). The stock of Billabong International is not easily sold in the market and this is having an
adverse impact on the business.
Inventory turnover ratio helps in knowing the efficiency of the business and reflects how
efficiently inventory is managed by the business through comparison of the cost of goods sold
and with the average inventory. The ratio of Billabong International has increased in the year
2016 as compared with the past. A Higher ratio is representing ineffective buying where the
company is buying all the items in bulk, but it is quite difficult for the enterprise to manage its
stock properly (Prommin, Jumreornvong, & Jiraporn, 2014). So, this has influenced overall
profitability level of the company where the cost of managing stock has raised.
Payable period helps in knowing the actual time that company takes to pay its invoices.
Payable period of Billabong International has declined in the year 2016 as compared with the
past. This is clearly indicating that company is taking lesser time in paying its suppliers and this
is considered to be favorable for the enterprise. Apart from this, appropriate cash position is
allowing an organization to do the same in every possible manner.
Liquidity
Ratio 2016 2015 % change
Current 2.35 2.19 7.30
Quick 1.32 1.35 (2.22)
Current ratio helps in knowing the ability of the company to pay back its liabilities along
with its assets. This ratio is considered to be most effective in order to know the financial
strength of the business and corrective actions can be taken if performance is not up to the mark.
Considering the case of Billabong International, it has been found the current ratio of the
business has increased, and this is representing that Billabong international is efficient enough to
pay back its liabilities along with the assets. Generally, ratio under 1 represents that liabilities of
the firm is more than its assets and in this situation, it becomes difficult for the enterprise to pay
off its obligations (Uechi, Akutsu, Stanley, Marcus, & Kenett, 2015). So, current ratio represents
the efficiency of Billabong International.
The quick ratio represents liquidity position of the enterprise. A quick ratio of Billabong
International has declined, but there exists no high variation. It is clearly representing that
5
Paraphrase This Document
Need a fresh take? Get an instant paraphrase of this document with our AI Paraphraser
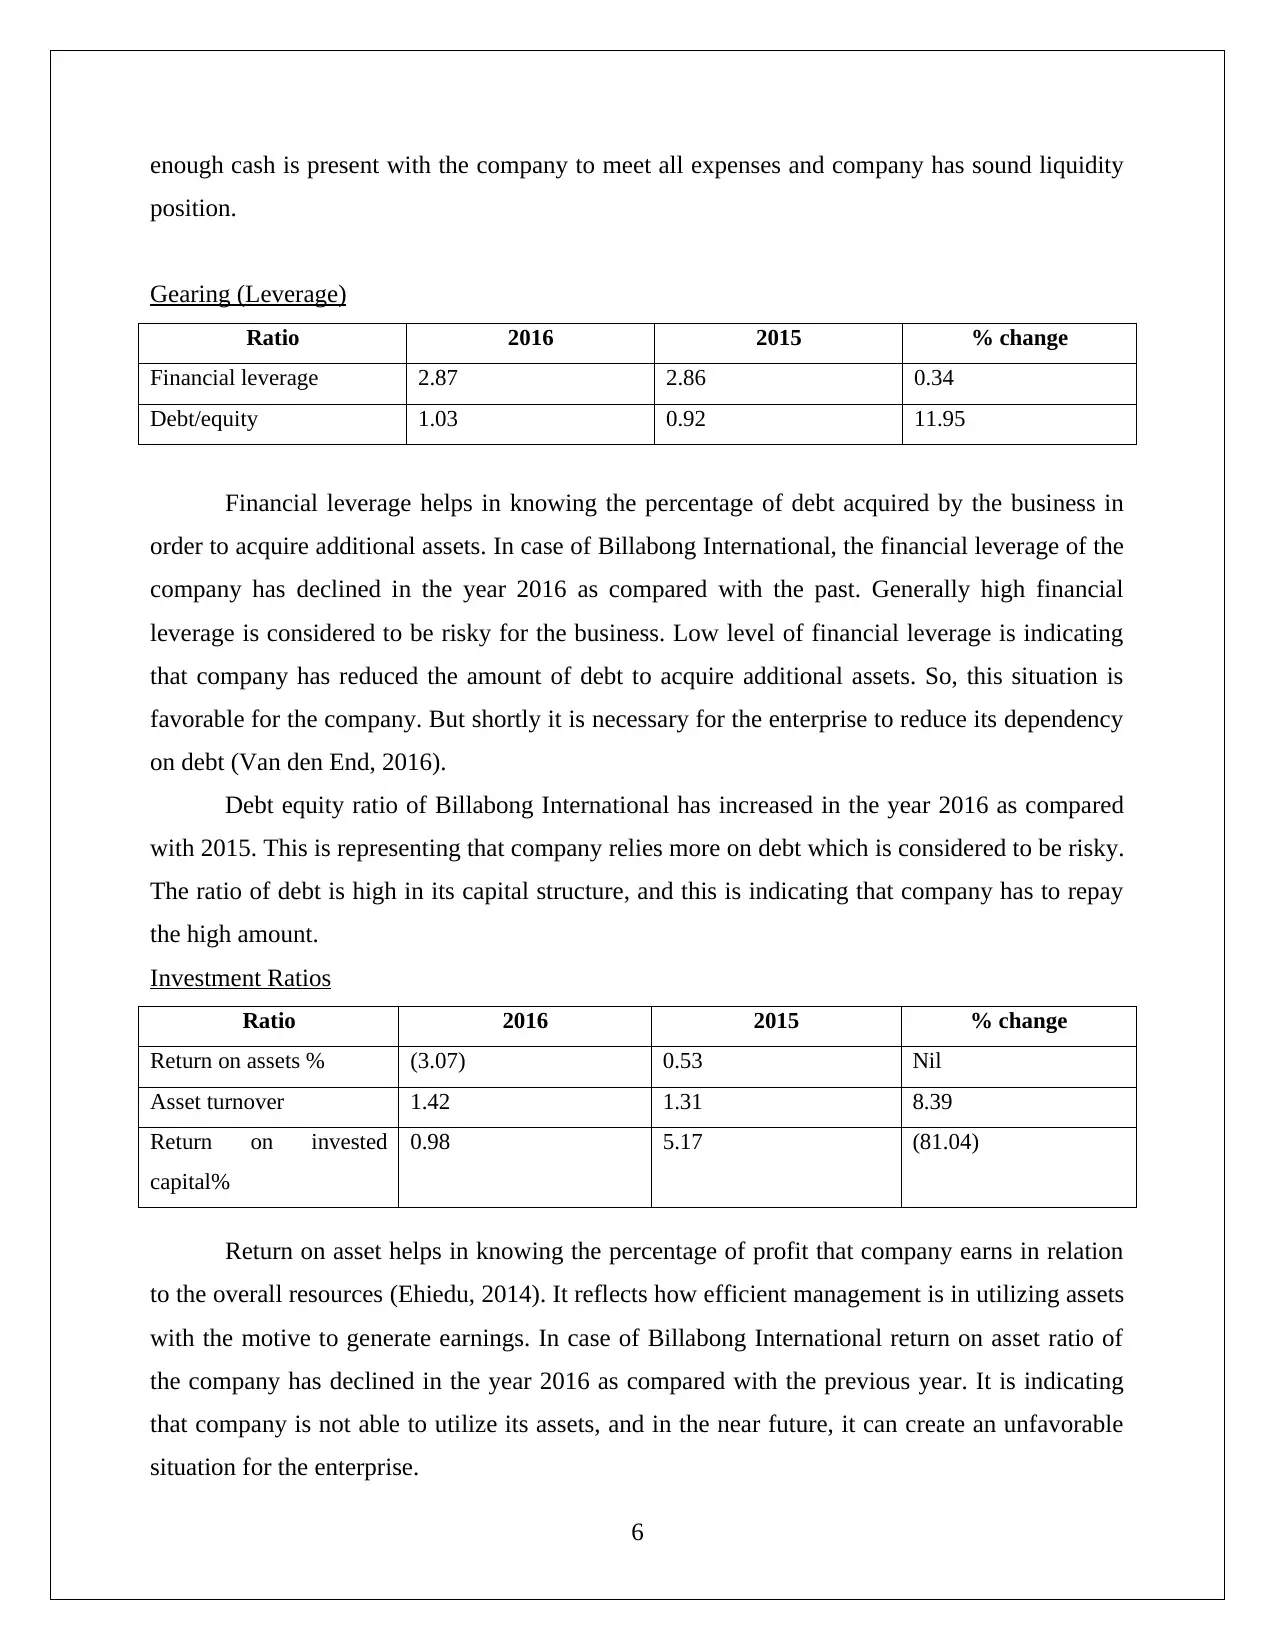
enough cash is present with the company to meet all expenses and company has sound liquidity
position.
Gearing (Leverage)
Ratio 2016 2015 % change
Financial leverage 2.87 2.86 0.34
Debt/equity 1.03 0.92 11.95
Financial leverage helps in knowing the percentage of debt acquired by the business in
order to acquire additional assets. In case of Billabong International, the financial leverage of the
company has declined in the year 2016 as compared with the past. Generally high financial
leverage is considered to be risky for the business. Low level of financial leverage is indicating
that company has reduced the amount of debt to acquire additional assets. So, this situation is
favorable for the company. But shortly it is necessary for the enterprise to reduce its dependency
on debt (Van den End, 2016).
Debt equity ratio of Billabong International has increased in the year 2016 as compared
with 2015. This is representing that company relies more on debt which is considered to be risky.
The ratio of debt is high in its capital structure, and this is indicating that company has to repay
the high amount.
Investment Ratios
Ratio 2016 2015 % change
Return on assets % (3.07) 0.53 Nil
Asset turnover 1.42 1.31 8.39
Return on invested
capital%
0.98 5.17 (81.04)
Return on asset helps in knowing the percentage of profit that company earns in relation
to the overall resources (Ehiedu, 2014). It reflects how efficient management is in utilizing assets
with the motive to generate earnings. In case of Billabong International return on asset ratio of
the company has declined in the year 2016 as compared with the previous year. It is indicating
that company is not able to utilize its assets, and in the near future, it can create an unfavorable
situation for the enterprise.
6
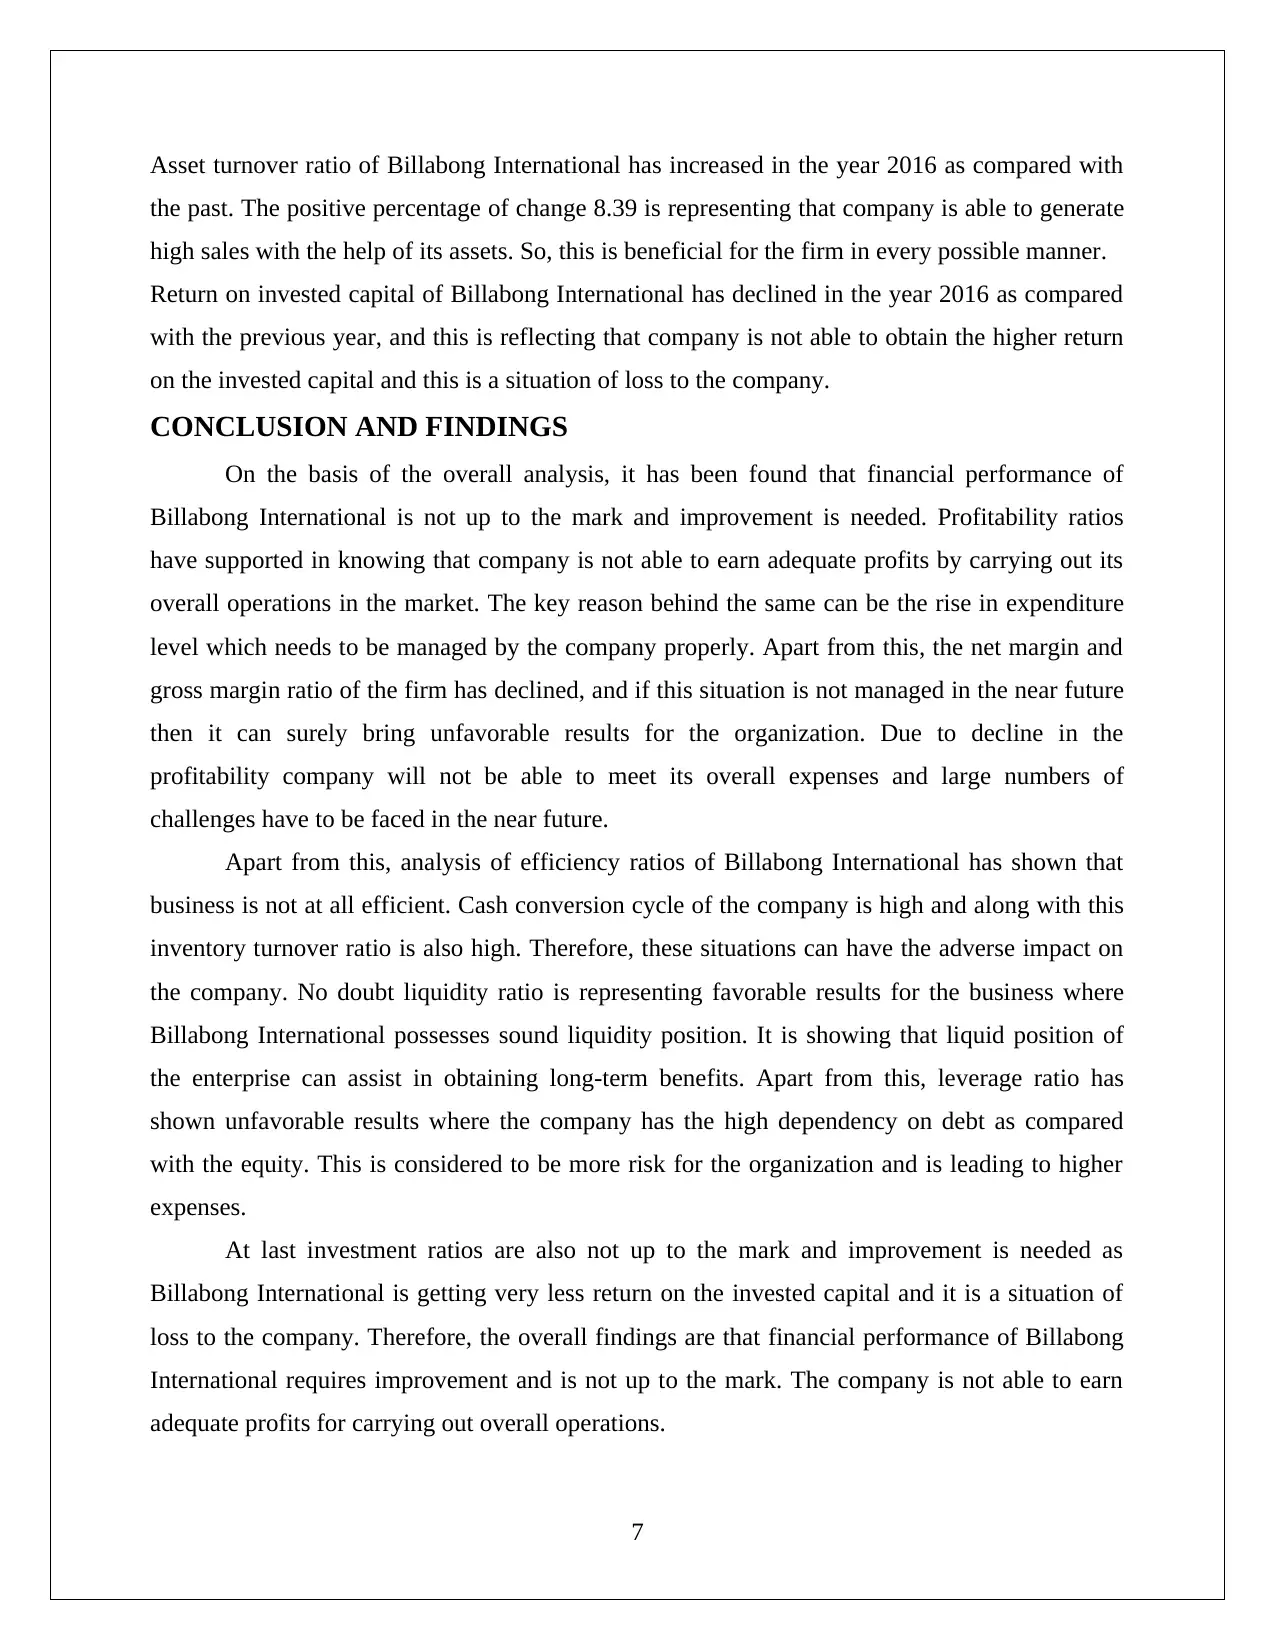
Asset turnover ratio of Billabong International has increased in the year 2016 as compared with
the past. The positive percentage of change 8.39 is representing that company is able to generate
high sales with the help of its assets. So, this is beneficial for the firm in every possible manner.
Return on invested capital of Billabong International has declined in the year 2016 as compared
with the previous year, and this is reflecting that company is not able to obtain the higher return
on the invested capital and this is a situation of loss to the company.
CONCLUSION AND FINDINGS
On the basis of the overall analysis, it has been found that financial performance of
Billabong International is not up to the mark and improvement is needed. Profitability ratios
have supported in knowing that company is not able to earn adequate profits by carrying out its
overall operations in the market. The key reason behind the same can be the rise in expenditure
level which needs to be managed by the company properly. Apart from this, the net margin and
gross margin ratio of the firm has declined, and if this situation is not managed in the near future
then it can surely bring unfavorable results for the organization. Due to decline in the
profitability company will not be able to meet its overall expenses and large numbers of
challenges have to be faced in the near future.
Apart from this, analysis of efficiency ratios of Billabong International has shown that
business is not at all efficient. Cash conversion cycle of the company is high and along with this
inventory turnover ratio is also high. Therefore, these situations can have the adverse impact on
the company. No doubt liquidity ratio is representing favorable results for the business where
Billabong International possesses sound liquidity position. It is showing that liquid position of
the enterprise can assist in obtaining long-term benefits. Apart from this, leverage ratio has
shown unfavorable results where the company has the high dependency on debt as compared
with the equity. This is considered to be more risk for the organization and is leading to higher
expenses.
At last investment ratios are also not up to the mark and improvement is needed as
Billabong International is getting very less return on the invested capital and it is a situation of
loss to the company. Therefore, the overall findings are that financial performance of Billabong
International requires improvement and is not up to the mark. The company is not able to earn
adequate profits for carrying out overall operations.
7
⊘ This is a preview!⊘
Do you want full access?
Subscribe today to unlock all pages.
Trusted by 1+ million students worldwide
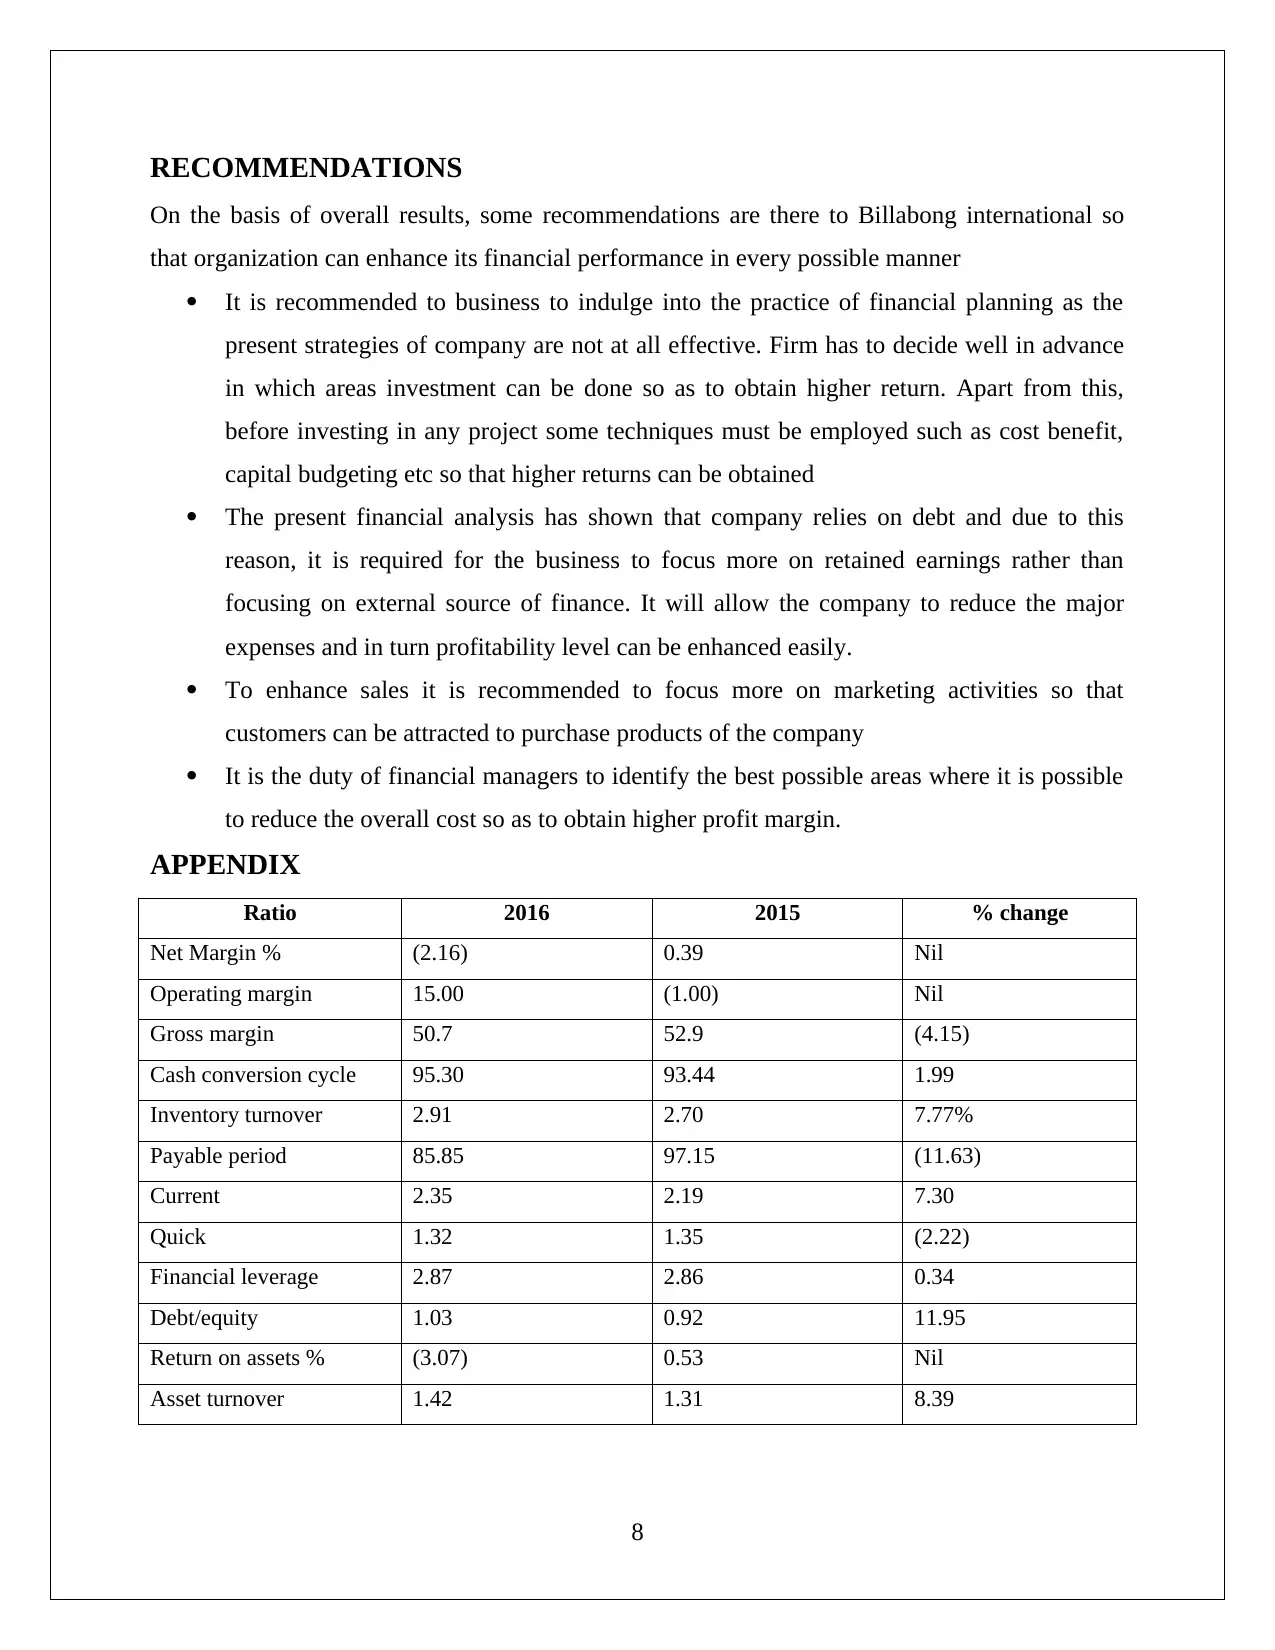
RECOMMENDATIONS
On the basis of overall results, some recommendations are there to Billabong international so
that organization can enhance its financial performance in every possible manner
It is recommended to business to indulge into the practice of financial planning as the
present strategies of company are not at all effective. Firm has to decide well in advance
in which areas investment can be done so as to obtain higher return. Apart from this,
before investing in any project some techniques must be employed such as cost benefit,
capital budgeting etc so that higher returns can be obtained
The present financial analysis has shown that company relies on debt and due to this
reason, it is required for the business to focus more on retained earnings rather than
focusing on external source of finance. It will allow the company to reduce the major
expenses and in turn profitability level can be enhanced easily.
To enhance sales it is recommended to focus more on marketing activities so that
customers can be attracted to purchase products of the company
It is the duty of financial managers to identify the best possible areas where it is possible
to reduce the overall cost so as to obtain higher profit margin.
APPENDIX
Ratio 2016 2015 % change
Net Margin % (2.16) 0.39 Nil
Operating margin 15.00 (1.00) Nil
Gross margin 50.7 52.9 (4.15)
Cash conversion cycle 95.30 93.44 1.99
Inventory turnover 2.91 2.70 7.77%
Payable period 85.85 97.15 (11.63)
Current 2.35 2.19 7.30
Quick 1.32 1.35 (2.22)
Financial leverage 2.87 2.86 0.34
Debt/equity 1.03 0.92 11.95
Return on assets % (3.07) 0.53 Nil
Asset turnover 1.42 1.31 8.39
8
Paraphrase This Document
Need a fresh take? Get an instant paraphrase of this document with our AI Paraphraser
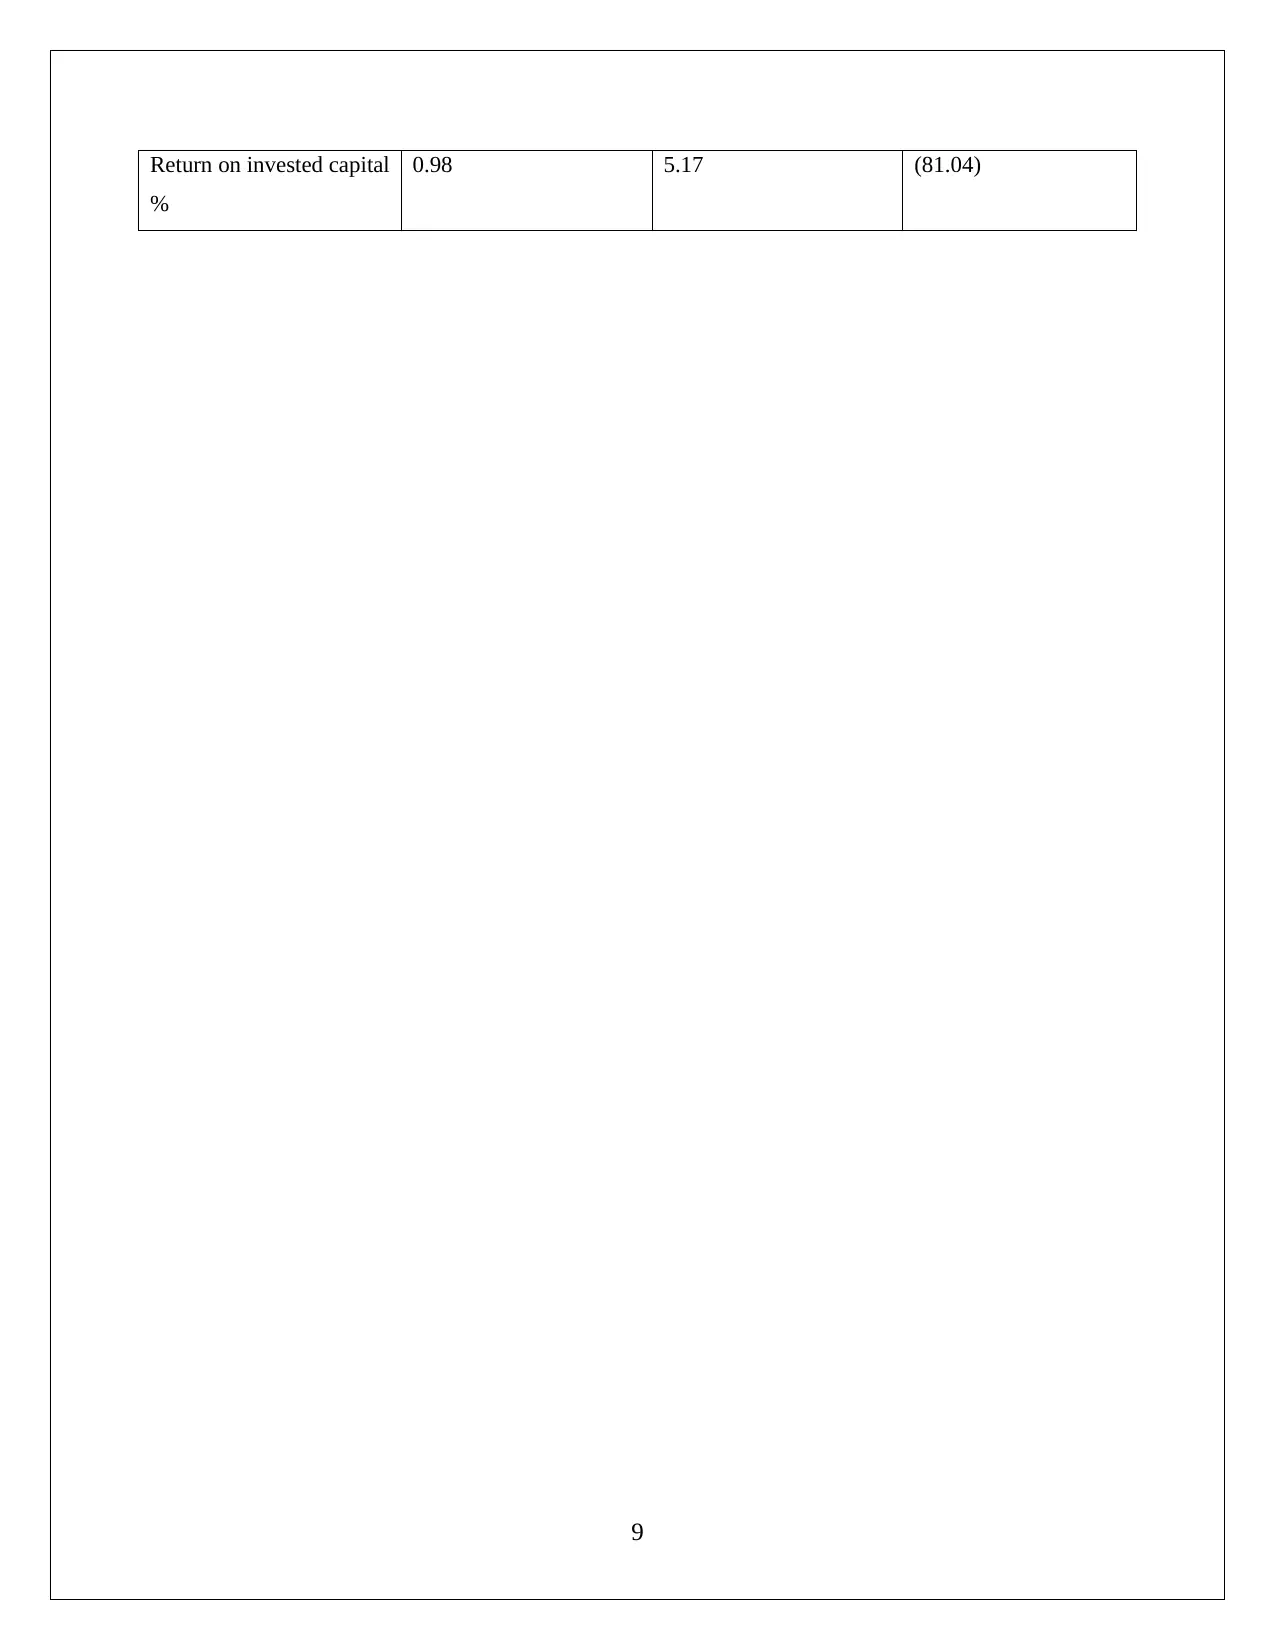
Return on invested capital
%
0.98 5.17 (81.04)
9
%
0.98 5.17 (81.04)
9
REFERENCES
Babalola, Y. A., & Abiola, F. R. (2013). Financial ratio analysis of firms: A tool for decision
making. International journal of management sciences , 132-137.
Billabong. (2016, October 17). ANNUAL GENERAL MEETING AND ANNUAL REPORT .
Retrieved September 19, 2017, from Billabong: http://www.billabongbiz.com/phoenix.zhtml?
c=154279&p=irol-reportsannual
Billabong. (2017, August 10). Corporate Overview. Retrieved September 19, 2017, from
Billabong: http://www.billabongbiz.com/phoenix.zhtml?c=154279&p=irol-irhome
Bloomberg. (2017, September 19). Company Overview of Billabong International Limited.
Retrieved September 19, 2017, from Bloomberg:
https://www.bloomberg.com/research/stocks/private/snapshot.asp?privcapId=1061739
Bodie, Z. (2013). Investments. New York: McGraw-Hill.
Chen, R. R., Chidambaran, N. K., Imerman, M. B., & Sopranzetti, B. J. (2014). Liquidity,
leverage, and Lehman: A structural analysis of financial institutions in crisis. Journal of Banking
& Finance, , 117-139.
Dietrich, A., Hess, K., & Wanzenried, G. (2014). The good and bad news about the new liquidity
rules of Basel III in Western European countries. . Journal of Banking & Finance , 13-25.
Ehiedu, V. C. (2014). The impact of liquidity on profitability of some selected companies: The
financial statement analysis (FSA) approach. Research Journal of Finance and Accounting , 81-
90.
Heikal, M., Khaddafi, M., & Ummah, A. (2014). Influence analysis of return on assets (ROA),
return on equity (ROE), net profit margin (NPM), debt to equity ratio (DER), and current ratio
(CR), against corporate profit growth in automotive in Indonesia stock exchange. International
Journal of Academic Research in Business and Social Sciences, , 101.
Marin, A. M., & Lazăr, C. D. (2016). Balance Sheet-General Information on Financial Health,
Liquidity and Solvency of an Economic Entity. Ovidius University Annals, Economic Sciences
Series , 538-543.
Omar, N., Koya, R. K., Sanusi, Z. M., & Shafie, N. A. (2014). Financial statement fraud: A case
examination using Beneish Model and ratio analysis. International Journal of Trade, Economics
and Finance , 184.
10
⊘ This is a preview!⊘
Do you want full access?
Subscribe today to unlock all pages.
Trusted by 1+ million students worldwide
1 out of 12
Related Documents


Your All-in-One AI-Powered Toolkit for Academic Success.
+13062052269
info@desklib.com
Available 24*7 on WhatsApp / Email
![[object Object]](/_next/static/media/star-bottom.7253800d.svg)
Unlock your academic potential
Copyright © 2020–2026 A2Z Services. All Rights Reserved. Developed and managed by ZUCOL.