Accounting and Financial Management Analysis: Case Studies Report
VerifiedAdded on 2020/10/22
|21
|5245
|147
Report
AI Summary
This report provides a comprehensive analysis of accounting and financial management practices, focusing on two case studies: Bitmap PLC and Toyland Ltd. It begins with an introduction to financial reporting and its importance, followed by Part A, which delves into ratio analysis, including profitability, liquidity, gearing, asset utilization, and investor potential ratios, to assess Bitmap PLC's financial performance. It also calculates the working capital cycle for Bitmap PLC. Part B explores various investment appraisal techniques, such as the payback period, for Toyland Ltd., along with their benefits and limitations, and discusses suitable sources of finance. Part C examines the role of budgeting in relation to strategic objectives, the budgeting process, and the interlinking of budgets within an organization. The report concludes with a summary of the findings and provides relevant references.

Accounting and
Financial Management
Financial Management
Paraphrase This Document
Need a fresh take? Get an instant paraphrase of this document with our AI Paraphraser
Table of Contents
INTRODUCTION...........................................................................................................................1
PART A...........................................................................................................................................1
Introduction............................................................................................................................1
1. Calculation of relevant ratios to analyse organisation's performance................................1
2. Calculation of working capital cycle for Bitmap Plc.........................................................5
Conclusion..............................................................................................................................7
PART B............................................................................................................................................7
1. Various investment appraisal techniques...........................................................................7
2. Key benefit and limitations in investment appraisal method...........................................14
3. Suitable sources of finance for investment.......................................................................15
PART C..........................................................................................................................................16
1. Budget and its relation with strategic objective and plans...............................................16
2. Budgeting process and and interlinking of budgets used in an organisation...................16
CONCLUSION..............................................................................................................................17
REFERENCES..............................................................................................................................19
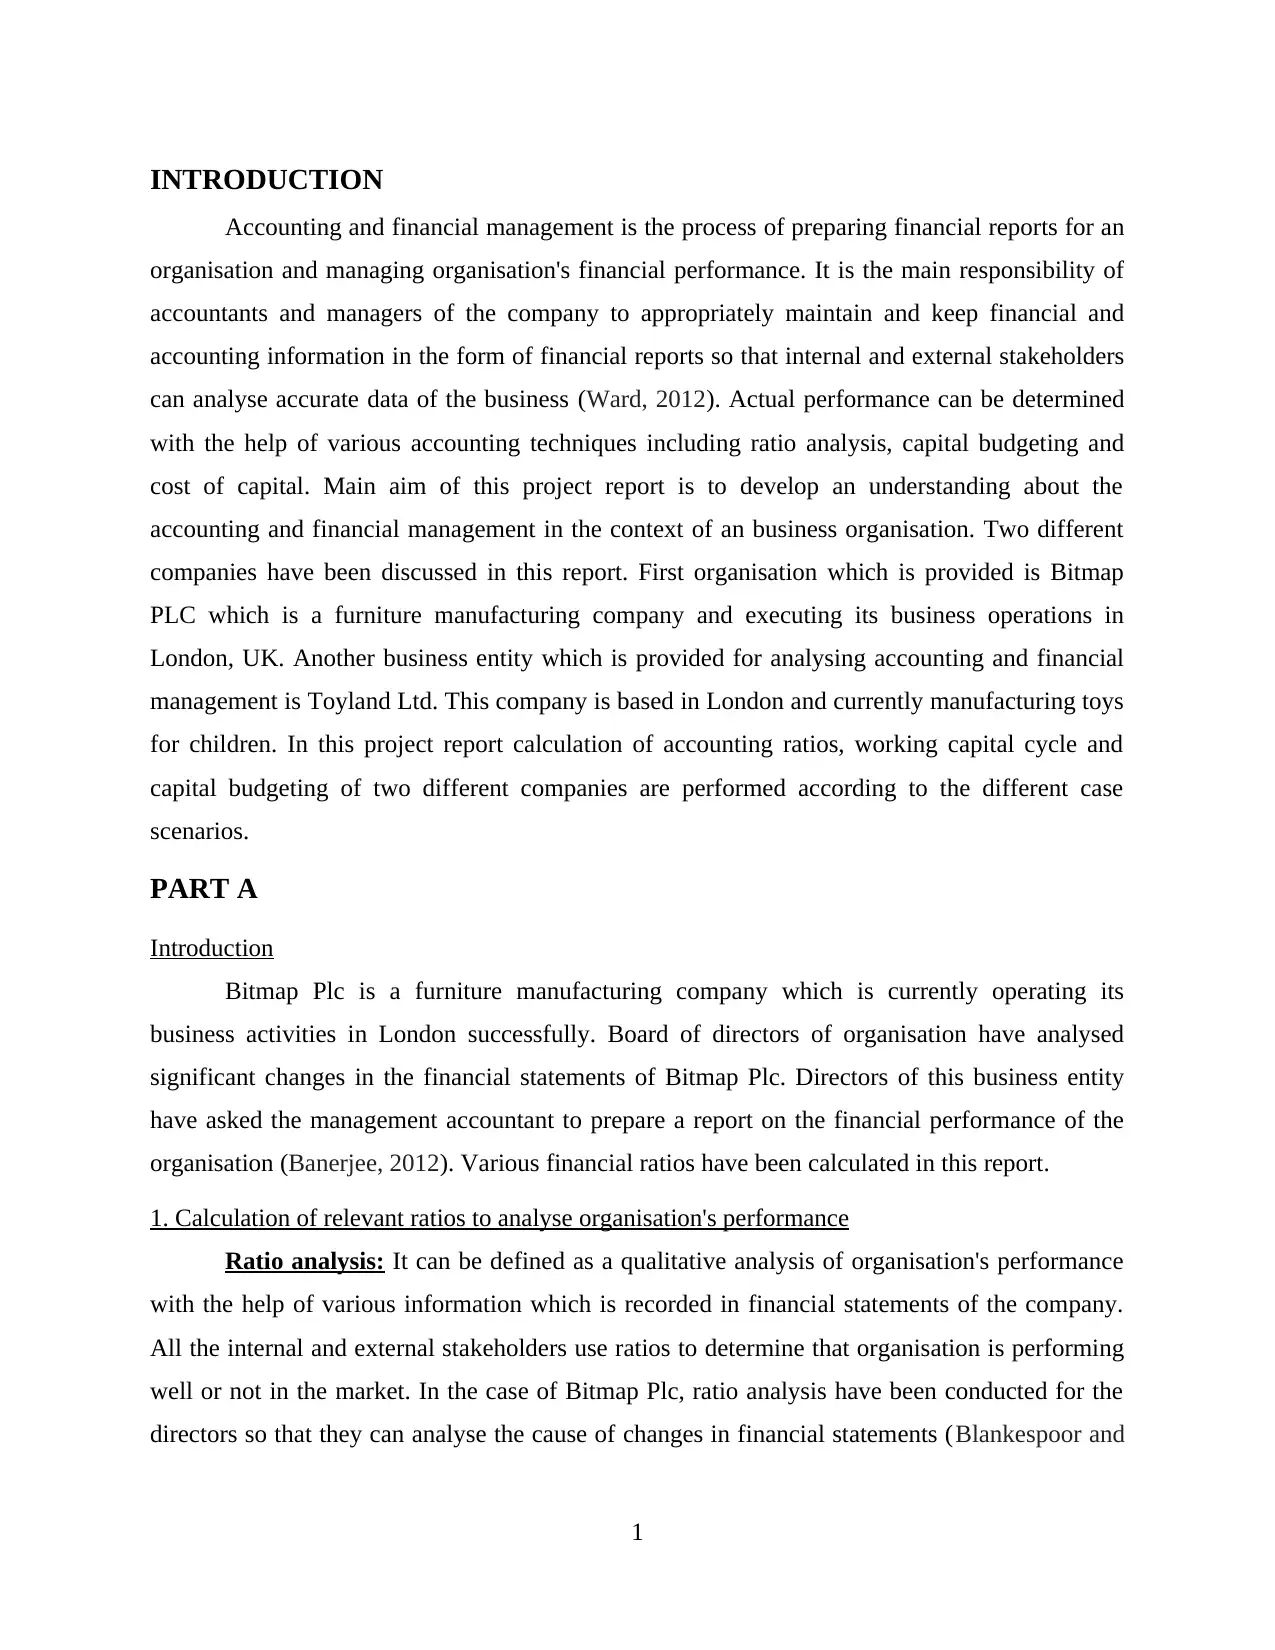
INTRODUCTION
Accounting and financial management is the process of preparing financial reports for an
organisation and managing organisation's financial performance. It is the main responsibility of
accountants and managers of the company to appropriately maintain and keep financial and
accounting information in the form of financial reports so that internal and external stakeholders
can analyse accurate data of the business (Ward, 2012). Actual performance can be determined
with the help of various accounting techniques including ratio analysis, capital budgeting and
cost of capital. Main aim of this project report is to develop an understanding about the
accounting and financial management in the context of an business organisation. Two different
companies have been discussed in this report. First organisation which is provided is Bitmap
PLC which is a furniture manufacturing company and executing its business operations in
London, UK. Another business entity which is provided for analysing accounting and financial
management is Toyland Ltd. This company is based in London and currently manufacturing toys
for children. In this project report calculation of accounting ratios, working capital cycle and
capital budgeting of two different companies are performed according to the different case
scenarios.
PART A
Introduction
Bitmap Plc is a furniture manufacturing company which is currently operating its
business activities in London successfully. Board of directors of organisation have analysed
significant changes in the financial statements of Bitmap Plc. Directors of this business entity
have asked the management accountant to prepare a report on the financial performance of the
organisation (Banerjee, 2012). Various financial ratios have been calculated in this report.
1. Calculation of relevant ratios to analyse organisation's performance
Ratio analysis: It can be defined as a qualitative analysis of organisation's performance
with the help of various information which is recorded in financial statements of the company.
All the internal and external stakeholders use ratios to determine that organisation is performing
well or not in the market. In the case of Bitmap Plc, ratio analysis have been conducted for the
directors so that they can analyse the cause of changes in financial statements (Blankespoor and
1
⊘ This is a preview!⊘
Do you want full access?
Subscribe today to unlock all pages.
Trusted by 1+ million students worldwide
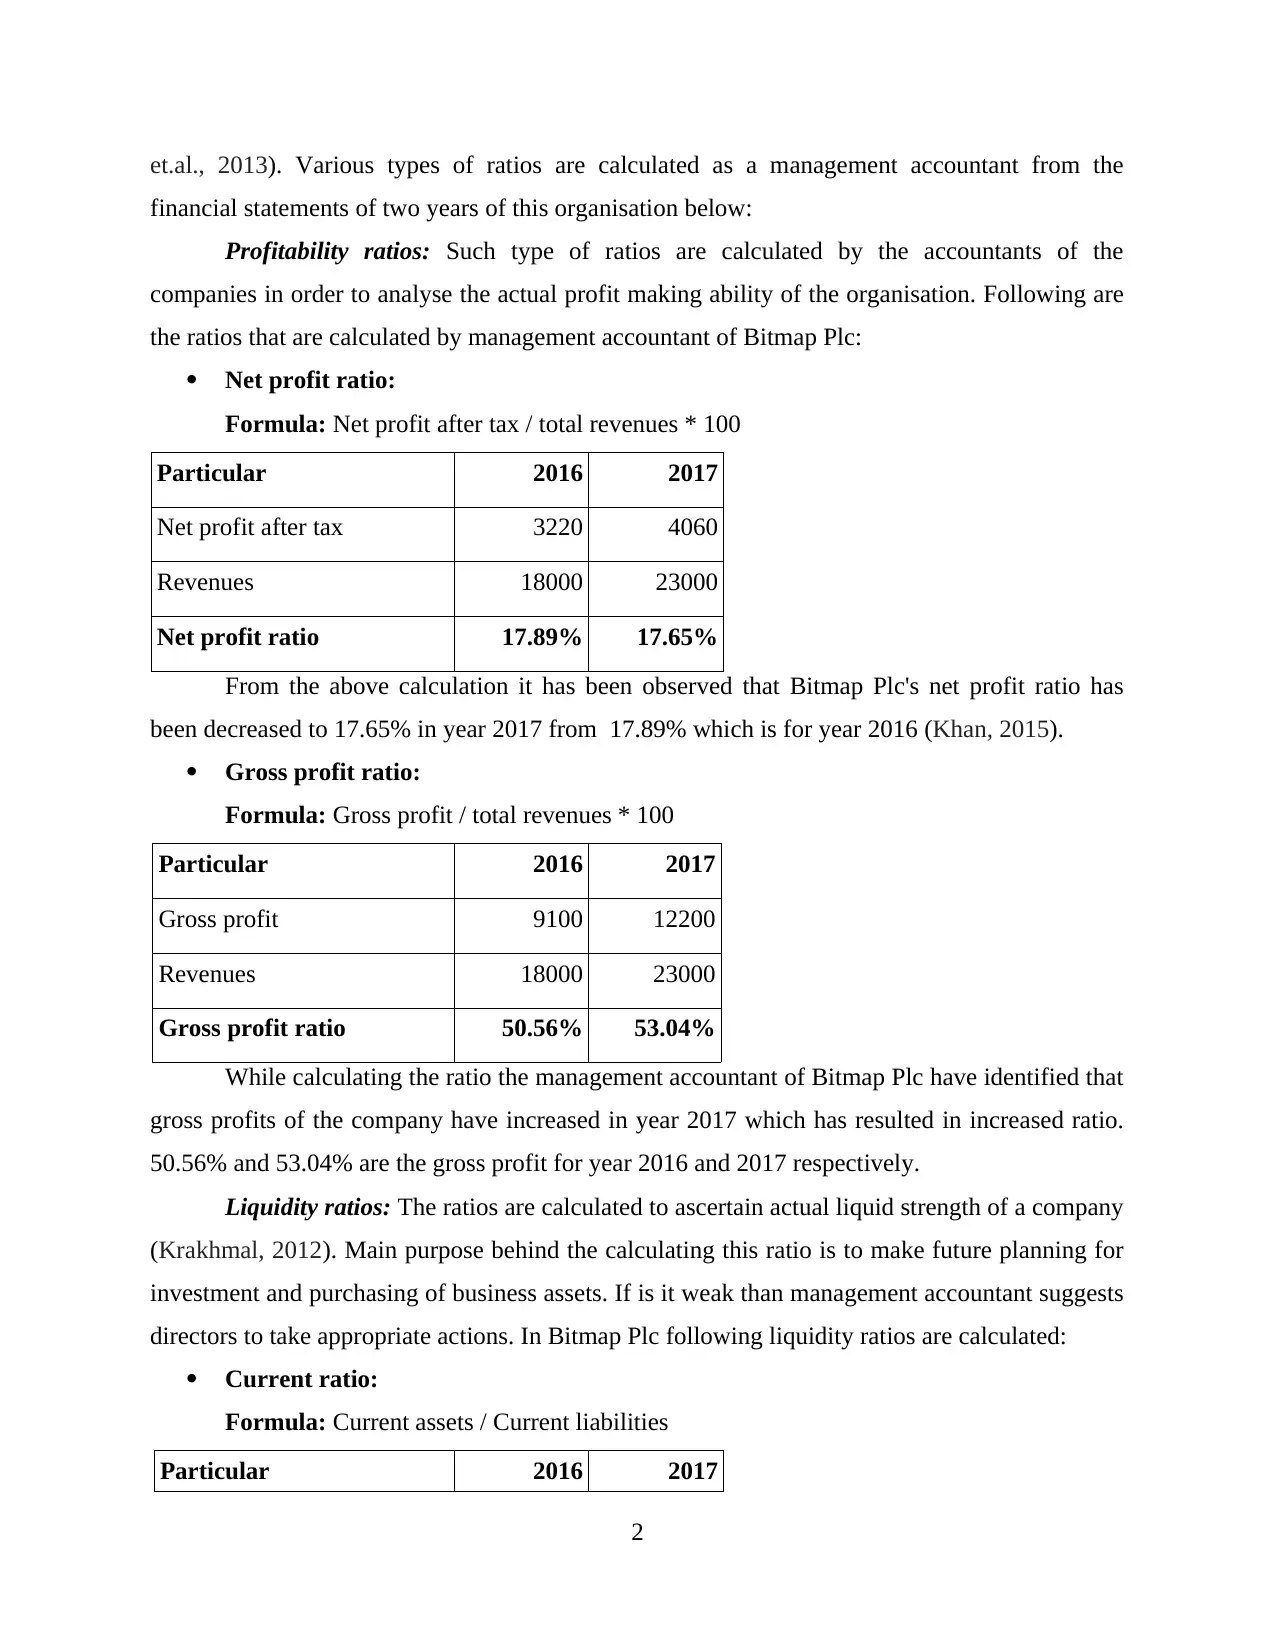
et.al., 2013). Various types of ratios are calculated as a management accountant from the
financial statements of two years of this organisation below:
Profitability ratios: Such type of ratios are calculated by the accountants of the
companies in order to analyse the actual profit making ability of the organisation. Following are
the ratios that are calculated by management accountant of Bitmap Plc:
Net profit ratio:
Formula: Net profit after tax / total revenues * 100
Particular 2016 2017
Net profit after tax 3220 4060
Revenues 18000 23000
Net profit ratio 17.89% 17.65%
From the above calculation it has been observed that Bitmap Plc's net profit ratio has
been decreased to 17.65% in year 2017 from 17.89% which is for year 2016 (Khan, 2015).
Gross profit ratio:
Formula: Gross profit / total revenues * 100
Particular 2016 2017
Gross profit 9100 12200
Revenues 18000 23000
Gross profit ratio 50.56% 53.04%
While calculating the ratio the management accountant of Bitmap Plc have identified that
gross profits of the company have increased in year 2017 which has resulted in increased ratio.
50.56% and 53.04% are the gross profit for year 2016 and 2017 respectively.
Liquidity ratios: The ratios are calculated to ascertain actual liquid strength of a company
(Krakhmal, 2012). Main purpose behind the calculating this ratio is to make future planning for
investment and purchasing of business assets. If is it weak than management accountant suggests
directors to take appropriate actions. In Bitmap Plc following liquidity ratios are calculated:
Current ratio:
Formula: Current assets / Current liabilities
Particular 2016 2017
2
Paraphrase This Document
Need a fresh take? Get an instant paraphrase of this document with our AI Paraphraser
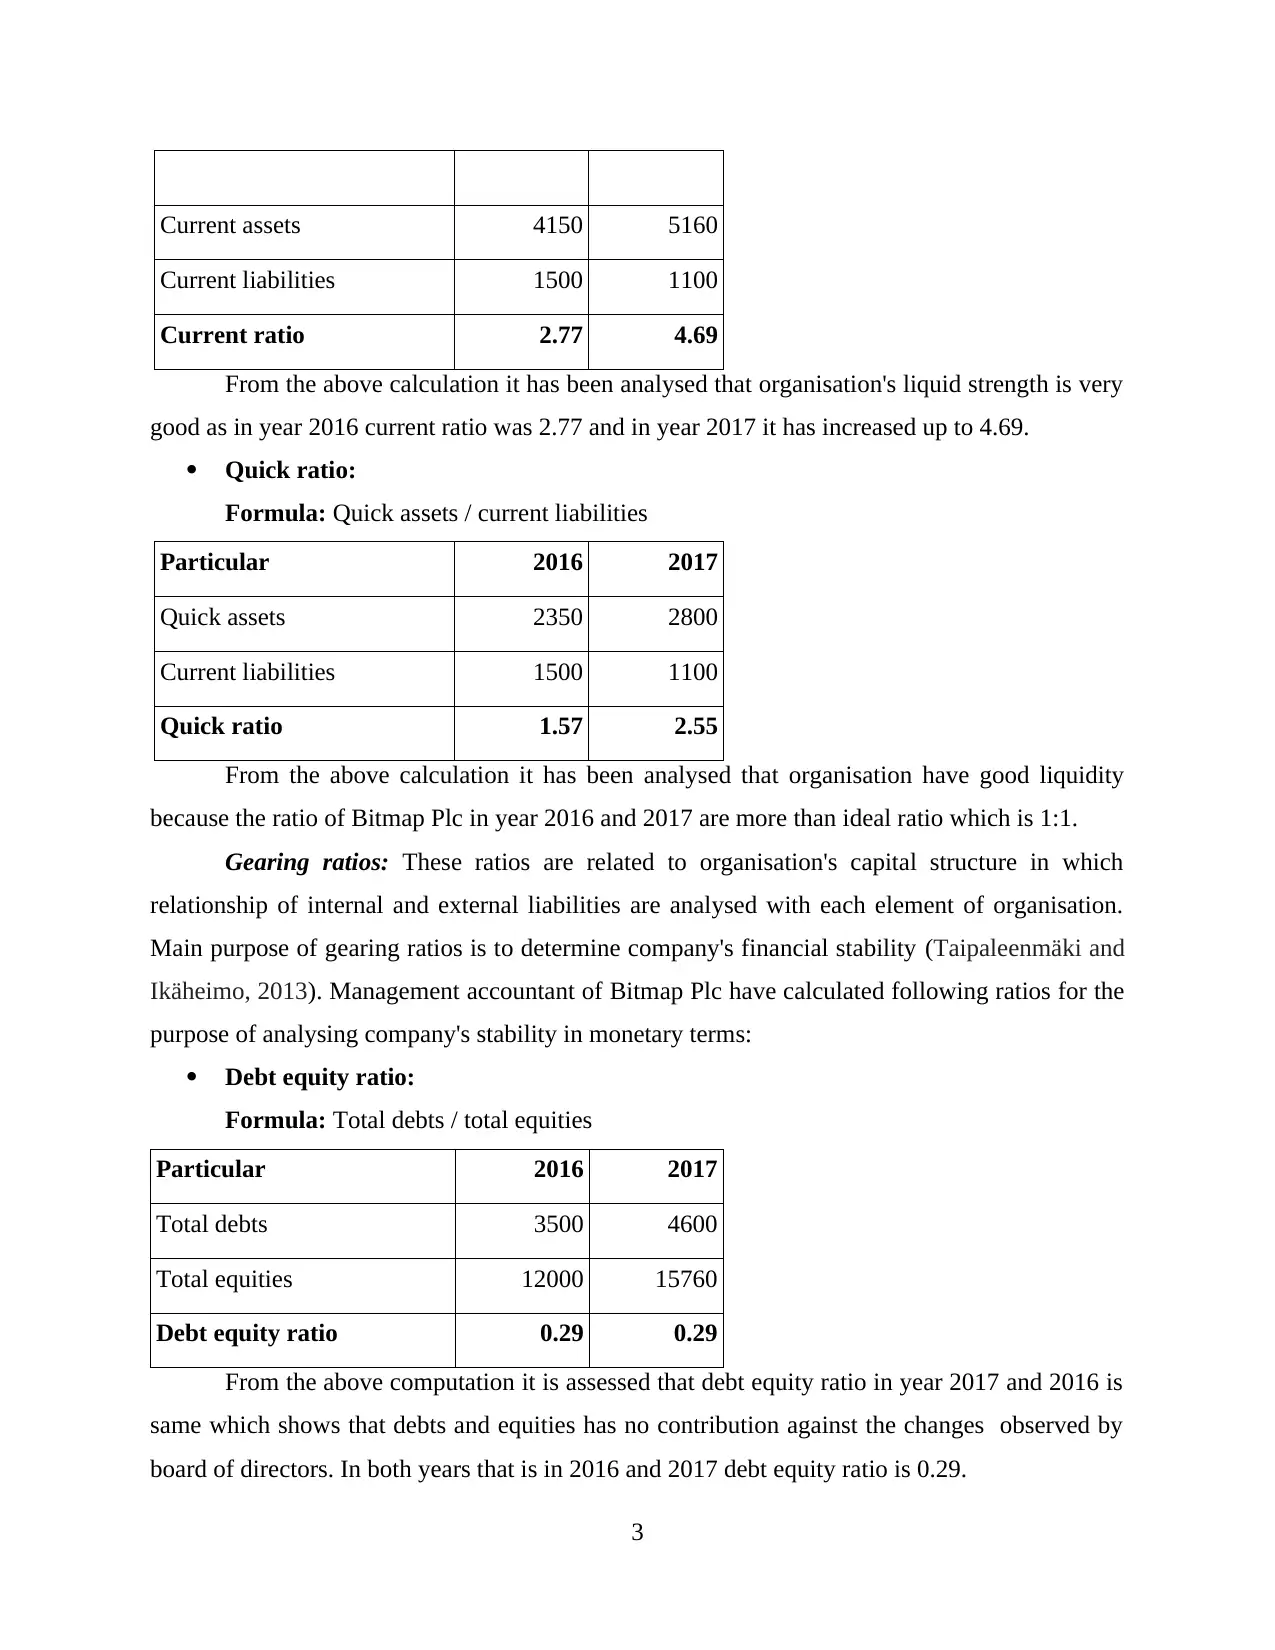
Current assets 4150 5160
Current liabilities 1500 1100
Current ratio 2.77 4.69
From the above calculation it has been analysed that organisation's liquid strength is very
good as in year 2016 current ratio was 2.77 and in year 2017 it has increased up to 4.69.
Quick ratio:
Formula: Quick assets / current liabilities
Particular 2016 2017
Quick assets 2350 2800
Current liabilities 1500 1100
Quick ratio 1.57 2.55
From the above calculation it has been analysed that organisation have good liquidity
because the ratio of Bitmap Plc in year 2016 and 2017 are more than ideal ratio which is 1:1.
Gearing ratios: These ratios are related to organisation's capital structure in which
relationship of internal and external liabilities are analysed with each element of organisation.
Main purpose of gearing ratios is to determine company's financial stability (Taipaleenmäki and
Ikäheimo, 2013). Management accountant of Bitmap Plc have calculated following ratios for the
purpose of analysing company's stability in monetary terms:
Debt equity ratio:
Formula: Total debts / total equities
Particular 2016 2017
Total debts 3500 4600
Total equities 12000 15760
Debt equity ratio 0.29 0.29
From the above computation it is assessed that debt equity ratio in year 2017 and 2016 is
same which shows that debts and equities has no contribution against the changes observed by
board of directors. In both years that is in 2016 and 2017 debt equity ratio is 0.29.
3
Current liabilities 1500 1100
Current ratio 2.77 4.69
From the above calculation it has been analysed that organisation's liquid strength is very
good as in year 2016 current ratio was 2.77 and in year 2017 it has increased up to 4.69.
Quick ratio:
Formula: Quick assets / current liabilities
Particular 2016 2017
Quick assets 2350 2800
Current liabilities 1500 1100
Quick ratio 1.57 2.55
From the above calculation it has been analysed that organisation have good liquidity
because the ratio of Bitmap Plc in year 2016 and 2017 are more than ideal ratio which is 1:1.
Gearing ratios: These ratios are related to organisation's capital structure in which
relationship of internal and external liabilities are analysed with each element of organisation.
Main purpose of gearing ratios is to determine company's financial stability (Taipaleenmäki and
Ikäheimo, 2013). Management accountant of Bitmap Plc have calculated following ratios for the
purpose of analysing company's stability in monetary terms:
Debt equity ratio:
Formula: Total debts / total equities
Particular 2016 2017
Total debts 3500 4600
Total equities 12000 15760
Debt equity ratio 0.29 0.29
From the above computation it is assessed that debt equity ratio in year 2017 and 2016 is
same which shows that debts and equities has no contribution against the changes observed by
board of directors. In both years that is in 2016 and 2017 debt equity ratio is 0.29.
3
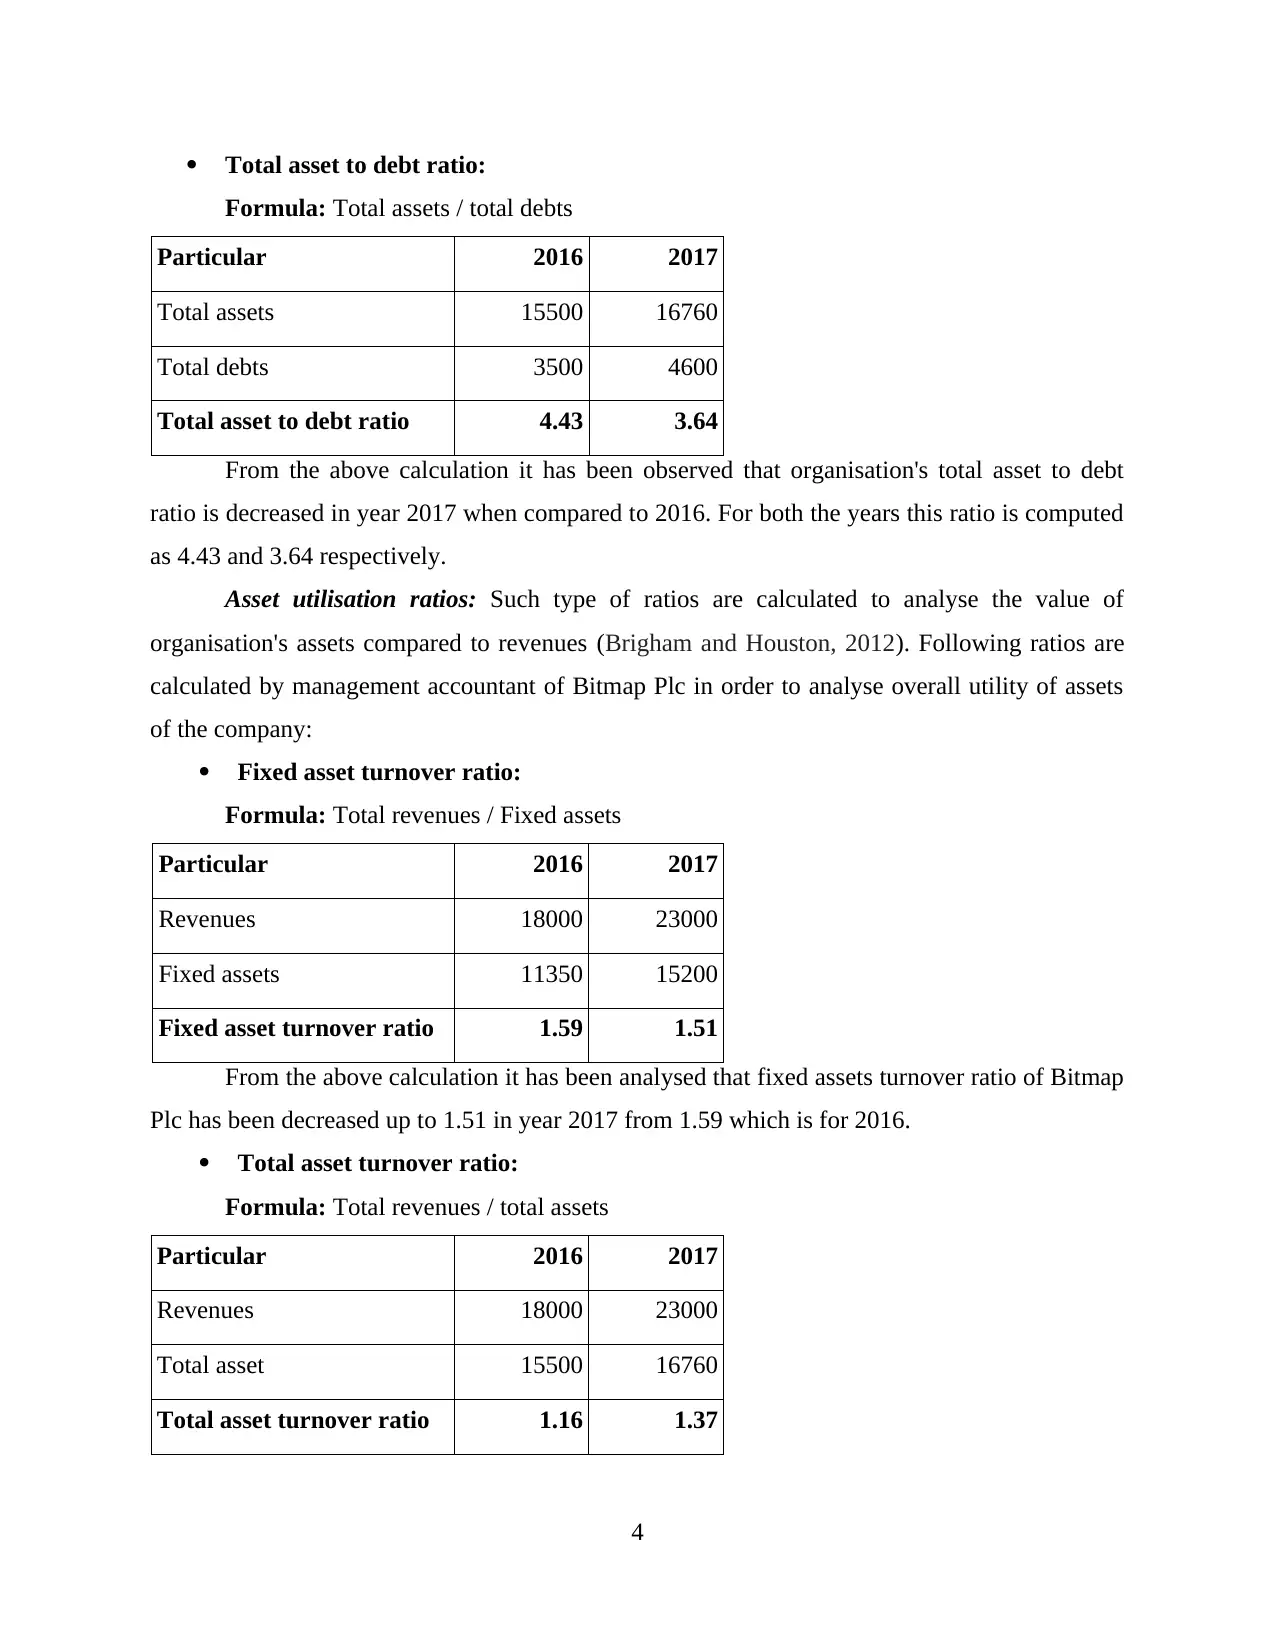
Total asset to debt ratio:
Formula: Total assets / total debts
Particular 2016 2017
Total assets 15500 16760
Total debts 3500 4600
Total asset to debt ratio 4.43 3.64
From the above calculation it has been observed that organisation's total asset to debt
ratio is decreased in year 2017 when compared to 2016. For both the years this ratio is computed
as 4.43 and 3.64 respectively.
Asset utilisation ratios: Such type of ratios are calculated to analyse the value of
organisation's assets compared to revenues (Brigham and Houston, 2012). Following ratios are
calculated by management accountant of Bitmap Plc in order to analyse overall utility of assets
of the company:
Fixed asset turnover ratio:
Formula: Total revenues / Fixed assets
Particular 2016 2017
Revenues 18000 23000
Fixed assets 11350 15200
Fixed asset turnover ratio 1.59 1.51
From the above calculation it has been analysed that fixed assets turnover ratio of Bitmap
Plc has been decreased up to 1.51 in year 2017 from 1.59 which is for 2016.
Total asset turnover ratio:
Formula: Total revenues / total assets
Particular 2016 2017
Revenues 18000 23000
Total asset 15500 16760
Total asset turnover ratio 1.16 1.37
4
⊘ This is a preview!⊘
Do you want full access?
Subscribe today to unlock all pages.
Trusted by 1+ million students worldwide
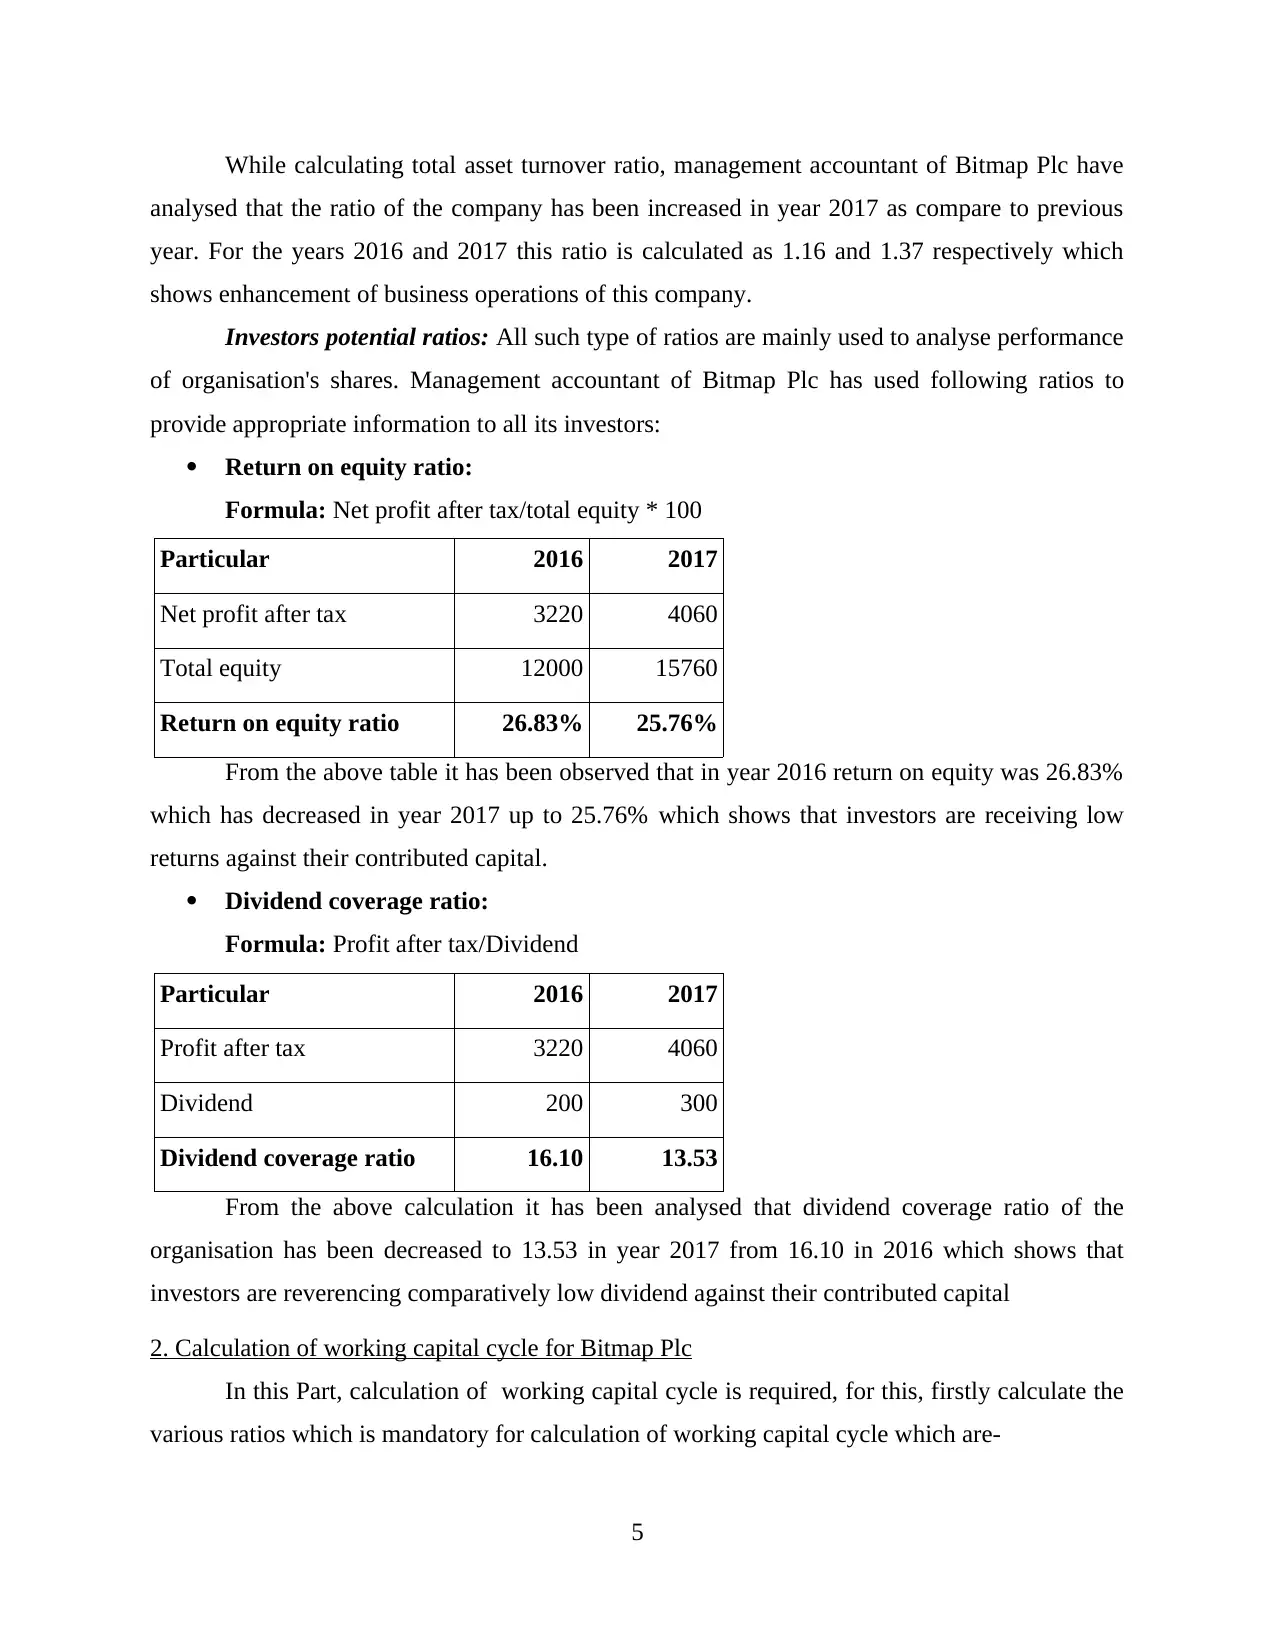
While calculating total asset turnover ratio, management accountant of Bitmap Plc have
analysed that the ratio of the company has been increased in year 2017 as compare to previous
year. For the years 2016 and 2017 this ratio is calculated as 1.16 and 1.37 respectively which
shows enhancement of business operations of this company.
Investors potential ratios: All such type of ratios are mainly used to analyse performance
of organisation's shares. Management accountant of Bitmap Plc has used following ratios to
provide appropriate information to all its investors:
Return on equity ratio:
Formula: Net profit after tax/total equity * 100
Particular 2016 2017
Net profit after tax 3220 4060
Total equity 12000 15760
Return on equity ratio 26.83% 25.76%
From the above table it has been observed that in year 2016 return on equity was 26.83%
which has decreased in year 2017 up to 25.76% which shows that investors are receiving low
returns against their contributed capital.
Dividend coverage ratio:
Formula: Profit after tax/Dividend
Particular 2016 2017
Profit after tax 3220 4060
Dividend 200 300
Dividend coverage ratio 16.10 13.53
From the above calculation it has been analysed that dividend coverage ratio of the
organisation has been decreased to 13.53 in year 2017 from 16.10 in 2016 which shows that
investors are reverencing comparatively low dividend against their contributed capital
2. Calculation of working capital cycle for Bitmap Plc
In this Part, calculation of working capital cycle is required, for this, firstly calculate the
various ratios which is mandatory for calculation of working capital cycle which are-
5
Paraphrase This Document
Need a fresh take? Get an instant paraphrase of this document with our AI Paraphraser
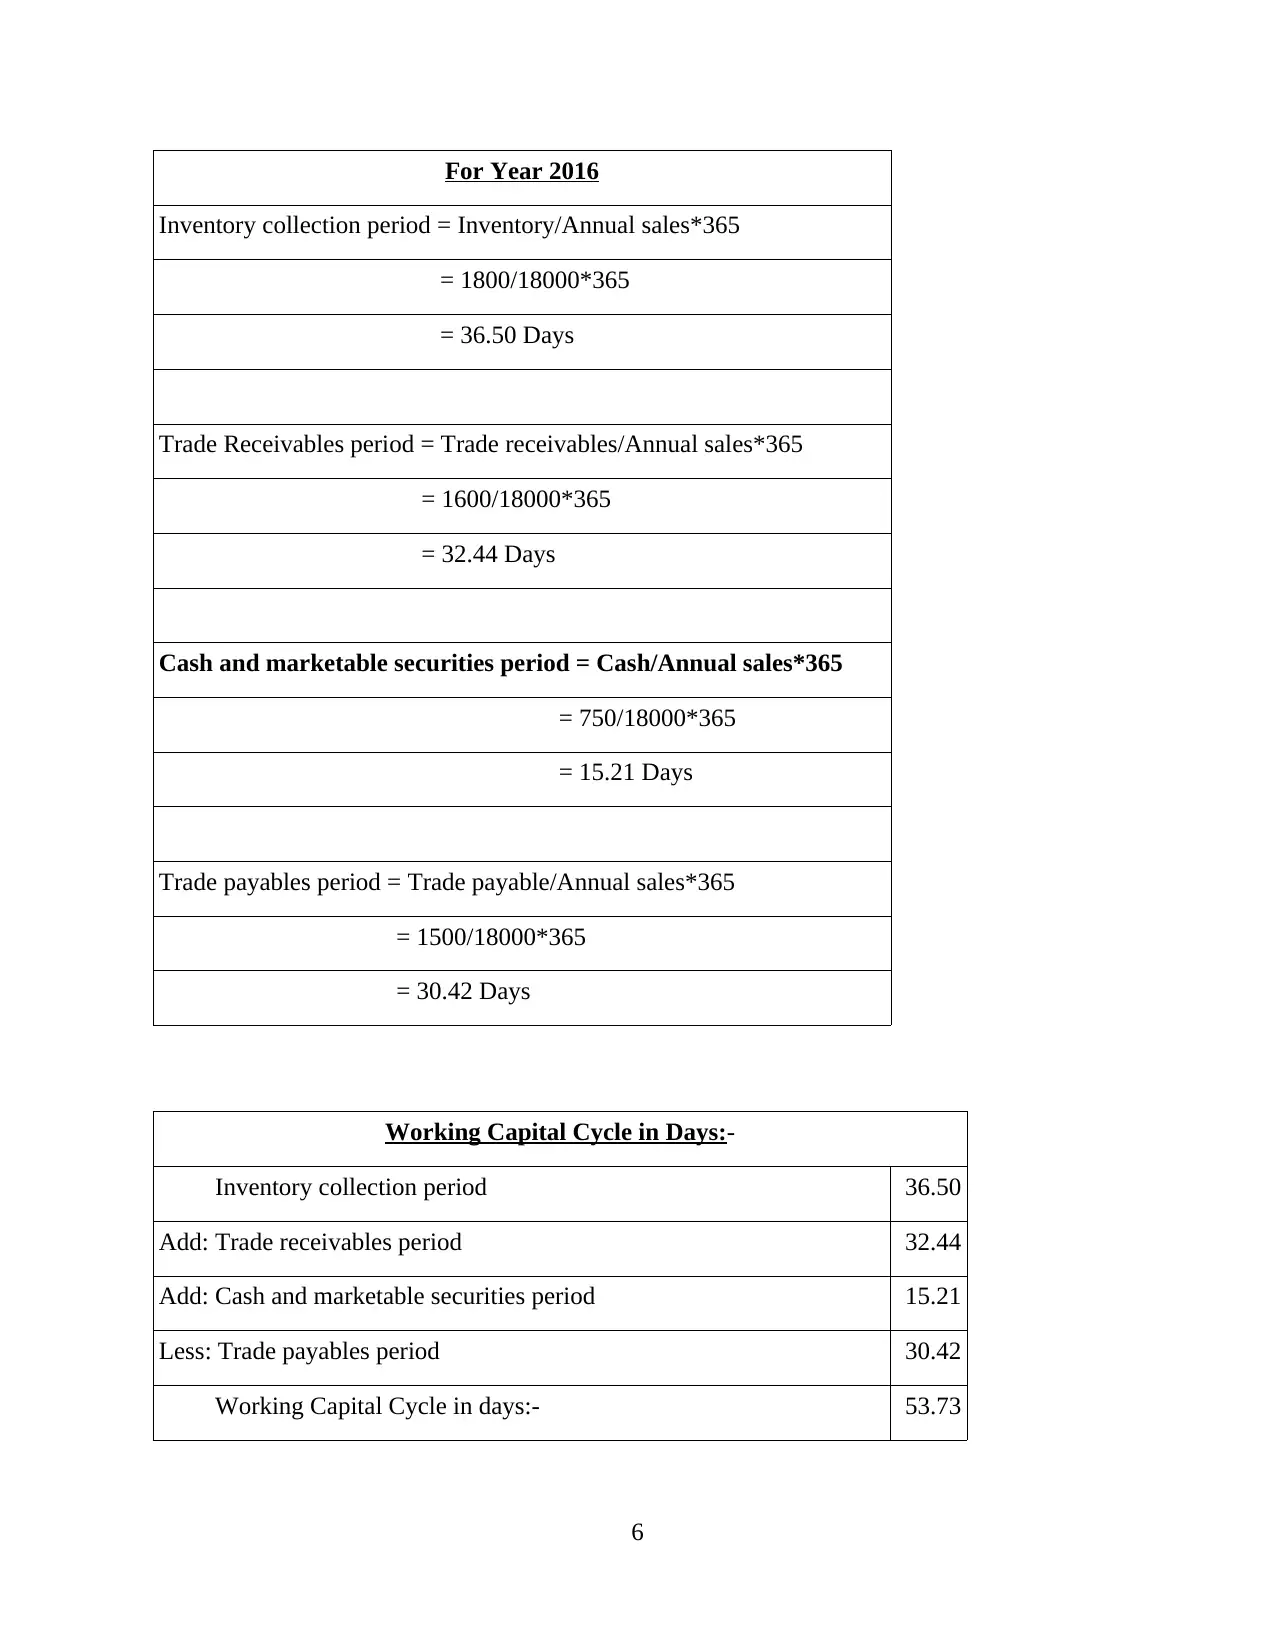
For Year 2016
Inventory collection period = Inventory/Annual sales*365
= 1800/18000*365
= 36.50 Days
Trade Receivables period = Trade receivables/Annual sales*365
= 1600/18000*365
= 32.44 Days
Cash and marketable securities period = Cash/Annual sales*365
= 750/18000*365
= 15.21 Days
Trade payables period = Trade payable/Annual sales*365
= 1500/18000*365
= 30.42 Days
Working Capital Cycle in Days:-
Inventory collection period 36.50
Add: Trade receivables period 32.44
Add: Cash and marketable securities period 15.21
Less: Trade payables period 30.42
Working Capital Cycle in days:- 53.73
6
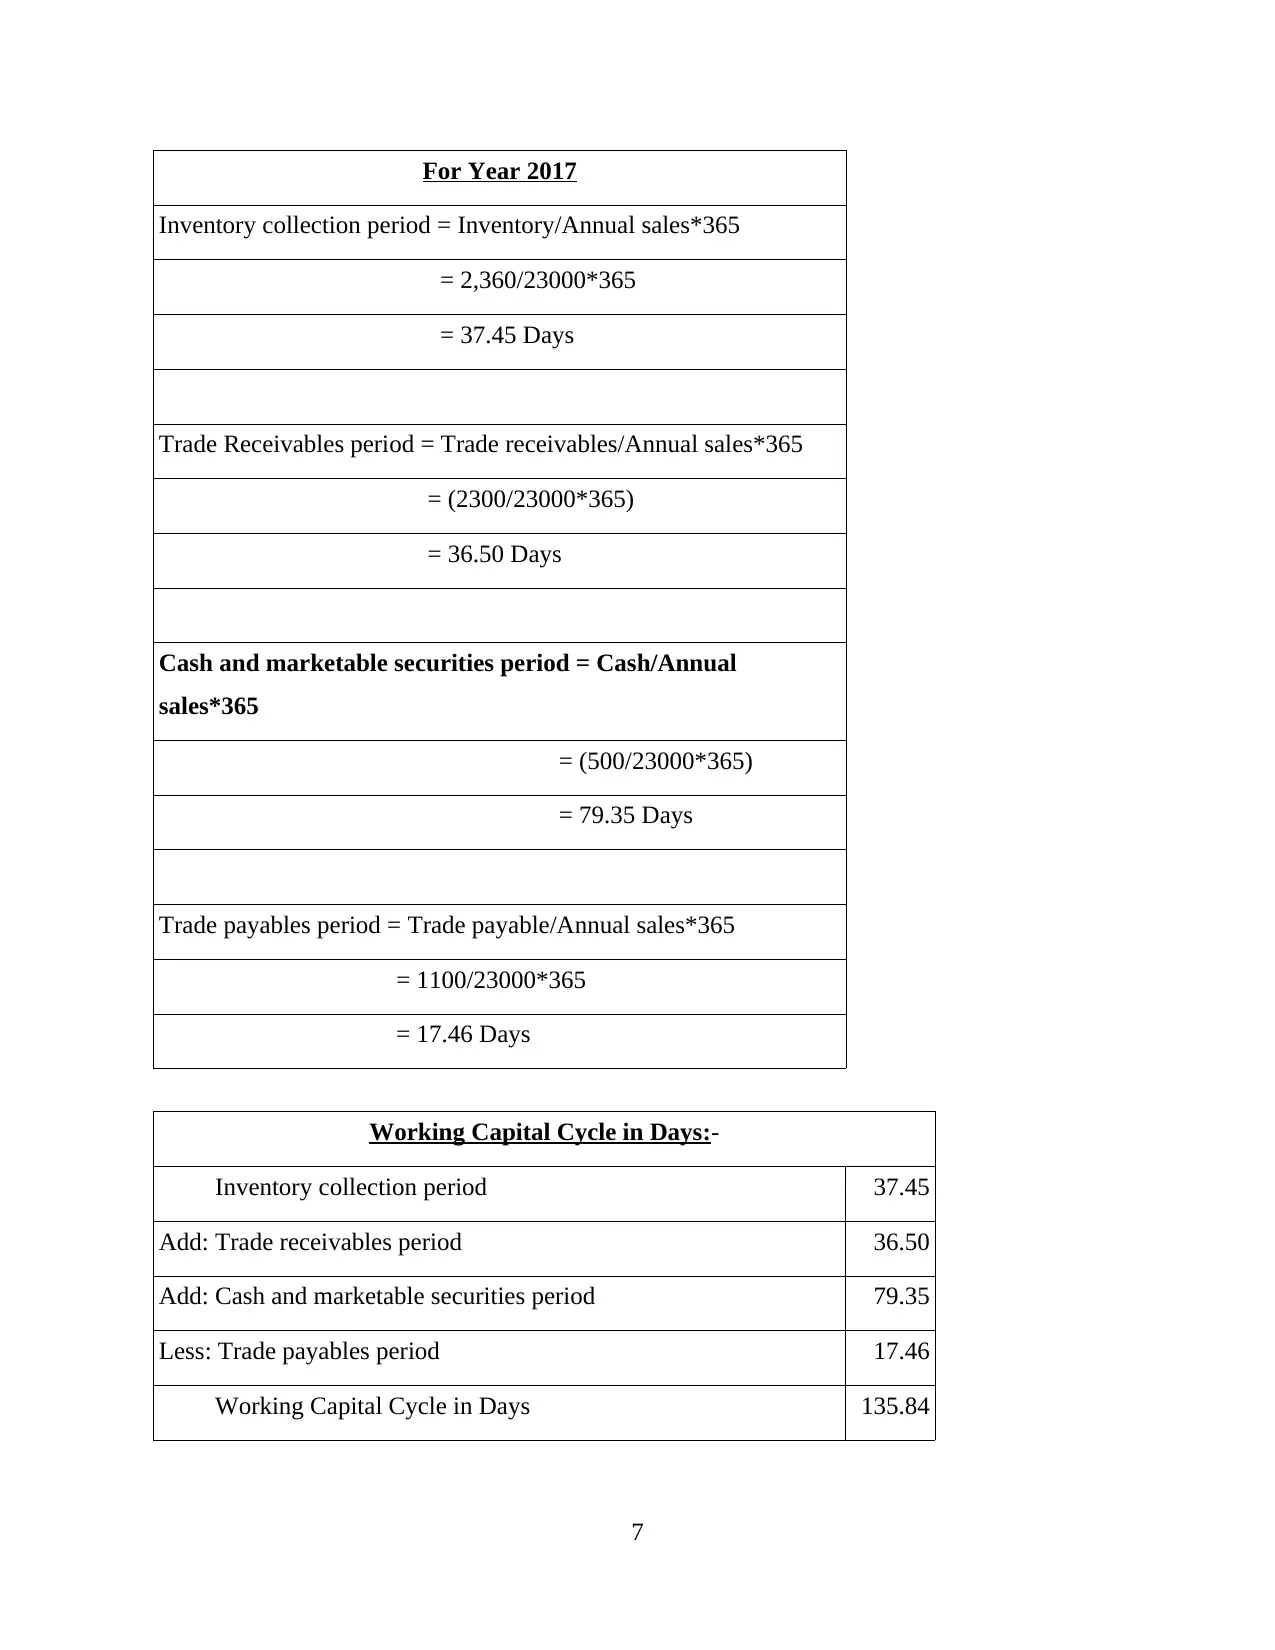
For Year 2017
Inventory collection period = Inventory/Annual sales*365
= 2,360/23000*365
= 37.45 Days
Trade Receivables period = Trade receivables/Annual sales*365
= (2300/23000*365)
= 36.50 Days
Cash and marketable securities period = Cash/Annual
sales*365
= (500/23000*365)
= 79.35 Days
Trade payables period = Trade payable/Annual sales*365
= 1100/23000*365
= 17.46 Days
Working Capital Cycle in Days:-
Inventory collection period 37.45
Add: Trade receivables period 36.50
Add: Cash and marketable securities period 79.35
Less: Trade payables period 17.46
Working Capital Cycle in Days 135.84
7
⊘ This is a preview!⊘
Do you want full access?
Subscribe today to unlock all pages.
Trusted by 1+ million students worldwide
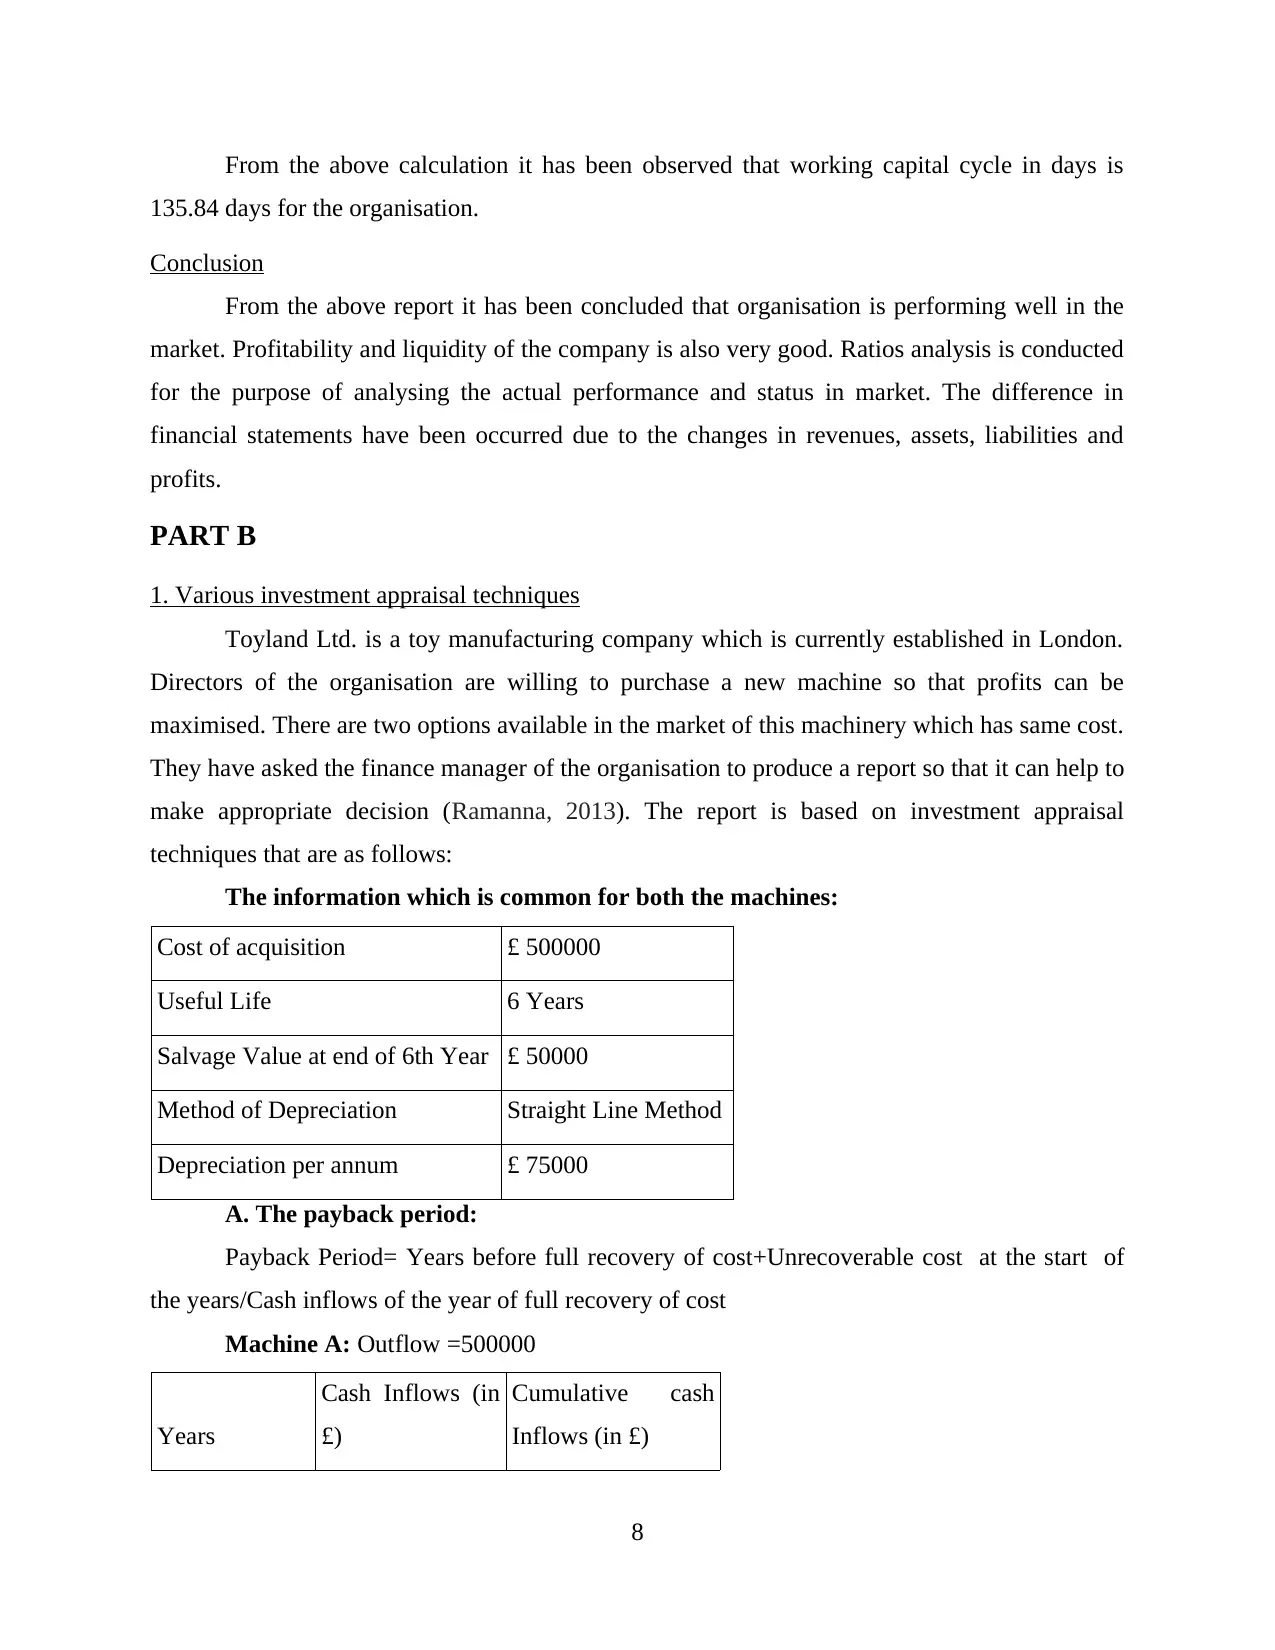
From the above calculation it has been observed that working capital cycle in days is
135.84 days for the organisation.
Conclusion
From the above report it has been concluded that organisation is performing well in the
market. Profitability and liquidity of the company is also very good. Ratios analysis is conducted
for the purpose of analysing the actual performance and status in market. The difference in
financial statements have been occurred due to the changes in revenues, assets, liabilities and
profits.
PART B
1. Various investment appraisal techniques
Toyland Ltd. is a toy manufacturing company which is currently established in London.
Directors of the organisation are willing to purchase a new machine so that profits can be
maximised. There are two options available in the market of this machinery which has same cost.
They have asked the finance manager of the organisation to produce a report so that it can help to
make appropriate decision (Ramanna, 2013). The report is based on investment appraisal
techniques that are as follows:
The information which is common for both the machines:
Cost of acquisition £ 500000
Useful Life 6 Years
Salvage Value at end of 6th Year £ 50000
Method of Depreciation Straight Line Method
Depreciation per annum £ 75000
A. The payback period:
Payback Period= Years before full recovery of cost+Unrecoverable cost at the start of
the years/Cash inflows of the year of full recovery of cost
Machine A: Outflow =500000
Years
Cash Inflows (in
£)
Cumulative cash
Inflows (in £)
8
Paraphrase This Document
Need a fresh take? Get an instant paraphrase of this document with our AI Paraphraser
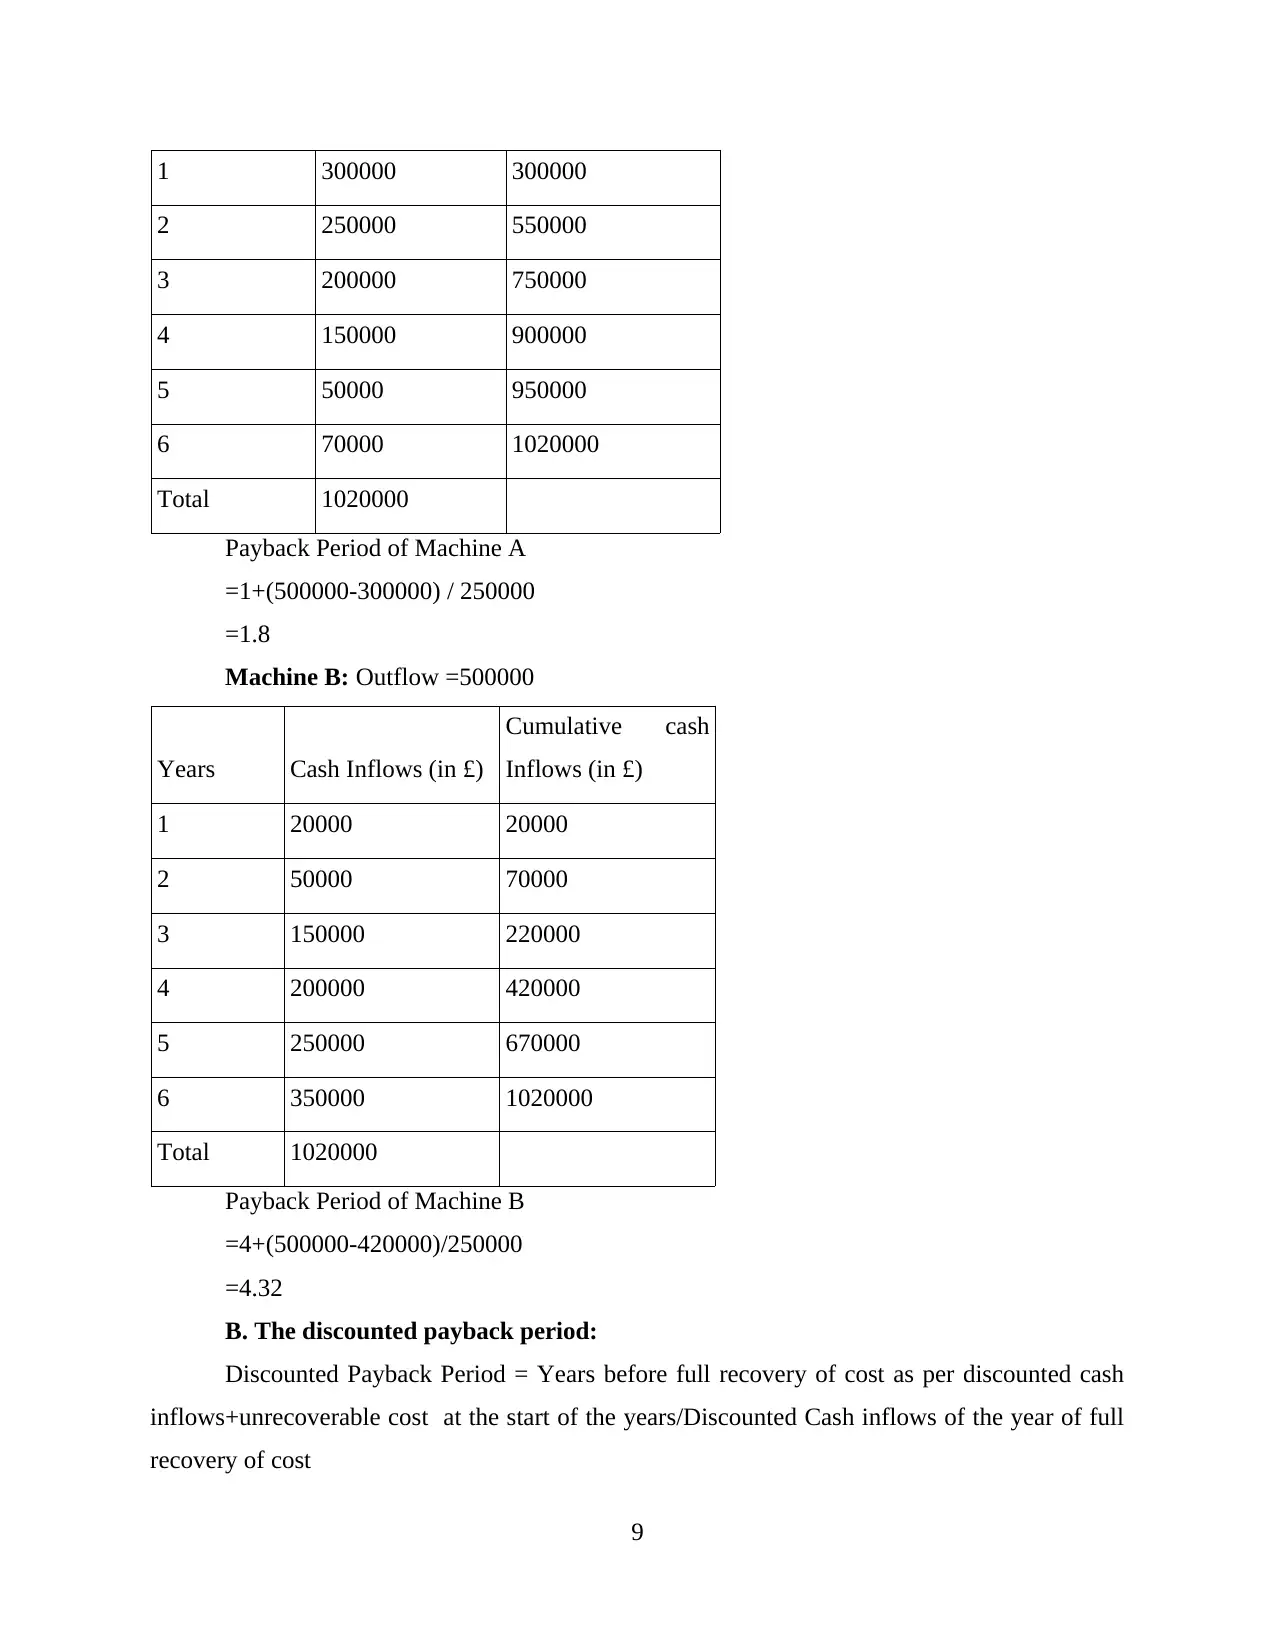
1 300000 300000
2 250000 550000
3 200000 750000
4 150000 900000
5 50000 950000
6 70000 1020000
Total 1020000
Payback Period of Machine A
=1+(500000-300000) / 250000
=1.8
Machine B: Outflow =500000
Years Cash Inflows (in £)
Cumulative cash
Inflows (in £)
1 20000 20000
2 50000 70000
3 150000 220000
4 200000 420000
5 250000 670000
6 350000 1020000
Total 1020000
Payback Period of Machine B
=4+(500000-420000)/250000
=4.32
B. The discounted payback period:
Discounted Payback Period = Years before full recovery of cost as per discounted cash
inflows+unrecoverable cost at the start of the years/Discounted Cash inflows of the year of full
recovery of cost
9
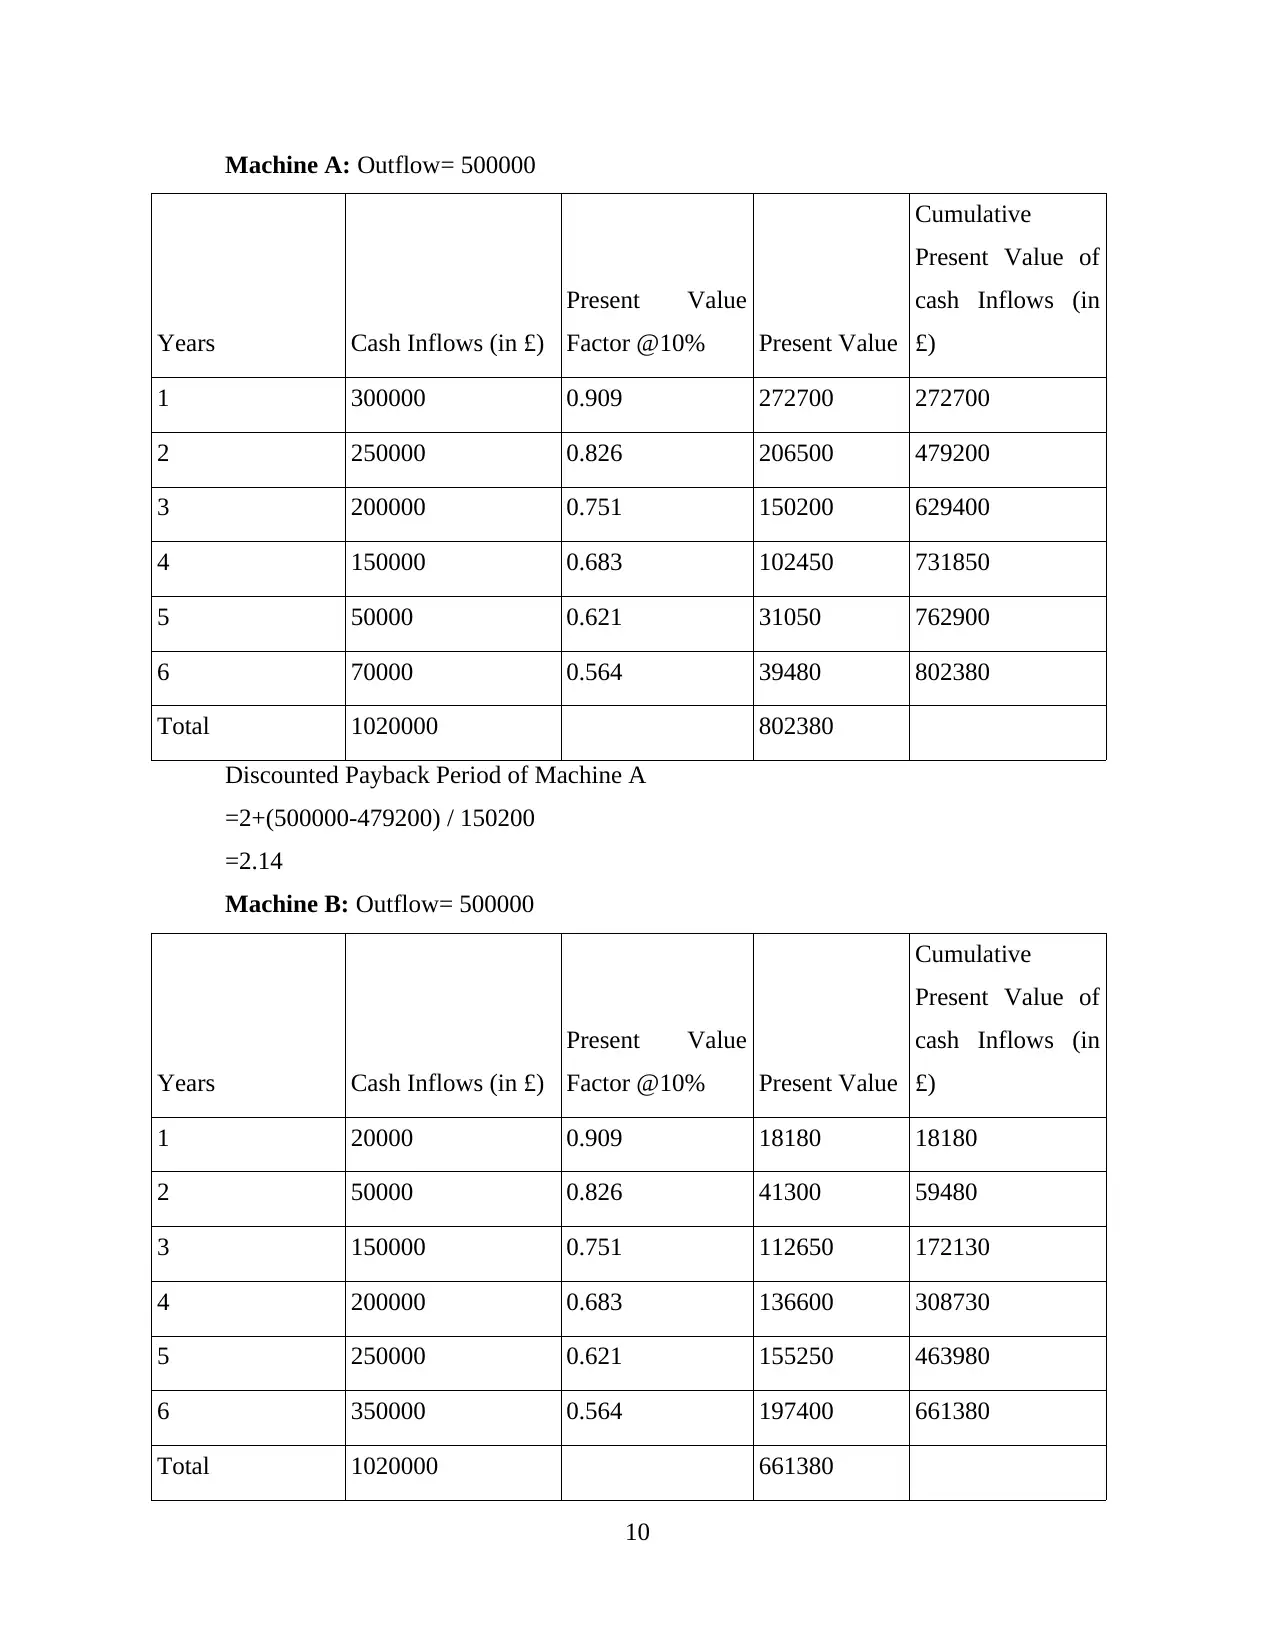
Machine A: Outflow= 500000
Years Cash Inflows (in £)
Present Value
Factor @10% Present Value
Cumulative
Present Value of
cash Inflows (in
£)
1 300000 0.909 272700 272700
2 250000 0.826 206500 479200
3 200000 0.751 150200 629400
4 150000 0.683 102450 731850
5 50000 0.621 31050 762900
6 70000 0.564 39480 802380
Total 1020000 802380
Discounted Payback Period of Machine A
=2+(500000-479200) / 150200
=2.14
Machine B: Outflow= 500000
Years Cash Inflows (in £)
Present Value
Factor @10% Present Value
Cumulative
Present Value of
cash Inflows (in
£)
1 20000 0.909 18180 18180
2 50000 0.826 41300 59480
3 150000 0.751 112650 172130
4 200000 0.683 136600 308730
5 250000 0.621 155250 463980
6 350000 0.564 197400 661380
Total 1020000 661380
10
Years Cash Inflows (in £)
Present Value
Factor @10% Present Value
Cumulative
Present Value of
cash Inflows (in
£)
1 300000 0.909 272700 272700
2 250000 0.826 206500 479200
3 200000 0.751 150200 629400
4 150000 0.683 102450 731850
5 50000 0.621 31050 762900
6 70000 0.564 39480 802380
Total 1020000 802380
Discounted Payback Period of Machine A
=2+(500000-479200) / 150200
=2.14
Machine B: Outflow= 500000
Years Cash Inflows (in £)
Present Value
Factor @10% Present Value
Cumulative
Present Value of
cash Inflows (in
£)
1 20000 0.909 18180 18180
2 50000 0.826 41300 59480
3 150000 0.751 112650 172130
4 200000 0.683 136600 308730
5 250000 0.621 155250 463980
6 350000 0.564 197400 661380
Total 1020000 661380
10
⊘ This is a preview!⊘
Do you want full access?
Subscribe today to unlock all pages.
Trusted by 1+ million students worldwide
1 out of 21
Related Documents


Your All-in-One AI-Powered Toolkit for Academic Success.
+13062052269
info@desklib.com
Available 24*7 on WhatsApp / Email
![[object Object]](/_next/static/media/star-bottom.7253800d.svg)
Unlock your academic potential
Copyright © 2020–2026 A2Z Services. All Rights Reserved. Developed and managed by ZUCOL.