Accounting and Financial Management Report: Bitmap Plc and Toyland Ltd
VerifiedAdded on 2020/10/22
|19
|4889
|130
Report
AI Summary
This report presents a comprehensive financial analysis of two companies: Bitmap Plc, a furniture manufacturer, and Toyland Ltd, a toy manufacturer. The analysis begins with an examination of Bitmap Plc's financial performance, including the calculation of various financial ratios such as profitability, liquidity, gearing, asset utilization, and investor potential ratios for the years 2016 and 2017. The report then assesses the company's working capital cycle. The second part of the report shifts focus to Toyland Ltd, exploring different investment appraisal techniques like payback period and discounted payback period, along with their benefits and limitations. Finally, the report discusses effective sources of funds and the relationship between budgets, strategic plans, and objectives within an organization, providing a complete overview of financial management principles and their application in real-world scenarios.

Accounting and
Financial Management
Financial Management
Paraphrase This Document
Need a fresh take? Get an instant paraphrase of this document with our AI Paraphraser
Table of Contents
INTRODUCTION...........................................................................................................................3
PART A...........................................................................................................................................3
Introduction.................................................................................................................................3
1. Computation of financial ratios in order to analyse performance of the company.................3
2. Computation of working capital cycle....................................................................................6
Conclusion...................................................................................................................................8
PART B............................................................................................................................................8
1. Different types of investment appraisal techniques................................................................8
2. Benefits and limitations of investment appraisal techniques................................................14
3. Effective sources of funds for the investment of Bitmap Plc................................................16
PART C..........................................................................................................................................16
1. Budget and its relationship with strategic plans and objective.............................................16
2. Budgeting process and interlinking of budgets that are used in an organisation..................17
CONCLUSION..............................................................................................................................18
REFENRENCES............................................................................................................................19
INTRODUCTION
Accounting and financial management is the process of formulating financial statements
and managing the performance of the organisation so that business can be executed successfully.
For all the managers it is very important to keep financial and accounting information in the form
of accounting reports so that stakeholders can analyse actual position of the company (Alves,
2012). Main aim of this assignment is to enhance knowledge about financial and accounting
management of an organisation. In this project report two different companies are going to be
analysed first one is Bitmap Plc which is a manufacturing company of furniture and established
in London, UK. Second company is Toyland Ltd which is a toy manufacturing company and
operating business in London. For the purpose of analysis, various topics are discussed under this
report that are financial ratios, working capital cycle, different types of investment appraisal
techniques their benefits and limitations and sources of funds. Budgets, budgeting process and
their relation with strategic plans and objectives are also covered in this report.
PART A
Introduction
Bitmap Plc is manufacturing company which is dealing in furniture and operating
business in London, UK. The Board of directors of the company have identified changes in
financial statements. They have asked the management accountants of Bitmap Plc to form a
report on the results of last two years of income statement and balance sheet. In this report
different financial ratios and working capital cycle have been calculated (Armstrong, 2014).
1. Computation of financial ratios in order to analyse performance of the company
Ratio analysis: It is a technique which is used by various organisations to evaluate their
profitability, efficiency, liquidity and other factors that may affect overall performance of
business operations. Management accountant of Bitmap Plc have been asked by the directors to
calculate financial ratios so that cause of changes in income statement and balance sheet can be
identified (Arroyo, 2012). Different types of profitability, gearing, liquidity, asset utilisation and
investors potential ratios are calculated in order to analyse actual performance of the company.
The calculations are as follows:
Profitability ratios: When the managers are willing to analyse actual profitability of the
company than such type of ratios can help to determine that company is generating
3
⊘ This is a preview!⊘
Do you want full access?
Subscribe today to unlock all pages.
Trusted by 1+ million students worldwide
profits or facing losses. It also guide stakeholders to evaluate organisation's ability to
acquire profits and this will help them to formulate appropriate decision regarding
investment, providing credit and other. The management accountant of Bitmap Plc
calculated gross profit and net profit ratio to determine overall profitability of the
company (Beatty and Liao, 2014).
Liquidity ratios: All ratios that are used to analyse organisations liquid strength are
called liquidity ratios. Current and quick ratios are calculated by management accountant
of Bitmap Plc to analyse overall liquidity of the organisation.
Gearing ratios: Such ratios that are related to capital structure of a company and
calculated to establish proper balance in to assets and liabilities are called gearing ratios.
It is focused with the assessment of long term financial stability of business entities. It
guides managers to analyse the proportion of funds which is related to internal and
external sources. Management accountant of Bitmap Plc have calculated debt equity and
total assets to debt ratio under gearing ratios.
Asset utilisation ratios: All the ratios that are mainly used to analyse that organisation is
appropriately using its assets to generate revenues or not. Management accountant of
Bitmap Plc calculated fixed assets and total assets turnover ratio to assess utility of assets
of the company.
Investors potential ratios: The ratios that are calculated to provide appropriation
information to investors are known as investor potential ratios. They use such ratios to
analyse the rate which is going to be offered by the company on the invested amount. In
Bitmap return on equity and dividend coverage ratios are calculated by management
accountant of the company (Cheng and et.al., 2014).
Name of the ratio Formula Calculation
R
a
t
i
o
2016 2017 2016 2017
Profitability ratios:
4
Paraphrase This Document
Need a fresh take? Get an instant paraphrase of this document with our AI Paraphraser
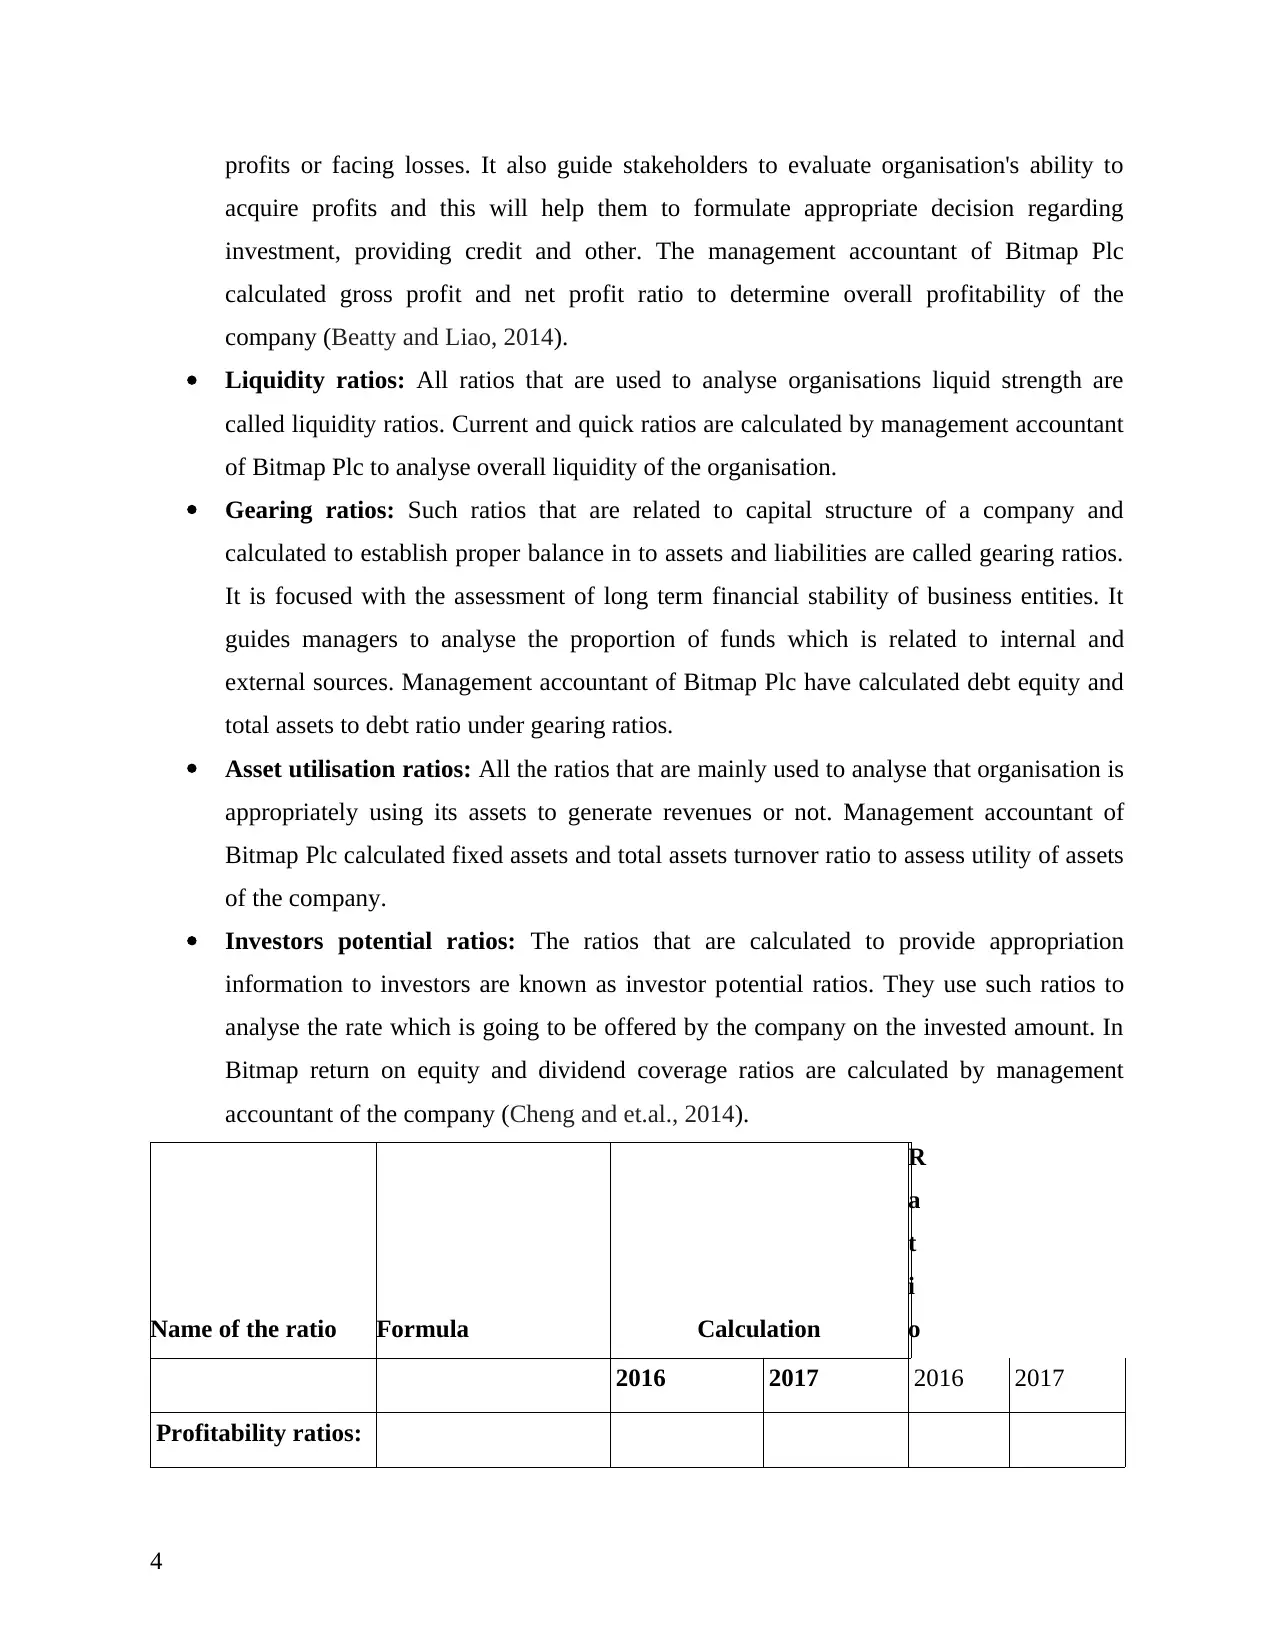
Gross profit ratio
Gross profit/total
revenues * 100
9100/18000*
100
12200*2300
0*100 50.56% 53.04%
Net profit ratio
Net profit after
tax/total revenues *
100
3220/18000*
100
4060/23000*
100 17.89% 17.65%
Liquidity ratios:
Current ratio
Current
assets/Current
liabilities 4150/1500 5160/1100 2.77 4.69
Quick ratio
Quick assets/current
liabilities 2350/1500 2800/1100 1.57 2.55
Gearing ratios:
Debt equity ratio
Total debts/total
equities 3500/12000 54600/15760 0.29 0.29
Total asset to debt
ratio
Total assets/total
debts 15500/3500 16760/4600 4.43 3.64
Asset utilisation
ratios:
Fixed asset turnover
ratio
Total revenues/Fixed
assets 18000/11350 23000/15200 1.59 1.51
Total asset turnover
ratio
Total revenues/total
assets 18000/15500 23000/16760 1.16 1.37
Investors potential
5
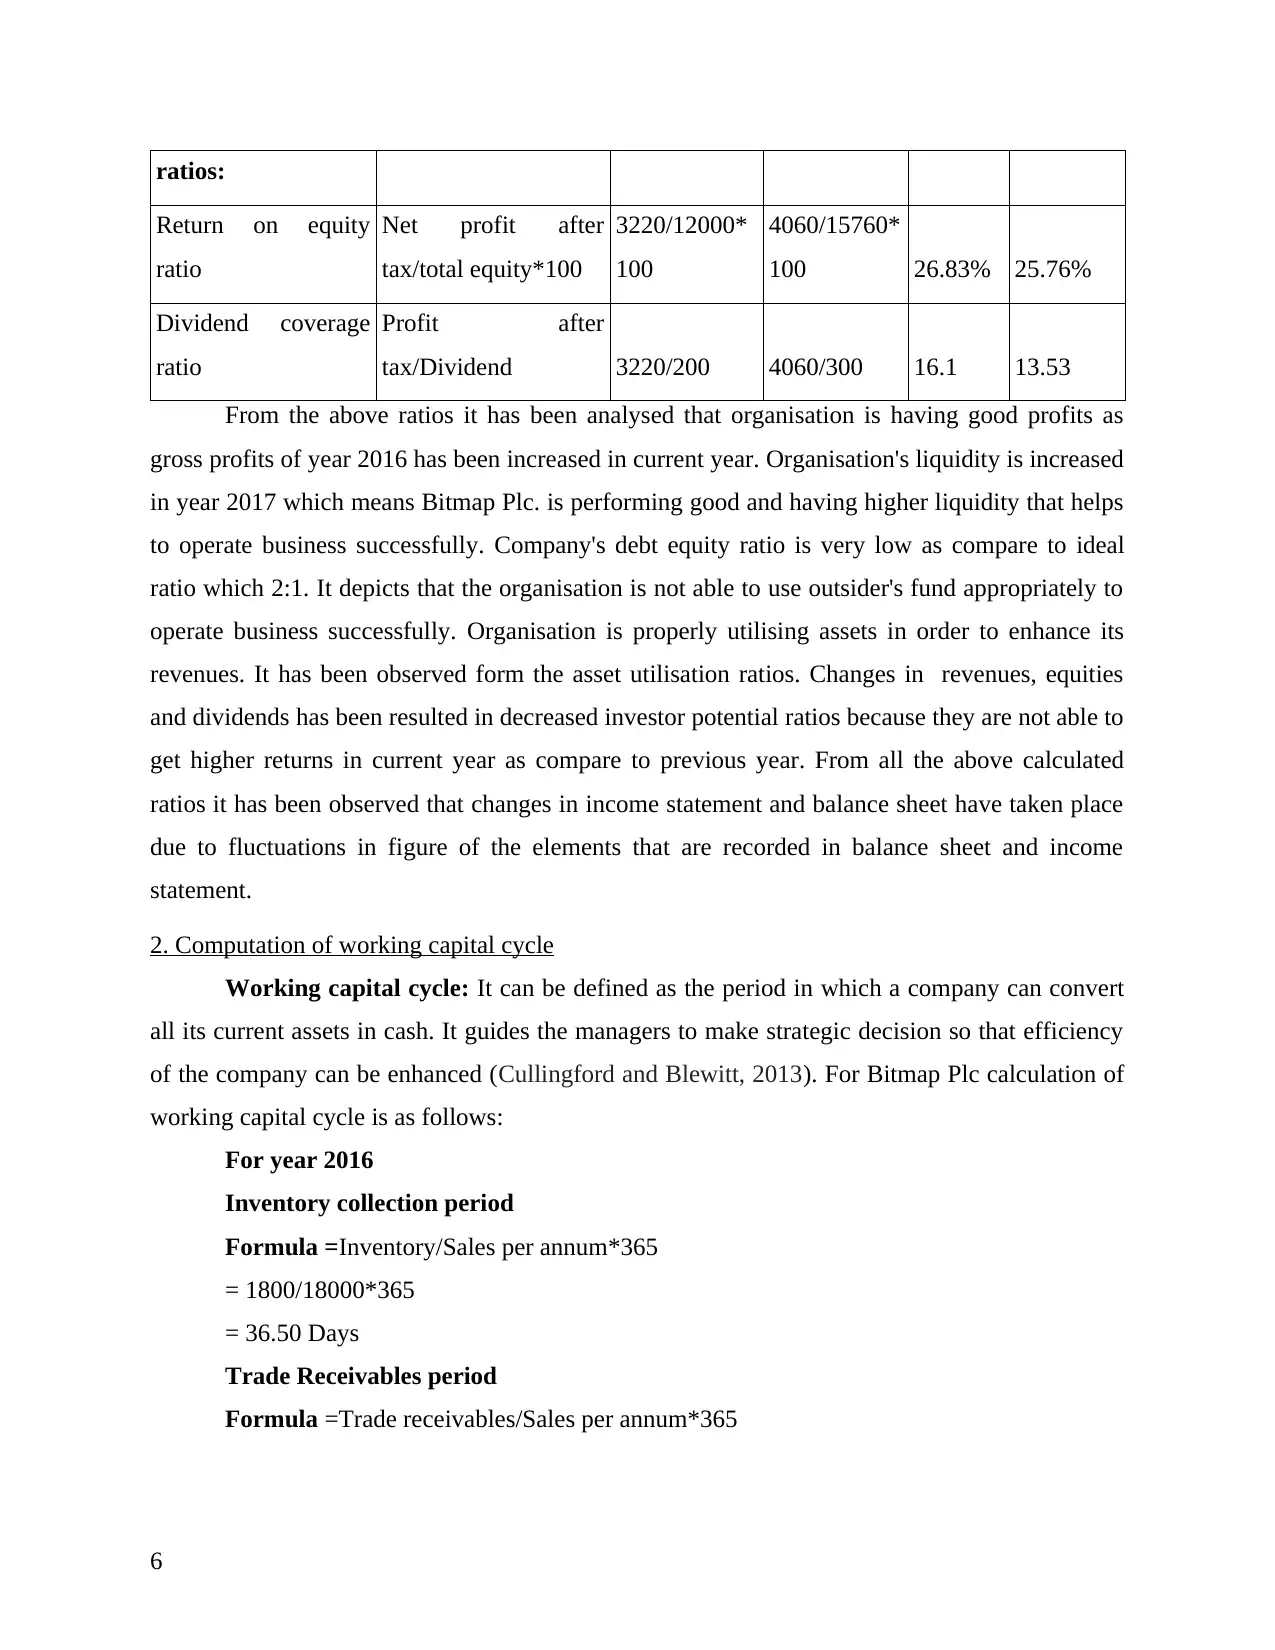
ratios:
Return on equity
ratio
Net profit after
tax/total equity*100
3220/12000*
100
4060/15760*
100 26.83% 25.76%
Dividend coverage
ratio
Profit after
tax/Dividend 3220/200 4060/300 16.1 13.53
From the above ratios it has been analysed that organisation is having good profits as
gross profits of year 2016 has been increased in current year. Organisation's liquidity is increased
in year 2017 which means Bitmap Plc. is performing good and having higher liquidity that helps
to operate business successfully. Company's debt equity ratio is very low as compare to ideal
ratio which 2:1. It depicts that the organisation is not able to use outsider's fund appropriately to
operate business successfully. Organisation is properly utilising assets in order to enhance its
revenues. It has been observed form the asset utilisation ratios. Changes in revenues, equities
and dividends has been resulted in decreased investor potential ratios because they are not able to
get higher returns in current year as compare to previous year. From all the above calculated
ratios it has been observed that changes in income statement and balance sheet have taken place
due to fluctuations in figure of the elements that are recorded in balance sheet and income
statement.
2. Computation of working capital cycle
Working capital cycle: It can be defined as the period in which a company can convert
all its current assets in cash. It guides the managers to make strategic decision so that efficiency
of the company can be enhanced (Cullingford and Blewitt, 2013). For Bitmap Plc calculation of
working capital cycle is as follows:
For year 2016
Inventory collection period
Formula =Inventory/Sales per annum*365
= 1800/18000*365
= 36.50 Days
Trade Receivables period
Formula =Trade receivables/Sales per annum*365
6
⊘ This is a preview!⊘
Do you want full access?
Subscribe today to unlock all pages.
Trusted by 1+ million students worldwide
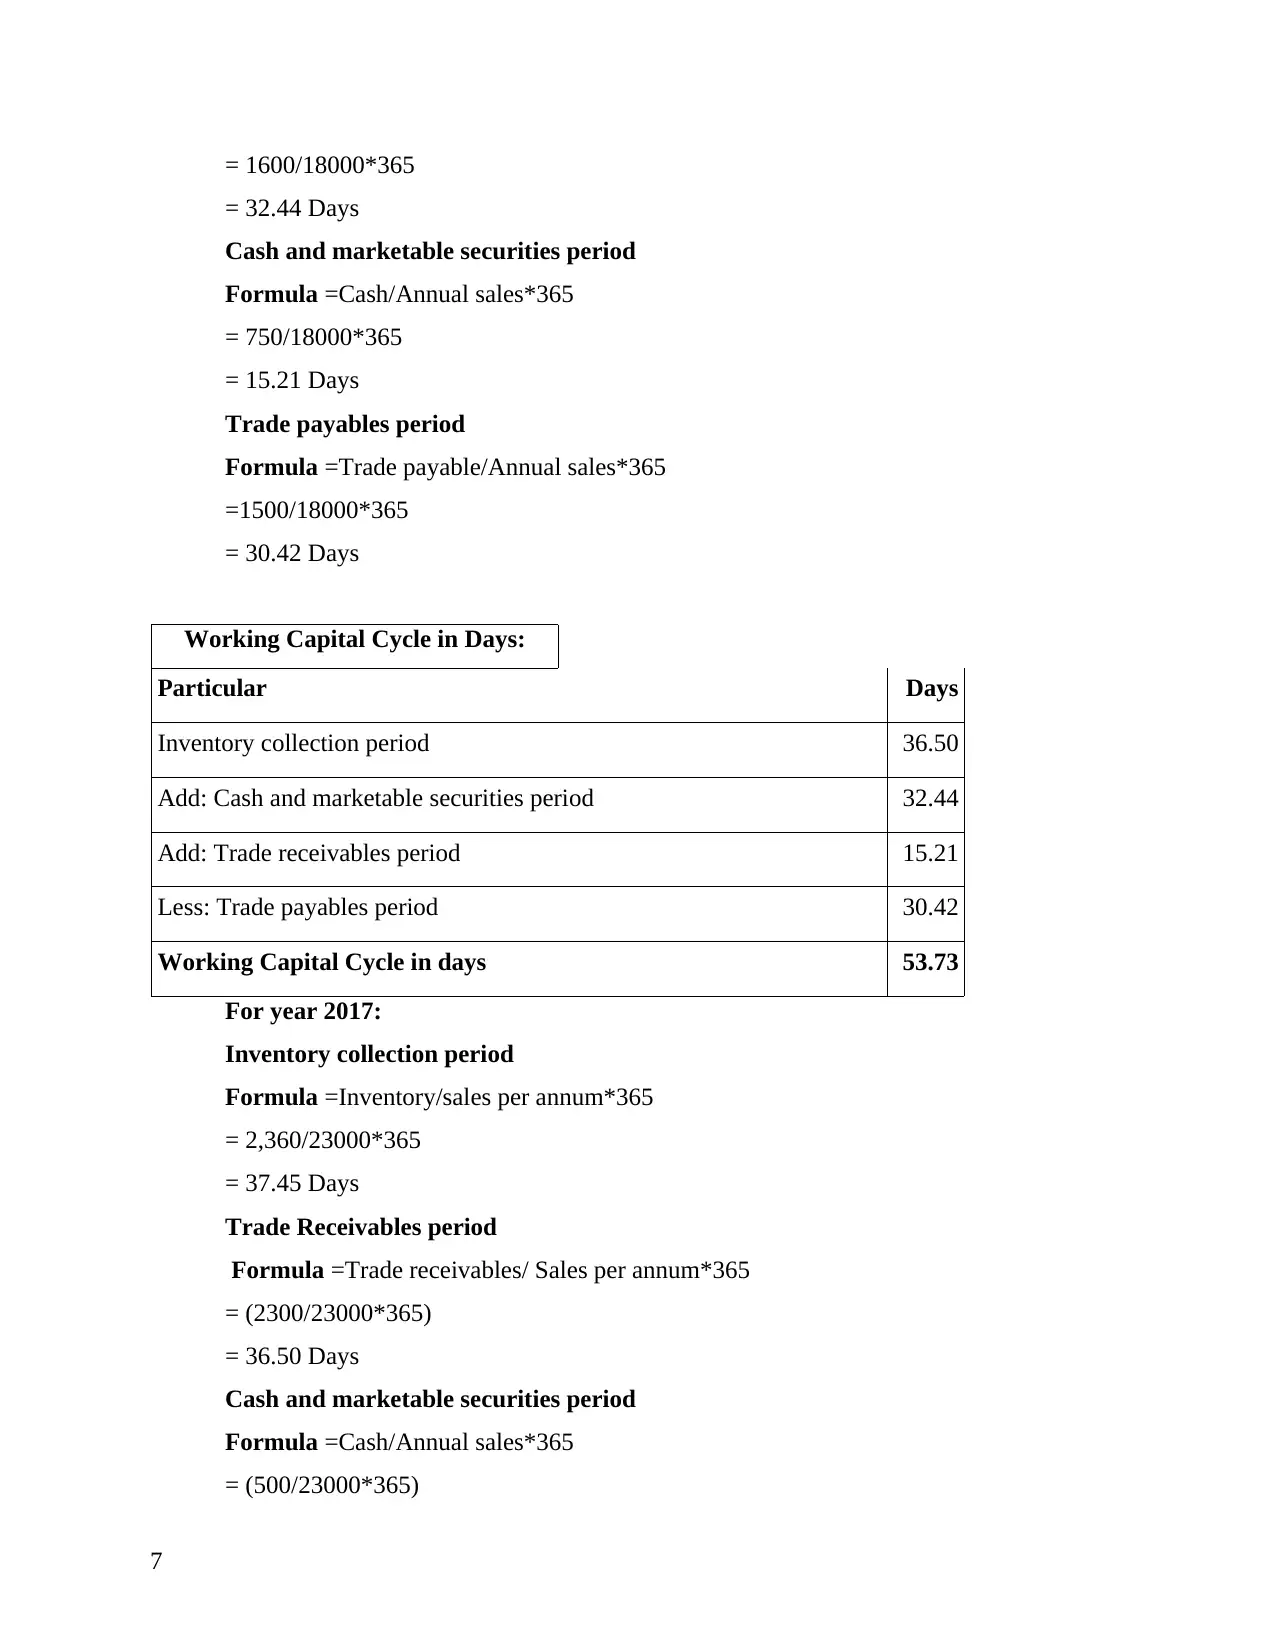
= 1600/18000*365
= 32.44 Days
Cash and marketable securities period
Formula =Cash/Annual sales*365
= 750/18000*365
= 15.21 Days
Trade payables period
Formula =Trade payable/Annual sales*365
=1500/18000*365
= 30.42 Days
Working Capital Cycle in Days:
Particular Days
Inventory collection period 36.50
Add: Cash and marketable securities period 32.44
Add: Trade receivables period 15.21
Less: Trade payables period 30.42
Working Capital Cycle in days 53.73
For year 2017:
Inventory collection period
Formula =Inventory/sales per annum*365
= 2,360/23000*365
= 37.45 Days
Trade Receivables period
Formula =Trade receivables/ Sales per annum*365
= (2300/23000*365)
= 36.50 Days
Cash and marketable securities period
Formula =Cash/Annual sales*365
= (500/23000*365)
7
Paraphrase This Document
Need a fresh take? Get an instant paraphrase of this document with our AI Paraphraser
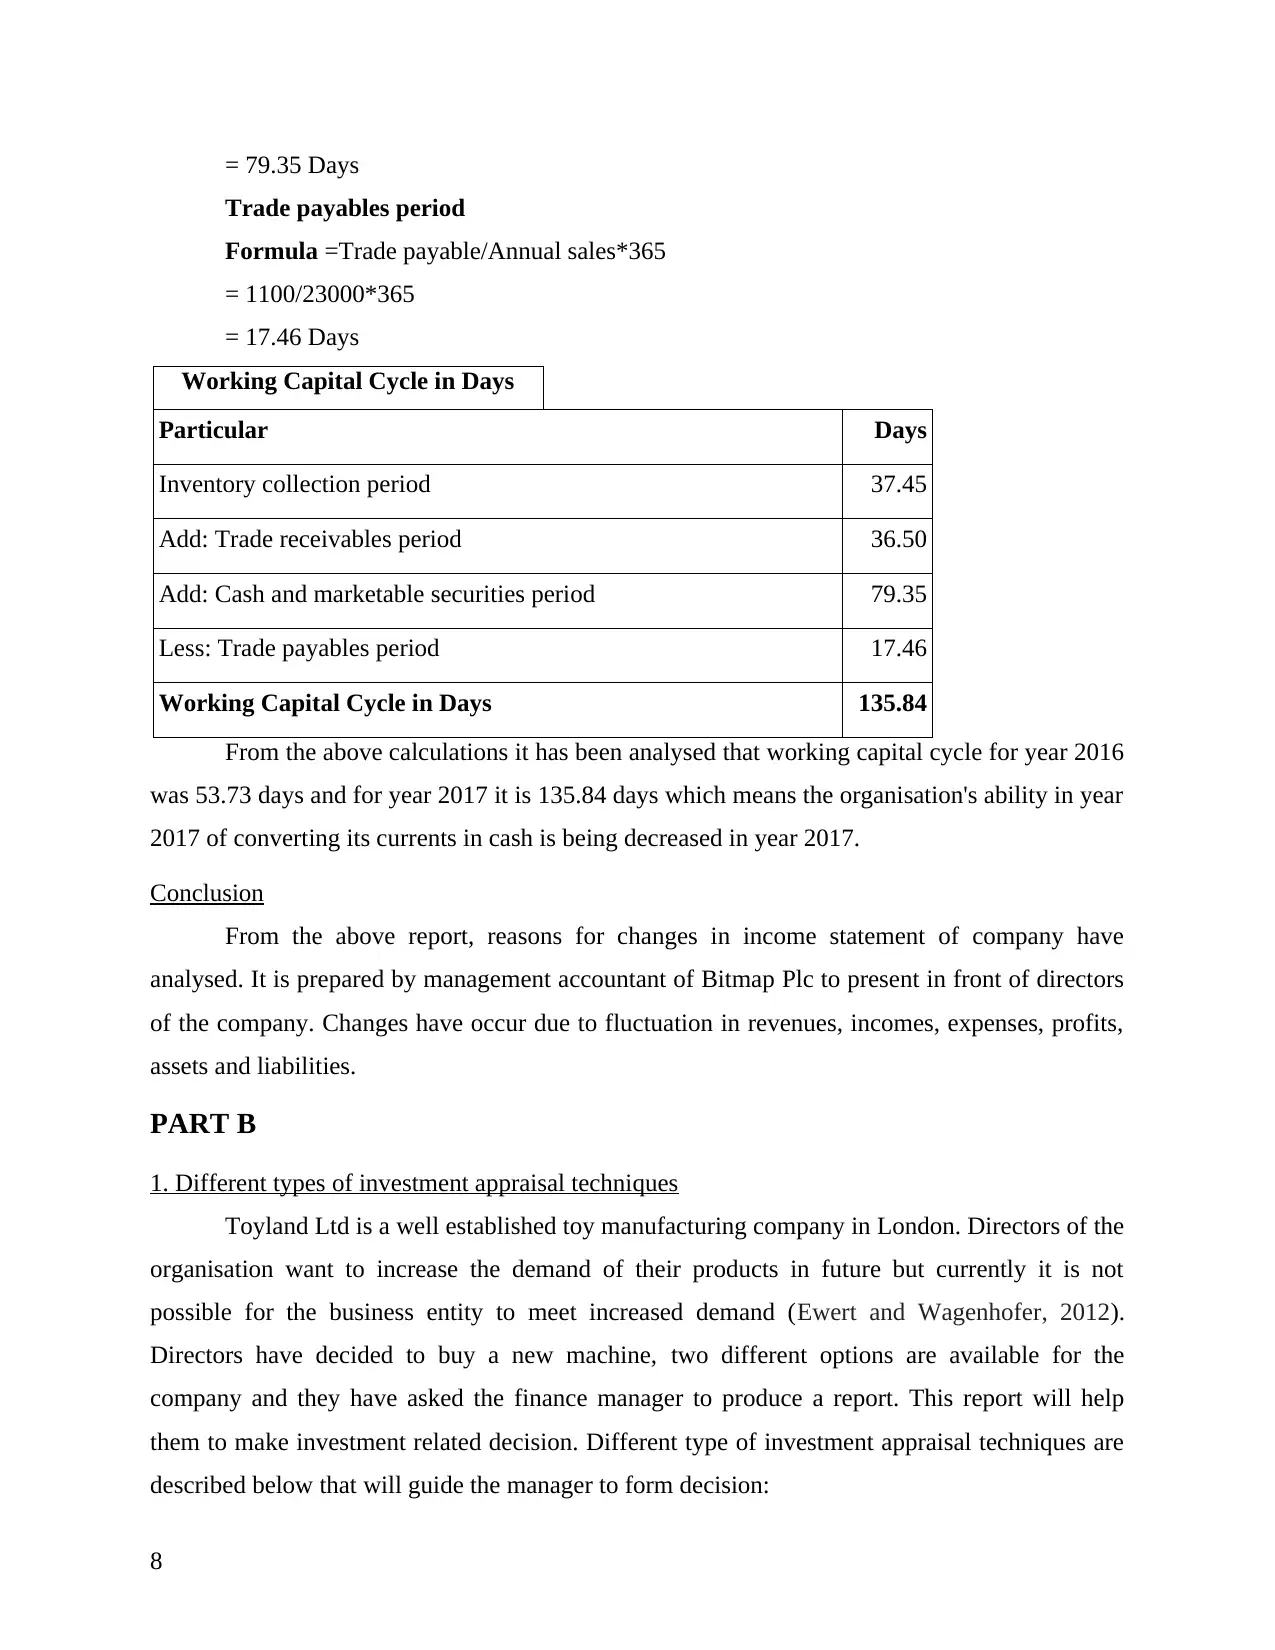
= 79.35 Days
Trade payables period
Formula =Trade payable/Annual sales*365
= 1100/23000*365
= 17.46 Days
Working Capital Cycle in Days
Particular Days
Inventory collection period 37.45
Add: Trade receivables period 36.50
Add: Cash and marketable securities period 79.35
Less: Trade payables period 17.46
Working Capital Cycle in Days 135.84
From the above calculations it has been analysed that working capital cycle for year 2016
was 53.73 days and for year 2017 it is 135.84 days which means the organisation's ability in year
2017 of converting its currents in cash is being decreased in year 2017.
Conclusion
From the above report, reasons for changes in income statement of company have
analysed. It is prepared by management accountant of Bitmap Plc to present in front of directors
of the company. Changes have occur due to fluctuation in revenues, incomes, expenses, profits,
assets and liabilities.
PART B
1. Different types of investment appraisal techniques
Toyland Ltd is a well established toy manufacturing company in London. Directors of the
organisation want to increase the demand of their products in future but currently it is not
possible for the business entity to meet increased demand (Ewert and Wagenhofer, 2012).
Directors have decided to buy a new machine, two different options are available for the
company and they have asked the finance manager to produce a report. This report will help
them to make investment related decision. Different type of investment appraisal techniques are
described below that will guide the manager to form decision:
8
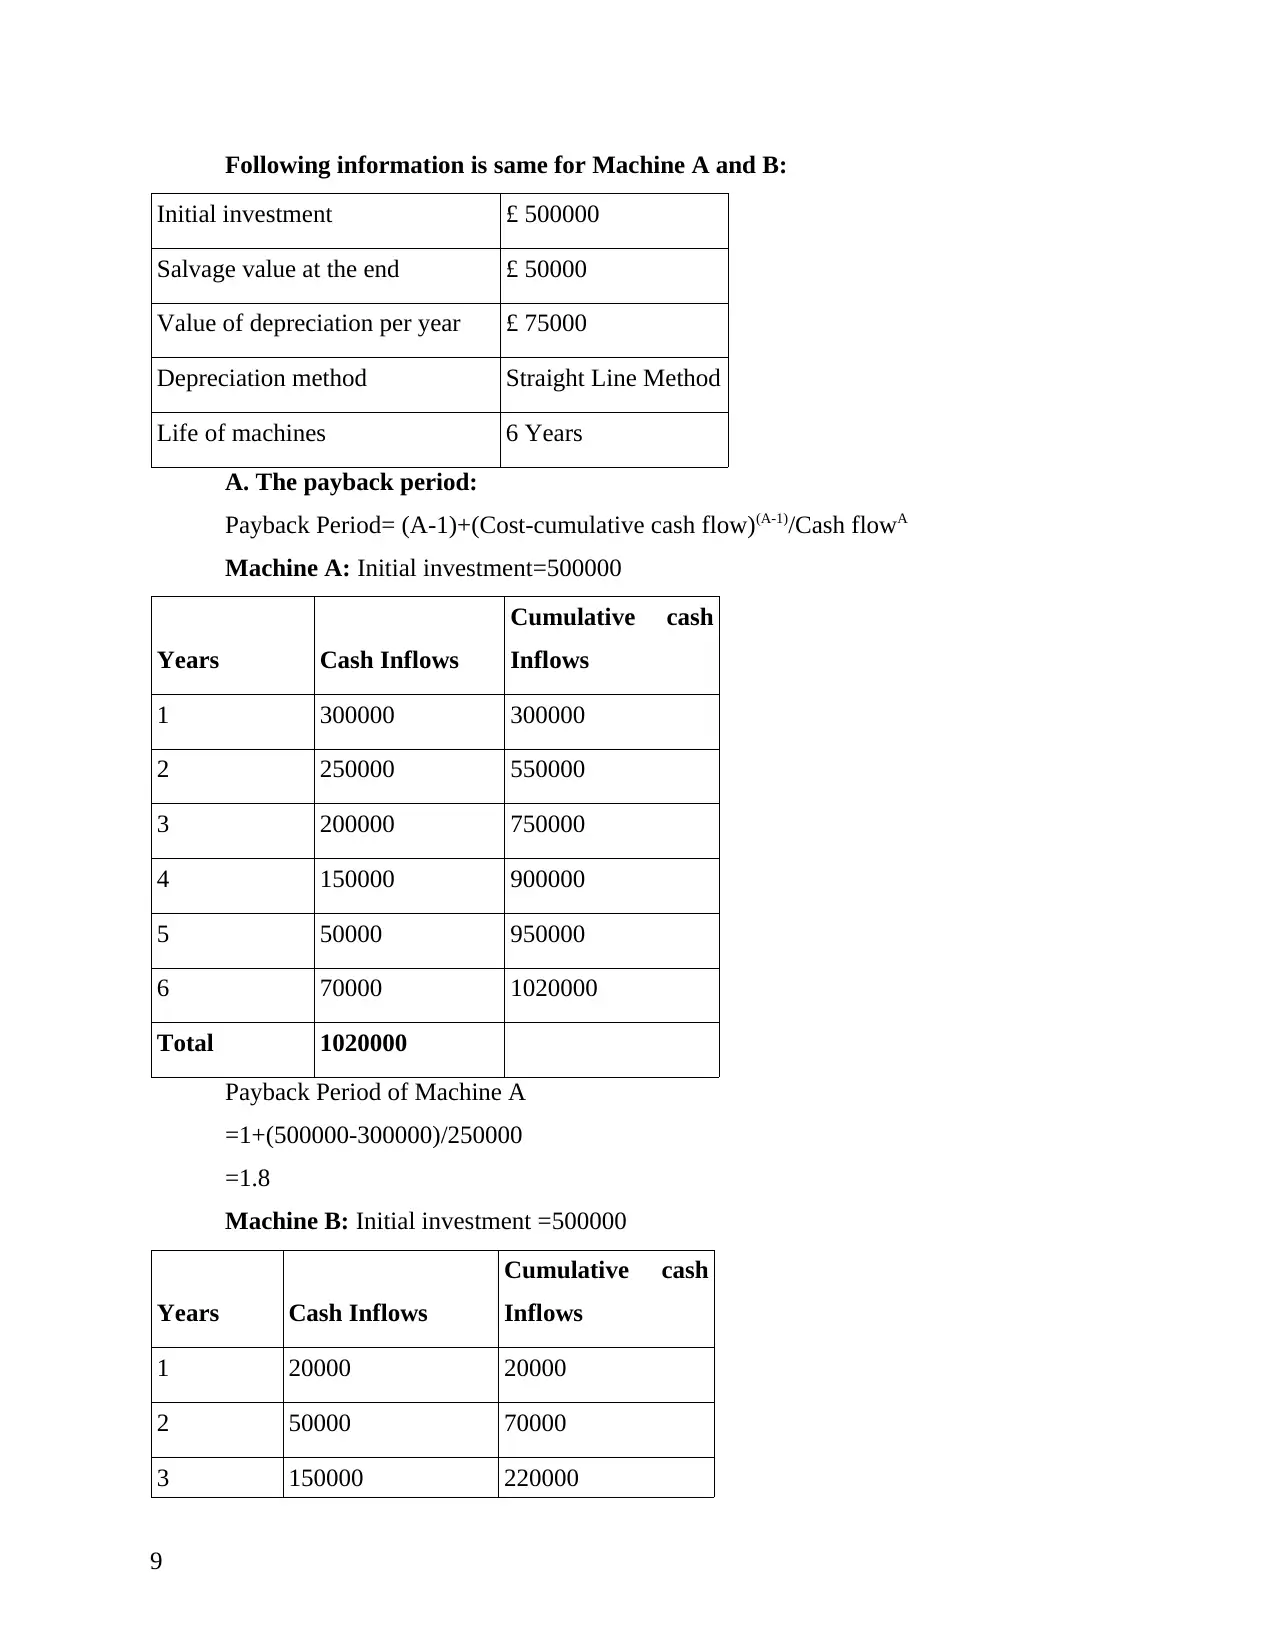
Following information is same for Machine A and B:
Initial investment £ 500000
Salvage value at the end £ 50000
Value of depreciation per year £ 75000
Depreciation method Straight Line Method
Life of machines 6 Years
A. The payback period:
Payback Period= (A-1)+(Cost-cumulative cash flow)(A-1)/Cash flowA
Machine A: Initial investment=500000
Years Cash Inflows
Cumulative cash
Inflows
1 300000 300000
2 250000 550000
3 200000 750000
4 150000 900000
5 50000 950000
6 70000 1020000
Total 1020000
Payback Period of Machine A
=1+(500000-300000)/250000
=1.8
Machine B: Initial investment =500000
Years Cash Inflows
Cumulative cash
Inflows
1 20000 20000
2 50000 70000
3 150000 220000
9
⊘ This is a preview!⊘
Do you want full access?
Subscribe today to unlock all pages.
Trusted by 1+ million students worldwide
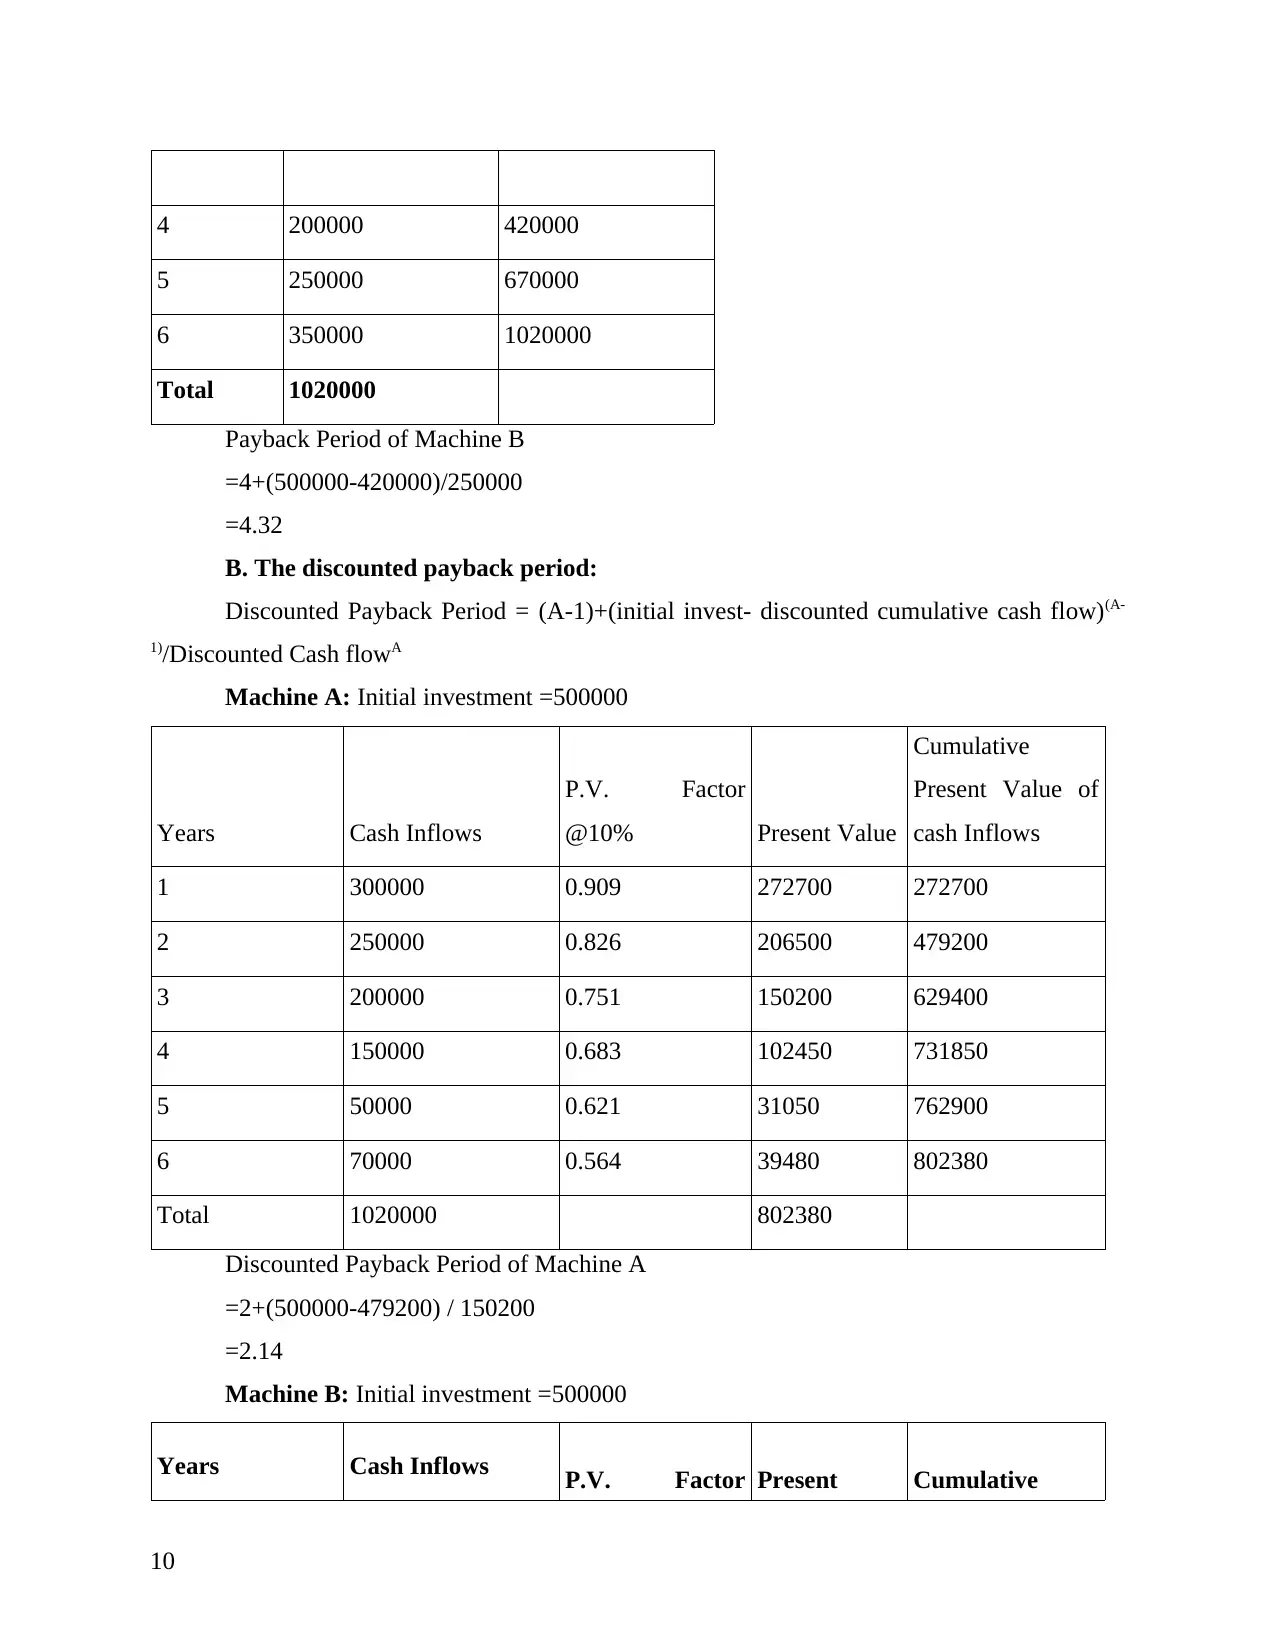
4 200000 420000
5 250000 670000
6 350000 1020000
Total 1020000
Payback Period of Machine B
=4+(500000-420000)/250000
=4.32
B. The discounted payback period:
Discounted Payback Period = (A-1)+(initial invest- discounted cumulative cash flow)(A-
1)/Discounted Cash flowA
Machine A: Initial investment =500000
Years Cash Inflows
P.V. Factor
@10% Present Value
Cumulative
Present Value of
cash Inflows
1 300000 0.909 272700 272700
2 250000 0.826 206500 479200
3 200000 0.751 150200 629400
4 150000 0.683 102450 731850
5 50000 0.621 31050 762900
6 70000 0.564 39480 802380
Total 1020000 802380
Discounted Payback Period of Machine A
=2+(500000-479200) / 150200
=2.14
Machine B: Initial investment =500000
Years Cash Inflows P.V. Factor Present Cumulative
10
Paraphrase This Document
Need a fresh take? Get an instant paraphrase of this document with our AI Paraphraser
@10% Value
Present Value of
cash Inflows
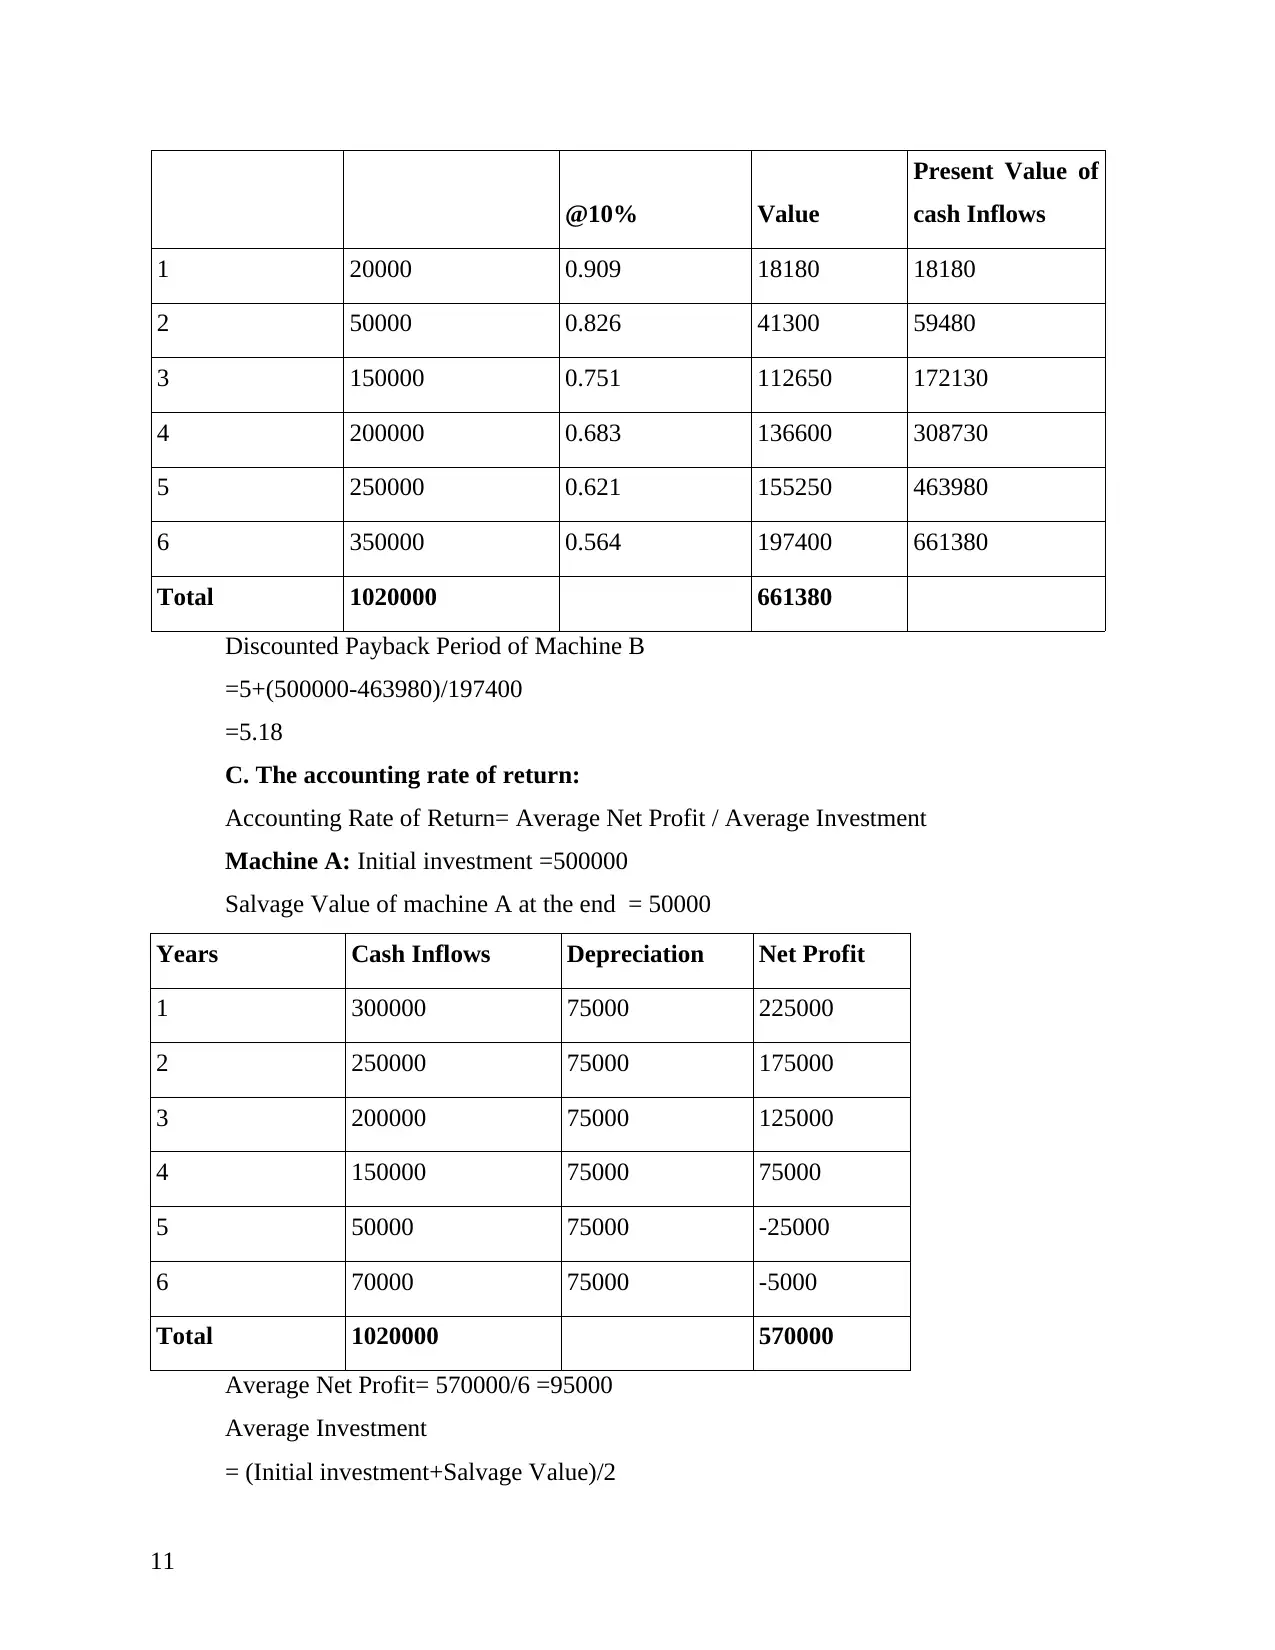
1 20000 0.909 18180 18180
2 50000 0.826 41300 59480
3 150000 0.751 112650 172130
4 200000 0.683 136600 308730
5 250000 0.621 155250 463980
6 350000 0.564 197400 661380
Total 1020000 661380
Discounted Payback Period of Machine B
=5+(500000-463980)/197400
=5.18
C. The accounting rate of return:
Accounting Rate of Return= Average Net Profit / Average Investment
Machine A: Initial investment =500000
Salvage Value of machine A at the end = 50000
Years Cash Inflows Depreciation Net Profit
1 300000 75000 225000
2 250000 75000 175000
3 200000 75000 125000
4 150000 75000 75000
5 50000 75000 -25000
6 70000 75000 -5000
Total 1020000 570000
Average Net Profit= 570000/6 =95000
Average Investment
= (Initial investment+Salvage Value)/2
11
Present Value of
cash Inflows
1 20000 0.909 18180 18180
2 50000 0.826 41300 59480
3 150000 0.751 112650 172130
4 200000 0.683 136600 308730
5 250000 0.621 155250 463980
6 350000 0.564 197400 661380
Total 1020000 661380
Discounted Payback Period of Machine B
=5+(500000-463980)/197400
=5.18
C. The accounting rate of return:
Accounting Rate of Return= Average Net Profit / Average Investment
Machine A: Initial investment =500000
Salvage Value of machine A at the end = 50000
Years Cash Inflows Depreciation Net Profit
1 300000 75000 225000
2 250000 75000 175000
3 200000 75000 125000
4 150000 75000 75000
5 50000 75000 -25000
6 70000 75000 -5000
Total 1020000 570000
Average Net Profit= 570000/6 =95000
Average Investment
= (Initial investment+Salvage Value)/2
11
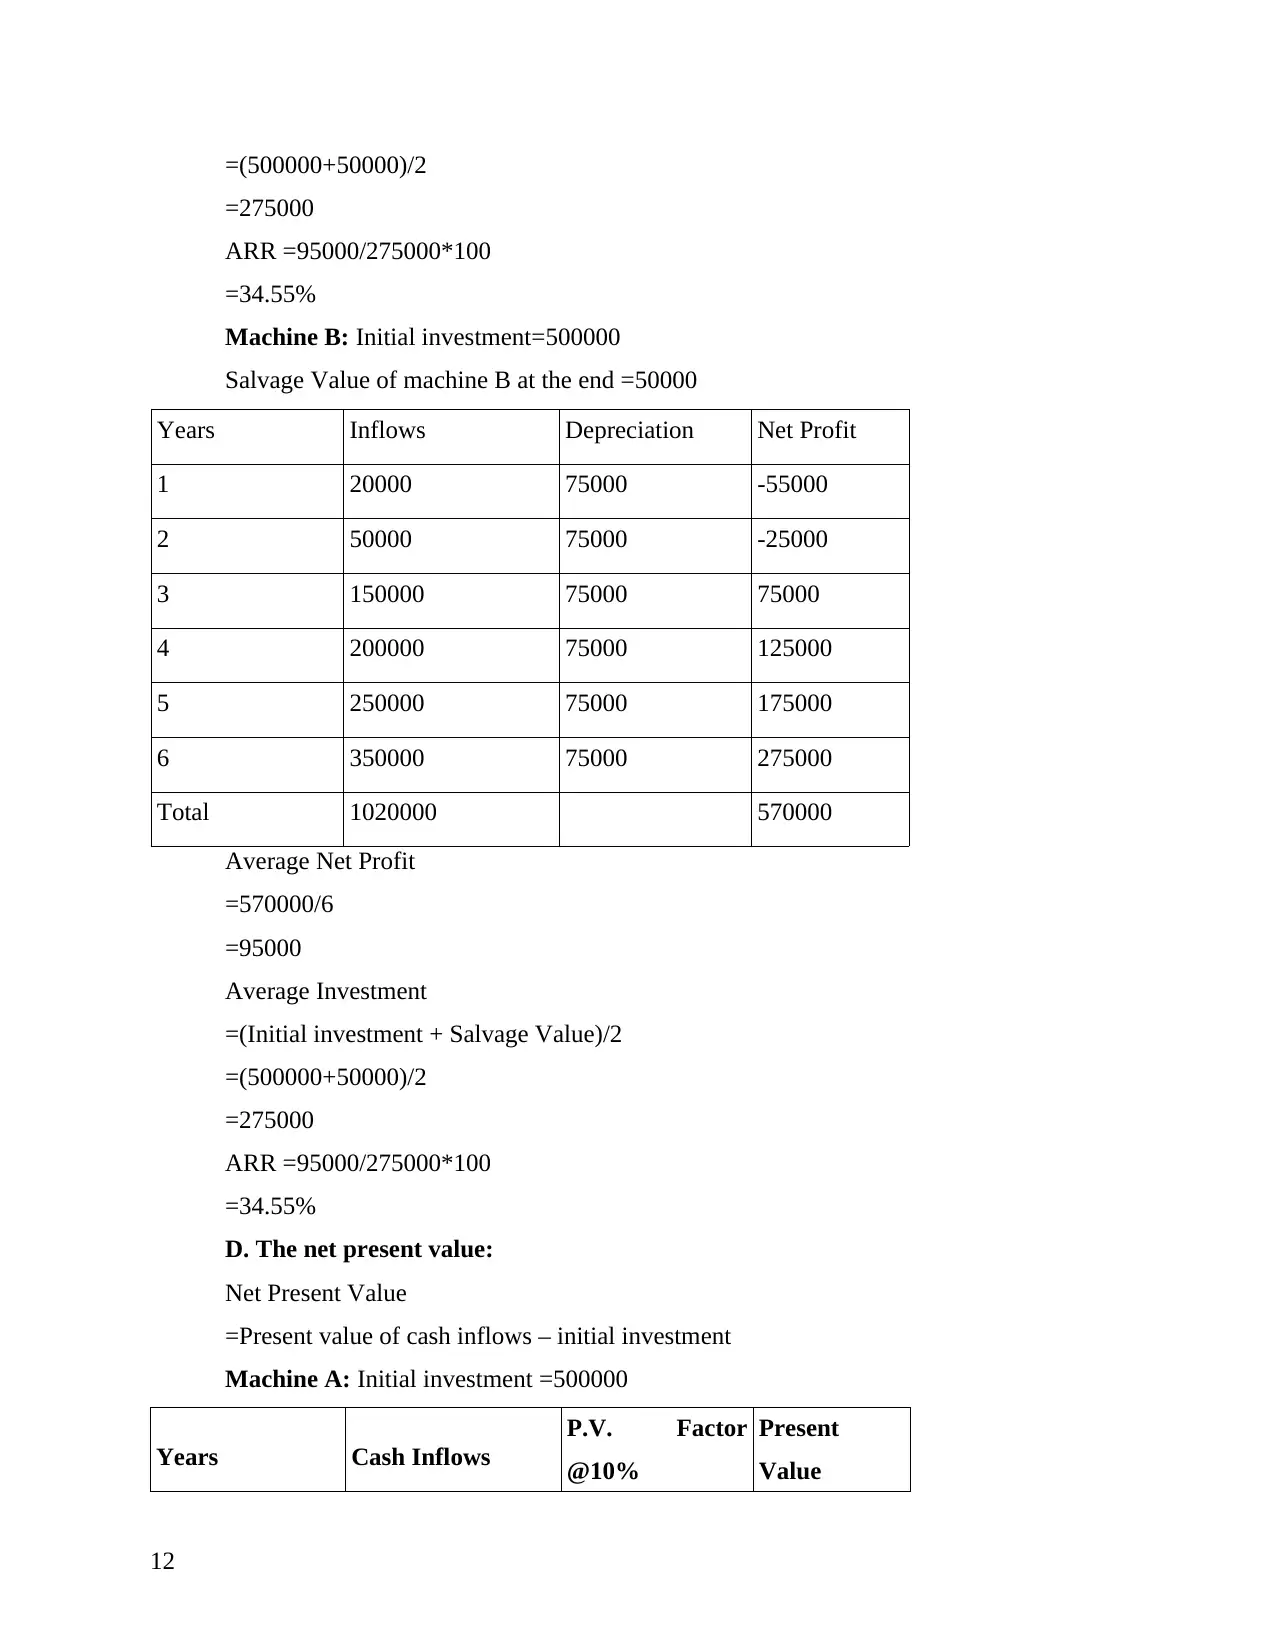
=(500000+50000)/2
=275000
ARR =95000/275000*100
=34.55%
Machine B: Initial investment=500000
Salvage Value of machine B at the end =50000
Years Inflows Depreciation Net Profit
1 20000 75000 -55000
2 50000 75000 -25000
3 150000 75000 75000
4 200000 75000 125000
5 250000 75000 175000
6 350000 75000 275000
Total 1020000 570000
Average Net Profit
=570000/6
=95000
Average Investment
=(Initial investment + Salvage Value)/2
=(500000+50000)/2
=275000
ARR =95000/275000*100
=34.55%
D. The net present value:
Net Present Value
=Present value of cash inflows – initial investment
Machine A: Initial investment =500000
Years Cash Inflows
P.V. Factor
@10%
Present
Value
12
=275000
ARR =95000/275000*100
=34.55%
Machine B: Initial investment=500000
Salvage Value of machine B at the end =50000
Years Inflows Depreciation Net Profit
1 20000 75000 -55000
2 50000 75000 -25000
3 150000 75000 75000
4 200000 75000 125000
5 250000 75000 175000
6 350000 75000 275000
Total 1020000 570000
Average Net Profit
=570000/6
=95000
Average Investment
=(Initial investment + Salvage Value)/2
=(500000+50000)/2
=275000
ARR =95000/275000*100
=34.55%
D. The net present value:
Net Present Value
=Present value of cash inflows – initial investment
Machine A: Initial investment =500000
Years Cash Inflows
P.V. Factor
@10%
Present
Value
12
⊘ This is a preview!⊘
Do you want full access?
Subscribe today to unlock all pages.
Trusted by 1+ million students worldwide
1 out of 19
Related Documents


Your All-in-One AI-Powered Toolkit for Academic Success.
+13062052269
info@desklib.com
Available 24*7 on WhatsApp / Email
![[object Object]](/_next/static/media/star-bottom.7253800d.svg)
Unlock your academic potential
Copyright © 2020–2026 A2Z Services. All Rights Reserved. Developed and managed by ZUCOL.