Financial Analysis Report: Blackmores Limited - 2015-2016

Verified

Added on  2020/03/04

|8
|1890
|34
Report
AI Summary
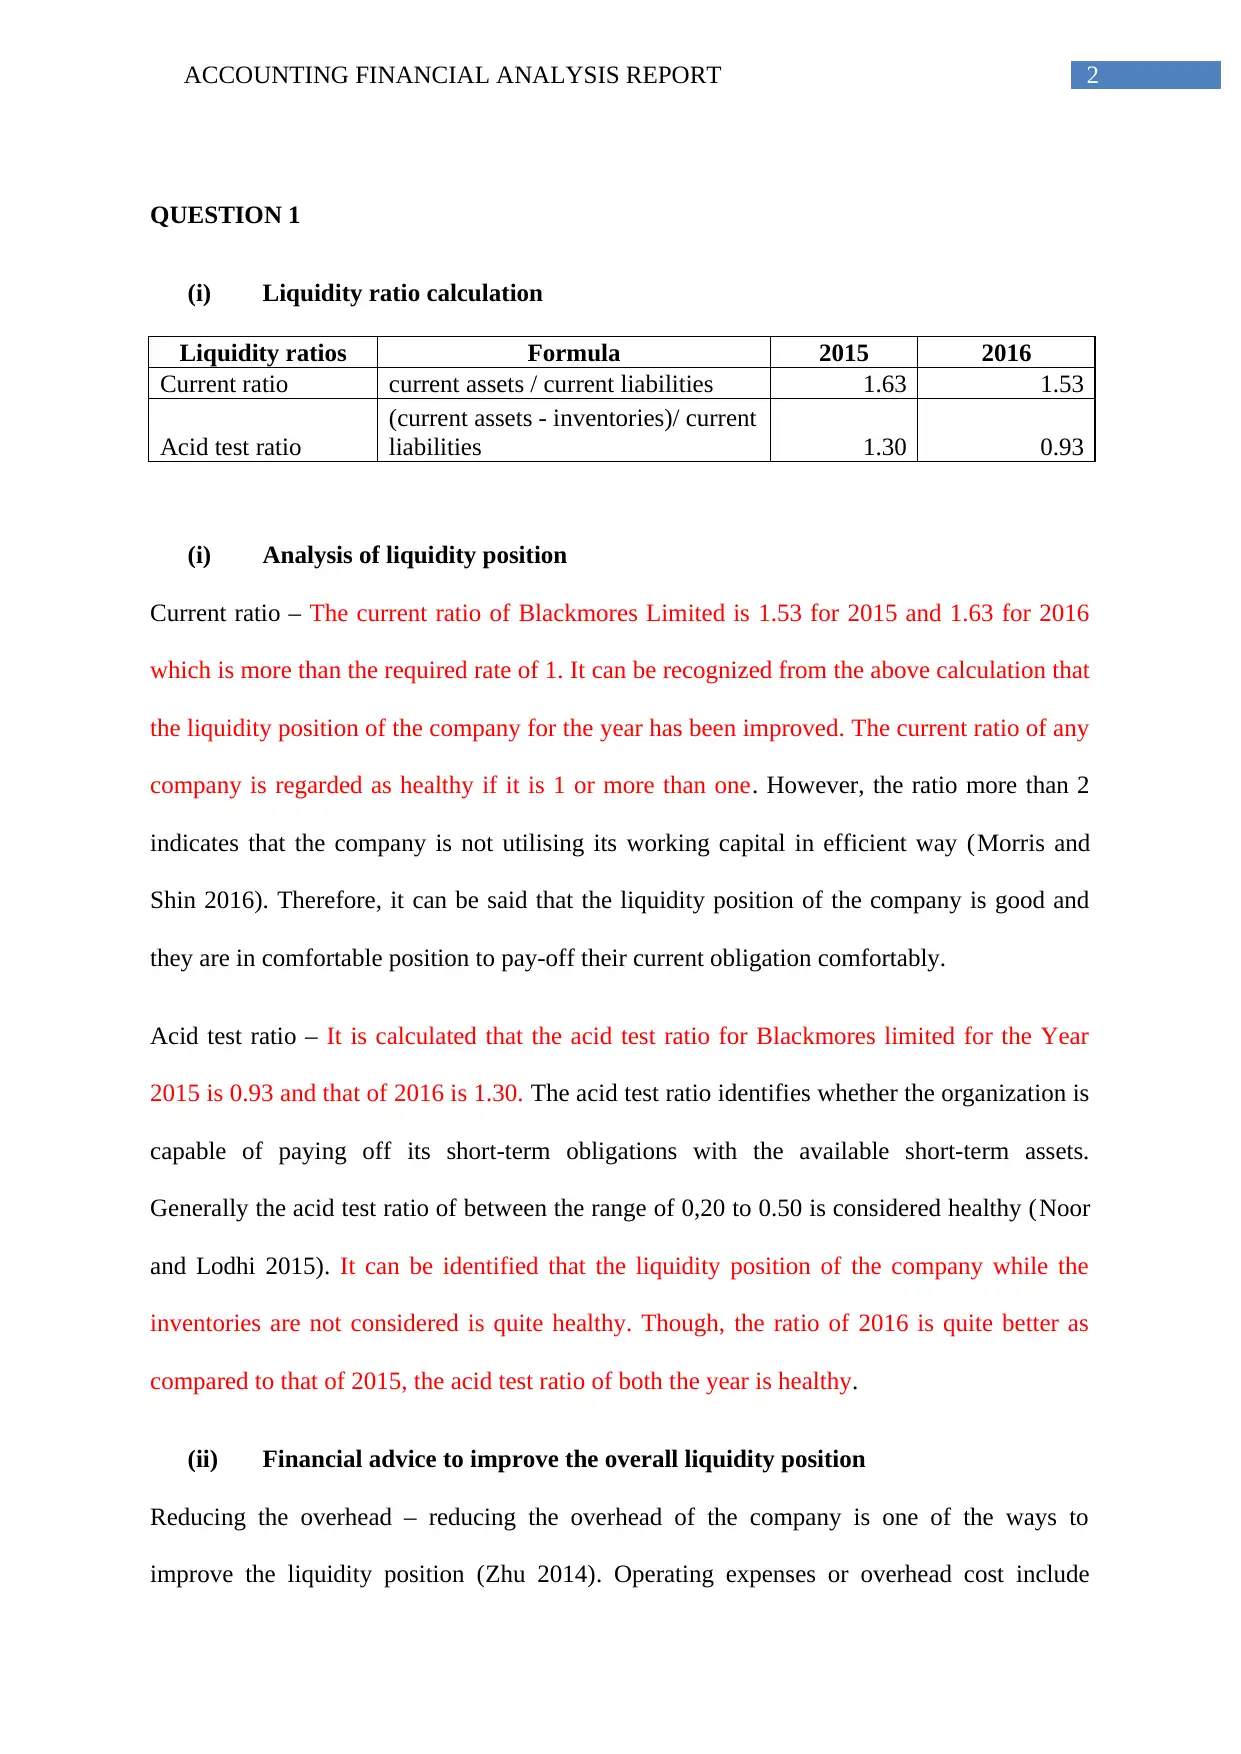
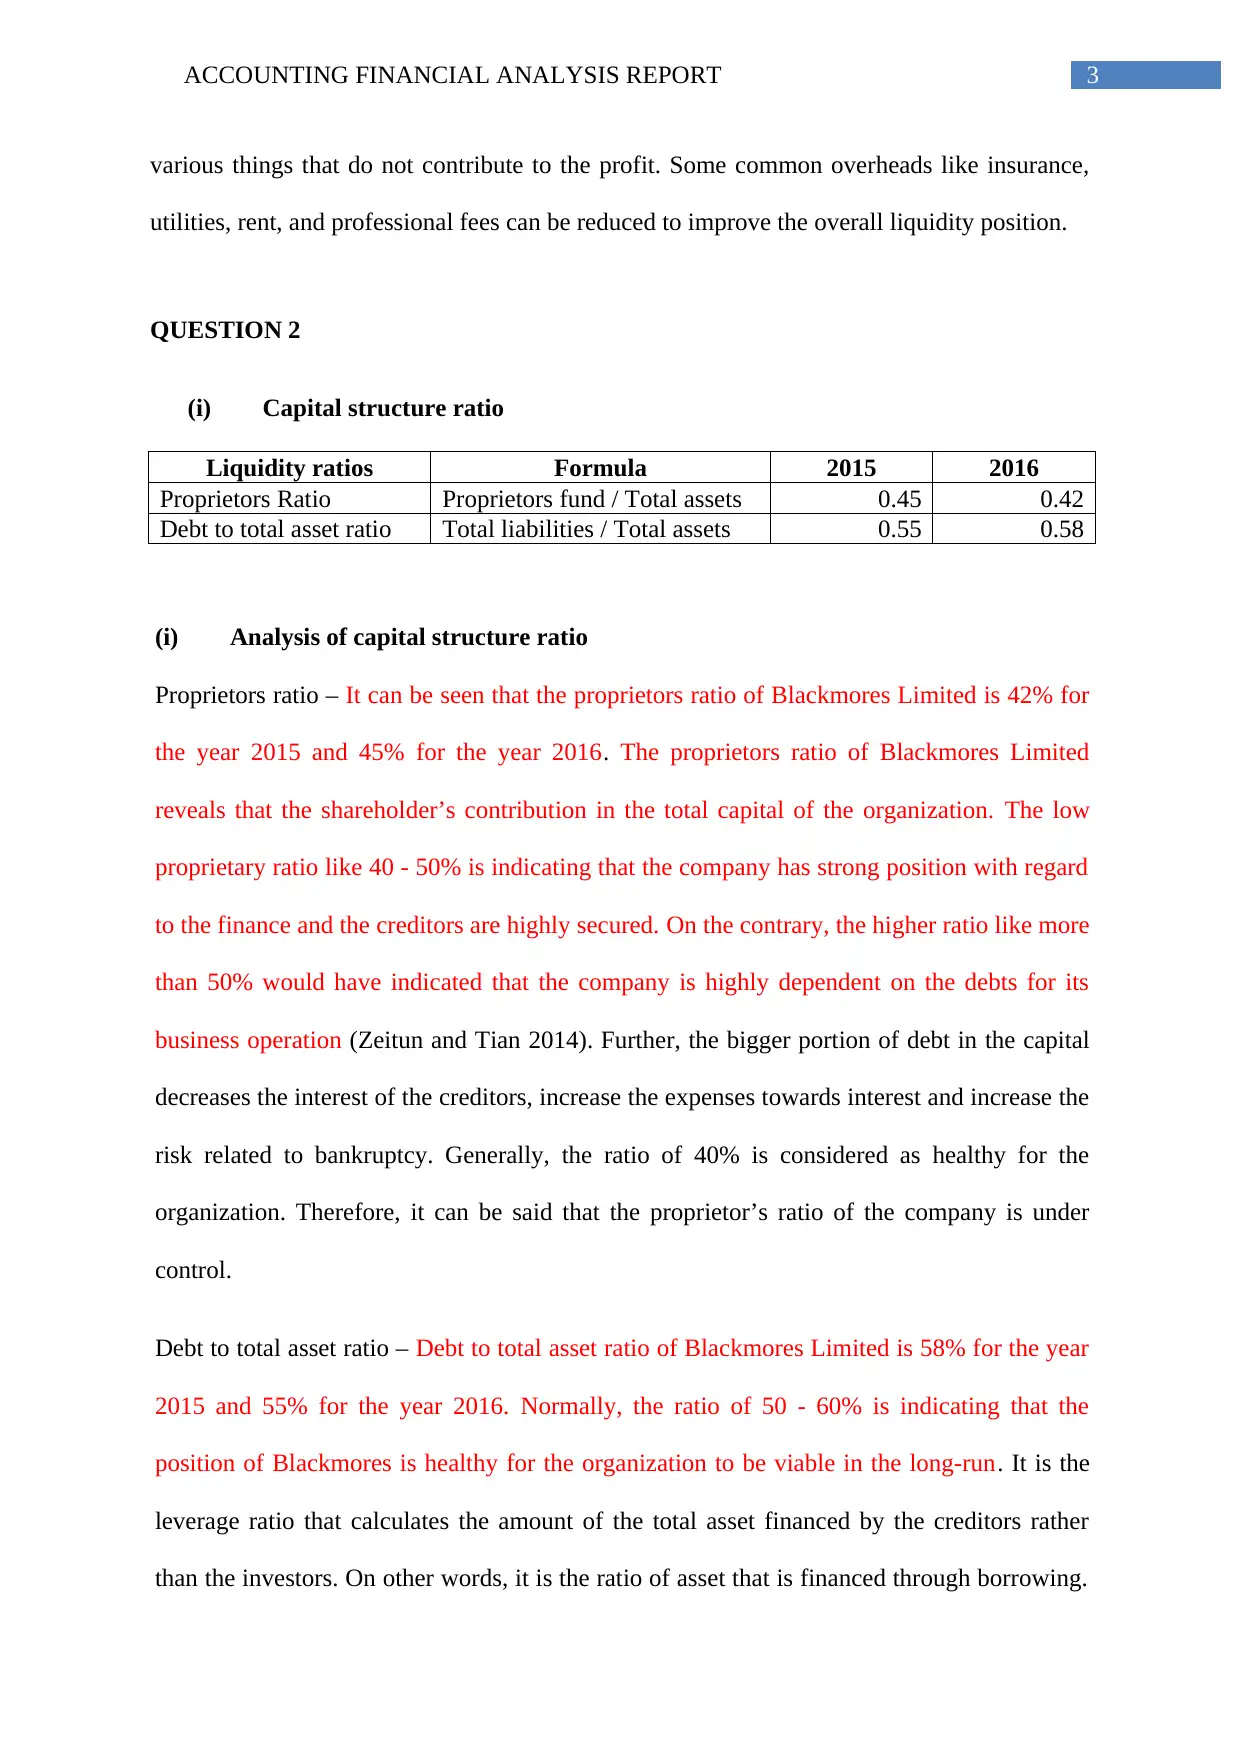
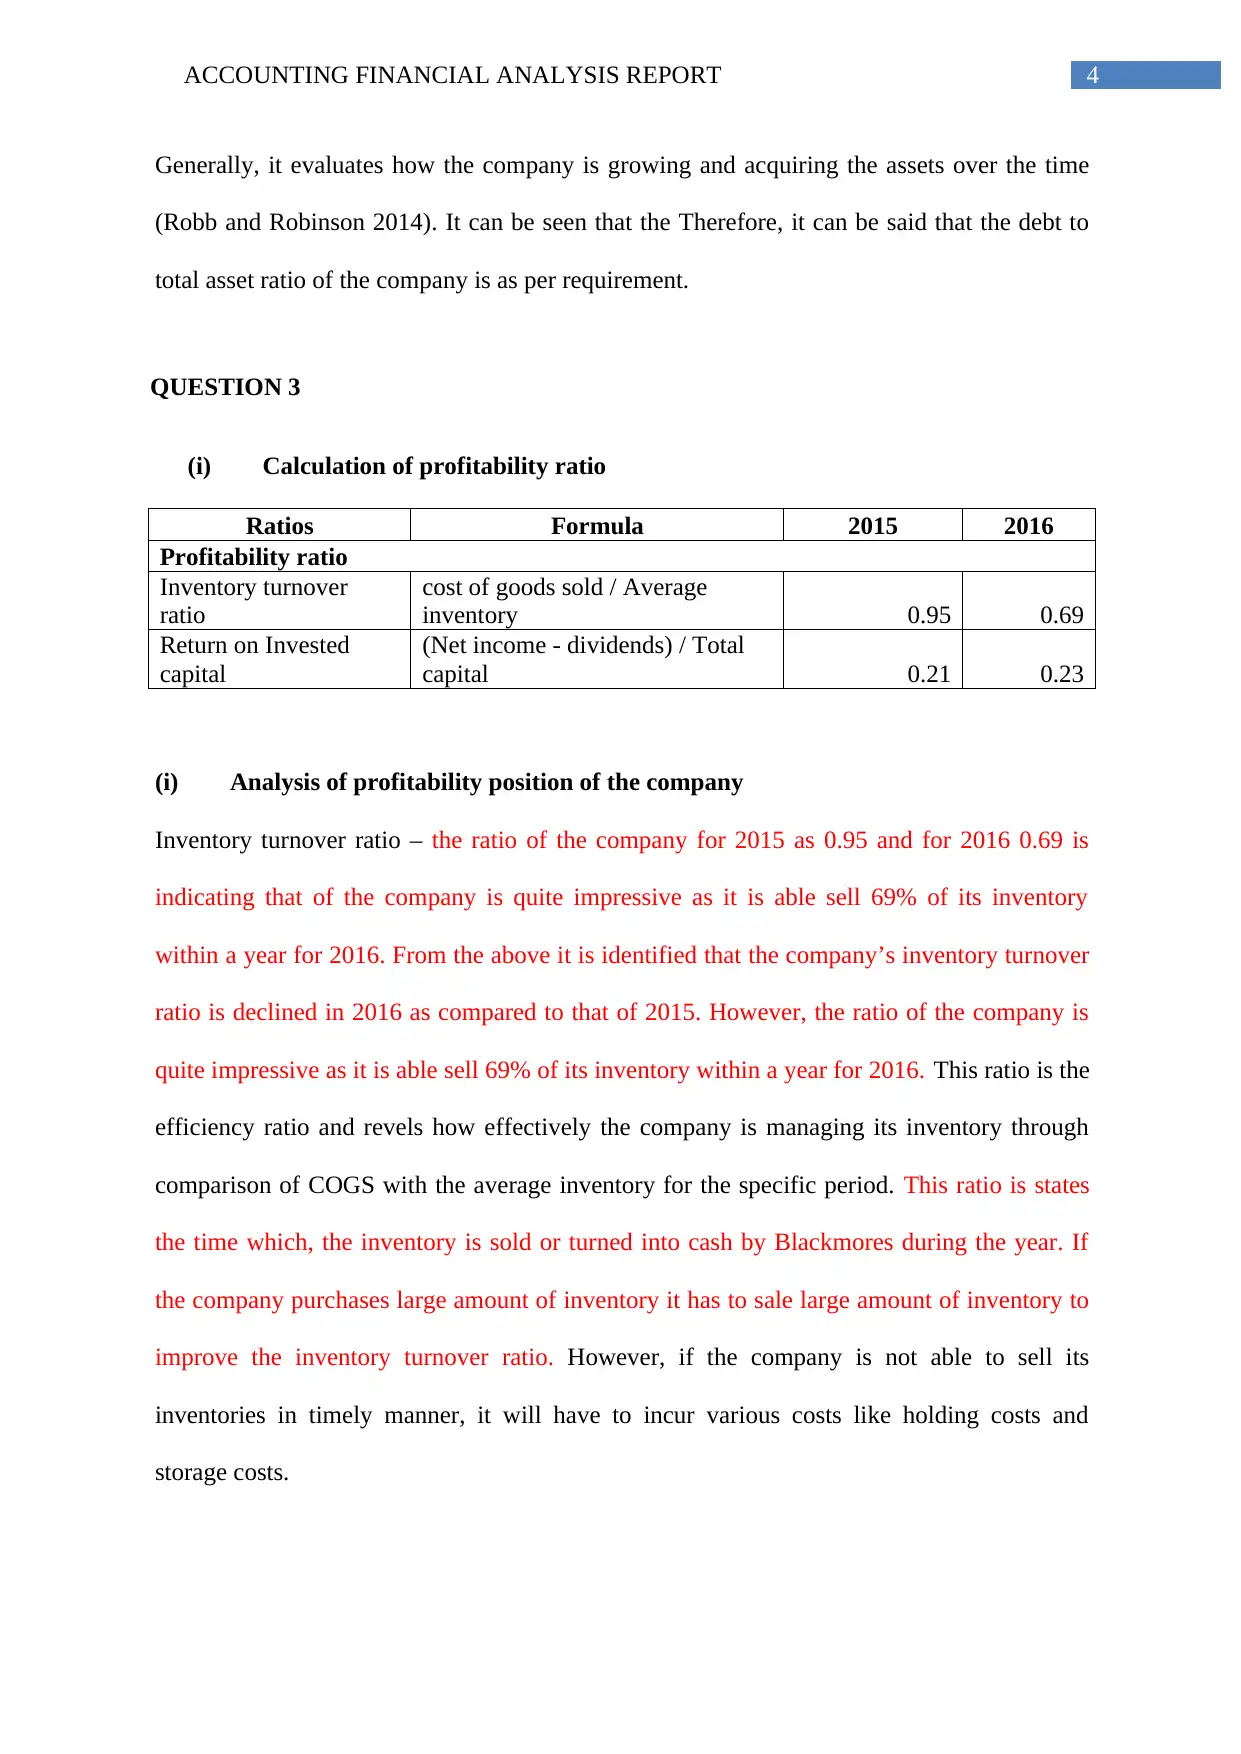
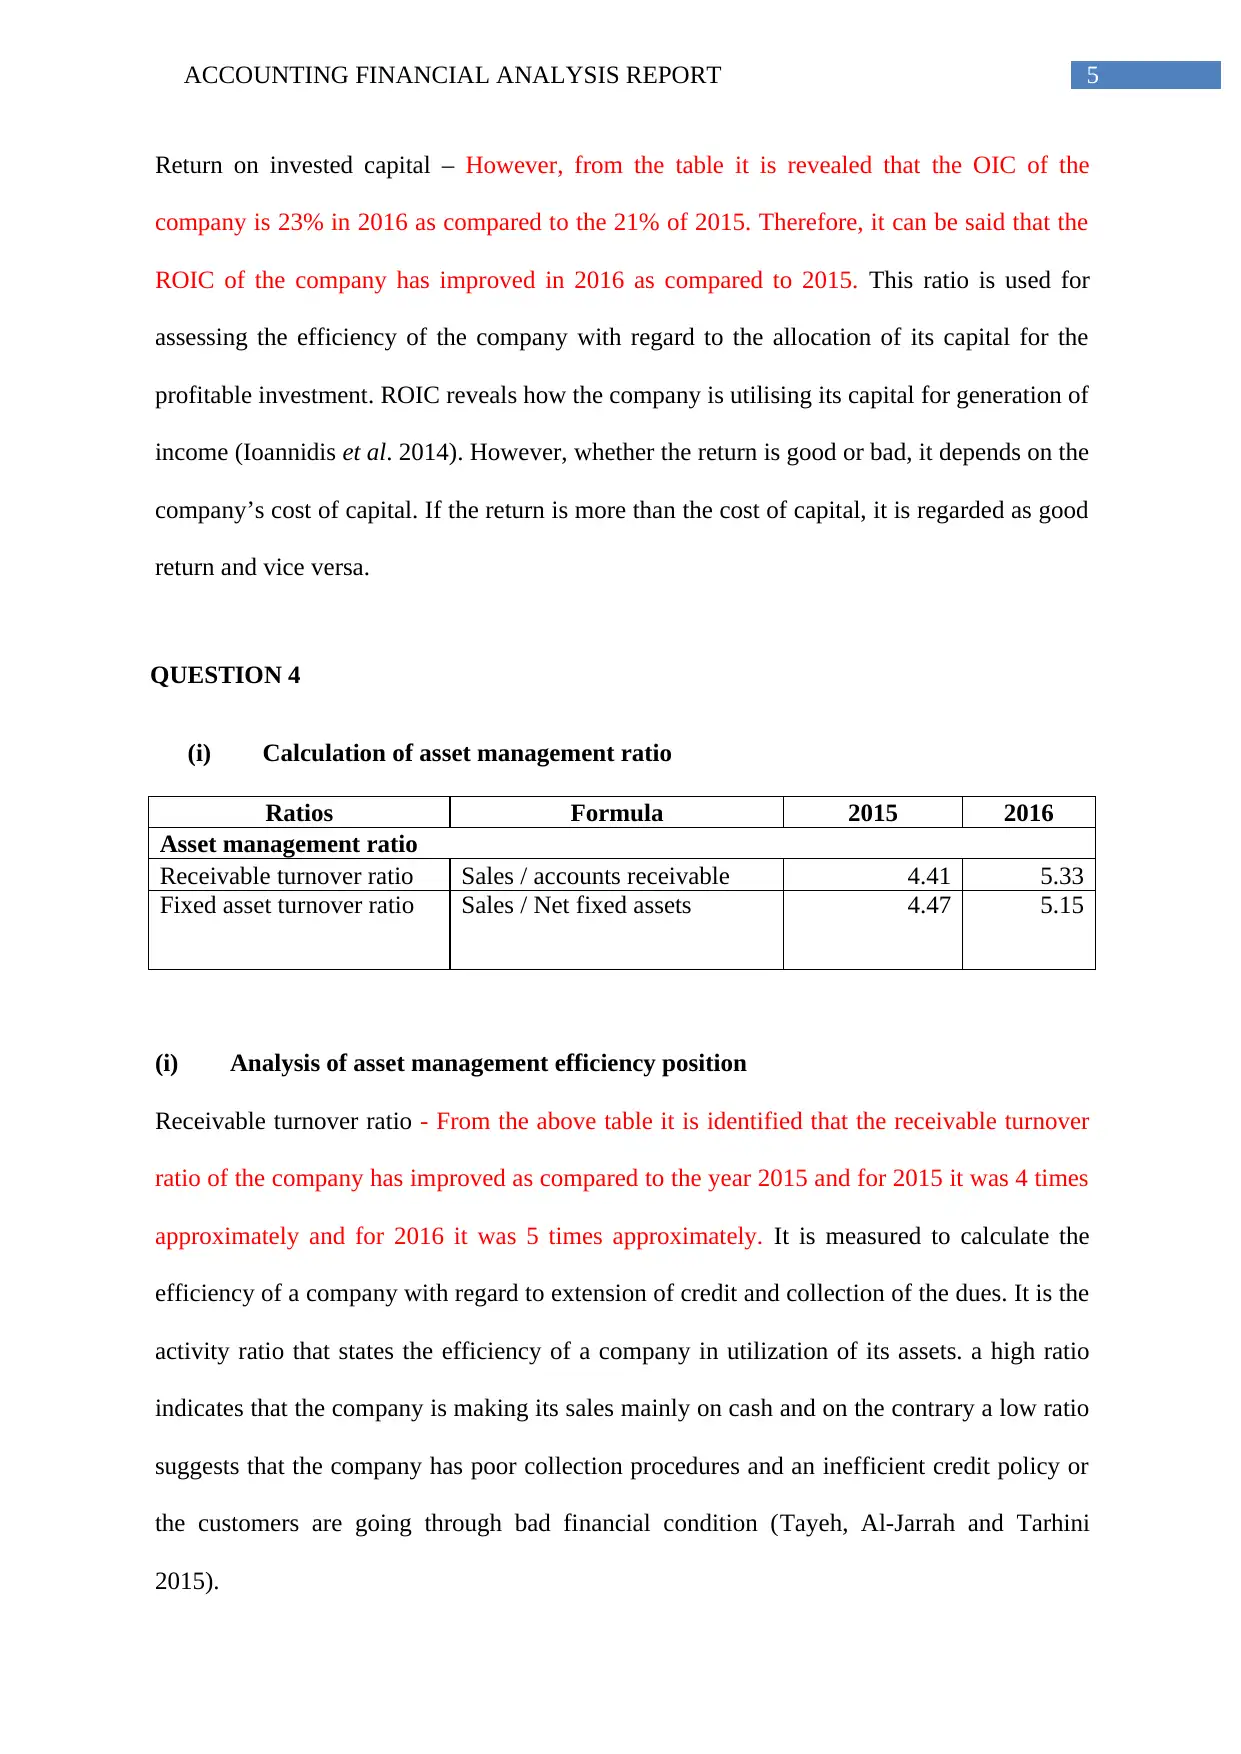
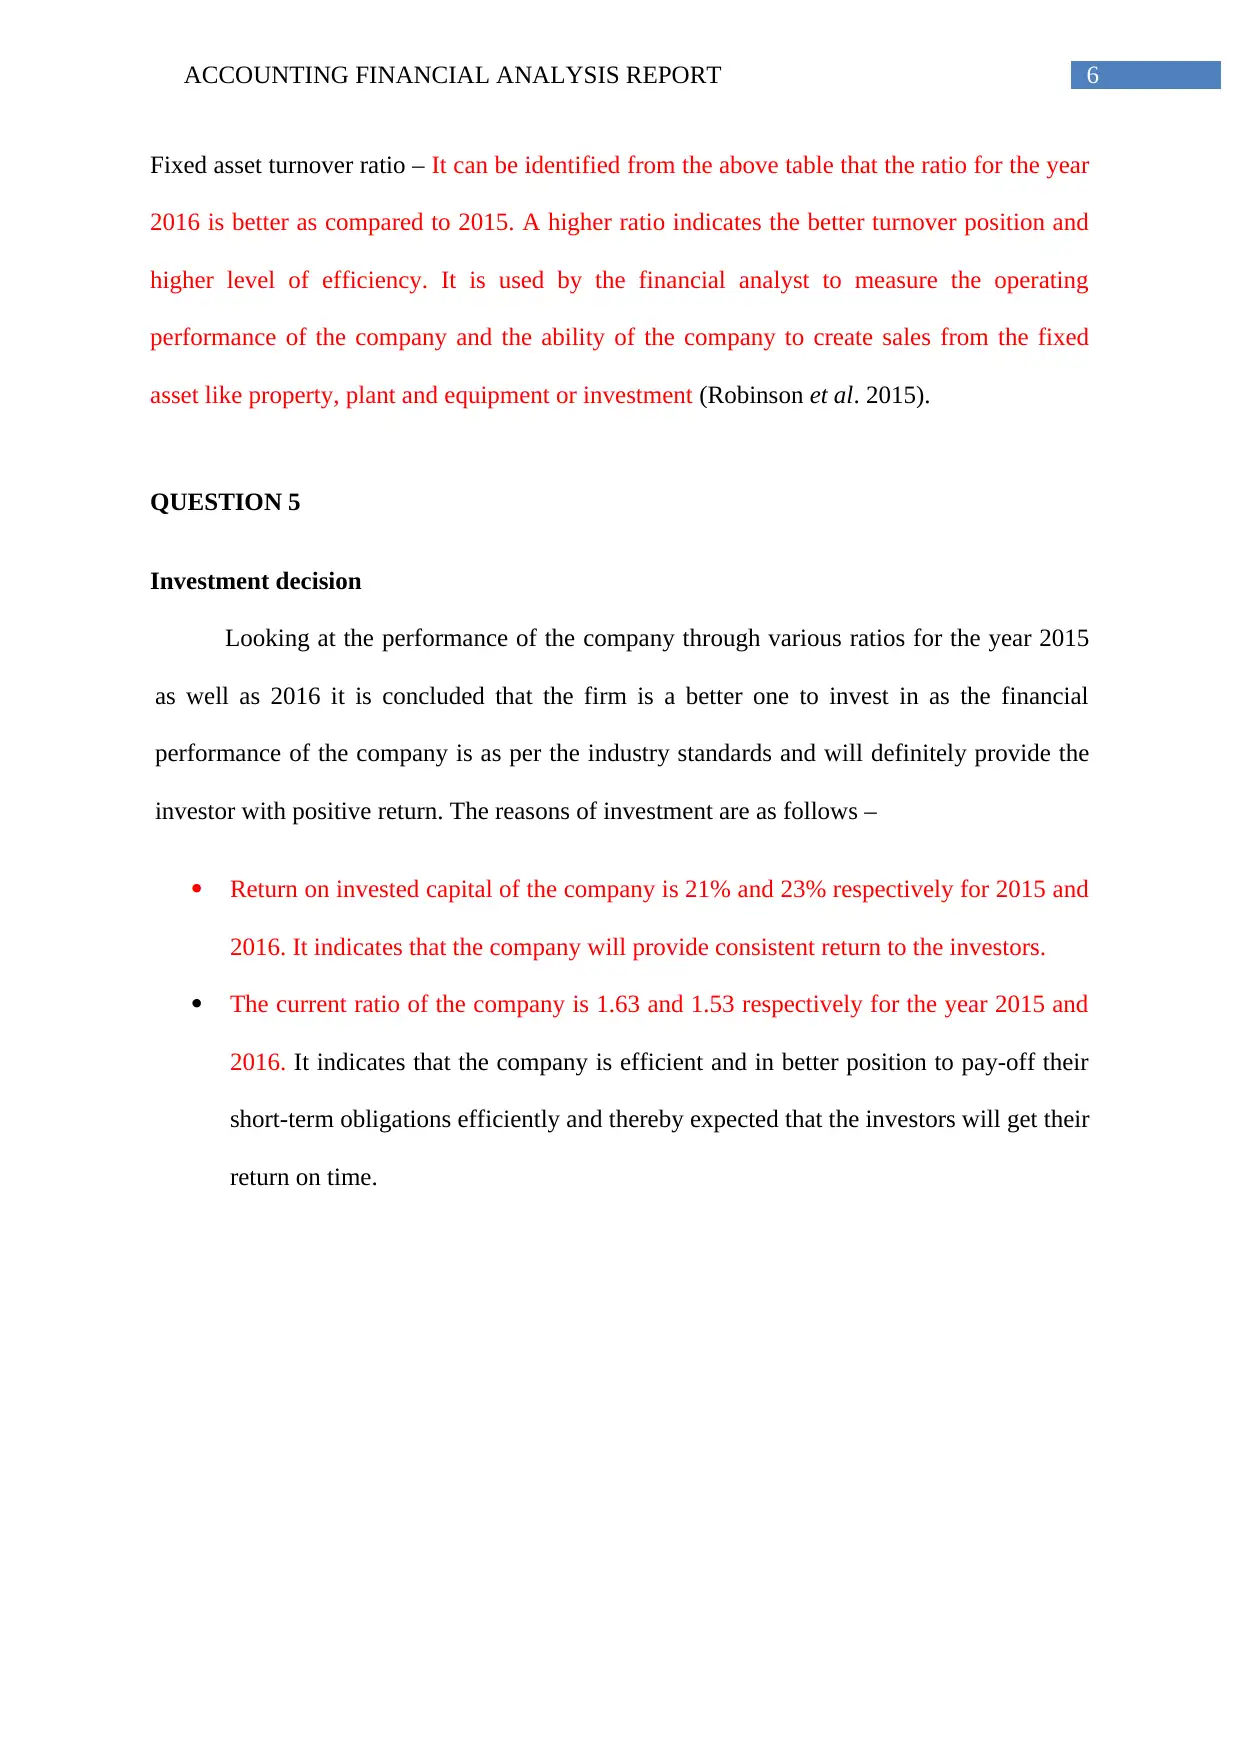
This report presents a comprehensive financial analysis of Blackmores Limited, evaluating its performance through various financial ratios for the years 2015 and 2016. The analysis includes the calculation and interpretation of liquidity ratios (current and acid-test), capital structure ratios (proprietors and debt-to-total assets), profitability ratios (inventory turnover and return on invested capital), and asset management ratios (receivable turnover and fixed asset turnover). The report assesses the company's liquidity position, capital structure, profitability, and asset management efficiency, providing insights into its financial health and performance trends. Based on the analysis, the report concludes with an investment decision, recommending investment in the company due to its strong financial performance and the potential for positive returns for investors. The report references several academic sources to support its findings and analyses.
Document Page
Running head: ACCOUNTING FINANCIAL ANALYSIS REPORT
Accounting financial analysis report
Name of the student
Name of the university
Author note
tabler-icon-diamond-filled.svg

Paraphrase This Document

Need a fresh take? Get an instant paraphrase of this document with our AI Paraphraser
Document Page
1ACCOUNTING FINANCIAL ANALYSIS REPORT
Table of Contents
QUESTION 1.............................................................................................................................2
(i) Liquidity ratio calculation...............................................................................................2
(i) Analysis of liquidity position..........................................................................................2
(ii) Financial advice to improve the overall liquidity position..........................................3
QUESTION 2.............................................................................................................................3
(i) Capital structure ratio......................................................................................................3
(i) Analysis of capital structure ratio...................................................................................3
QUESTION 3.............................................................................................................................4
(i) Calculation of profitability ratio......................................................................................4
(i) Analysis of profitability position of the company...........................................................4
QUESTION 4.............................................................................................................................5
(i) Calculation of asset management ratio...........................................................................5
(i) Analysis of asset management efficiency position.........................................................5
QUESTION 5.............................................................................................................................6
Investment decision................................................................................................................6
Reference....................................................................................................................................6
Document Page
2ACCOUNTING FINANCIAL ANALYSIS REPORT
QUESTION 1
(i) Liquidity ratio calculation
Liquidity ratios Formula 2015 2016
Current ratio current assets / current liabilities 1.63 1.53
Acid test ratio
(current assets - inventories)/ current
liabilities 1.30 0.93
(i) Analysis of liquidity position
Current ratio – The current ratio of Blackmores Limited is 1.53 for 2015 and 1.63 for 2016
which is more than the required rate of 1. It can be recognized from the above calculation that
the liquidity position of the company for the year has been improved. The current ratio of any
company is regarded as healthy if it is 1 or more than one. However, the ratio more than 2
indicates that the company is not utilising its working capital in efficient way (Morris and
Shin 2016). Therefore, it can be said that the liquidity position of the company is good and
they are in comfortable position to pay-off their current obligation comfortably.
Acid test ratio – It is calculated that the acid test ratio for Blackmores limited for the Year
2015 is 0.93 and that of 2016 is 1.30. The acid test ratio identifies whether the organization is
capable of paying off its short-term obligations with the available short-term assets.
Generally the acid test ratio of between the range of 0,20 to 0.50 is considered healthy (Noor
and Lodhi 2015). It can be identified that the liquidity position of the company while the
inventories are not considered is quite healthy. Though, the ratio of 2016 is quite better as
compared to that of 2015, the acid test ratio of both the year is healthy.
(ii) Financial advice to improve the overall liquidity position
Reducing the overhead – reducing the overhead of the company is one of the ways to
improve the liquidity position (Zhu 2014). Operating expenses or overhead cost include
Document Page
3ACCOUNTING FINANCIAL ANALYSIS REPORT
various things that do not contribute to the profit. Some common overheads like insurance,
utilities, rent, and professional fees can be reduced to improve the overall liquidity position.
QUESTION 2
(i) Capital structure ratio
Liquidity ratios Formula 2015 2016
Proprietors Ratio Proprietors fund / Total assets 0.45 0.42
Debt to total asset ratio Total liabilities / Total assets 0.55 0.58
(i) Analysis of capital structure ratio
Proprietors ratio – It can be seen that the proprietors ratio of Blackmores Limited is 42% for
the year 2015 and 45% for the year 2016. The proprietors ratio of Blackmores Limited
reveals that the shareholder’s contribution in the total capital of the organization. The low
proprietary ratio like 40 - 50% is indicating that the company has strong position with regard
to the finance and the creditors are highly secured. On the contrary, the higher ratio like more
than 50% would have indicated that the company is highly dependent on the debts for its
business operation (Zeitun and Tian 2014). Further, the bigger portion of debt in the capital
decreases the interest of the creditors, increase the expenses towards interest and increase the
risk related to bankruptcy. Generally, the ratio of 40% is considered as healthy for the
organization. Therefore, it can be said that the proprietor’s ratio of the company is under
control.
Debt to total asset ratio – Debt to total asset ratio of Blackmores Limited is 58% for the year
2015 and 55% for the year 2016. Normally, the ratio of 50 - 60% is indicating that the
position of Blackmores is healthy for the organization to be viable in the long-run. It is the
leverage ratio that calculates the amount of the total asset financed by the creditors rather
than the investors. On other words, it is the ratio of asset that is financed through borrowing.
tabler-icon-diamond-filled.svg

Paraphrase This Document

Need a fresh take? Get an instant paraphrase of this document with our AI Paraphraser
Document Page
4ACCOUNTING FINANCIAL ANALYSIS REPORT
Generally, it evaluates how the company is growing and acquiring the assets over the time
(Robb and Robinson 2014). It can be seen that the Therefore, it can be said that the debt to
total asset ratio of the company is as per requirement.
QUESTION 3
(i) Calculation of profitability ratio
Ratios Formula 2015 2016
Profitability ratio
Inventory turnover
ratio
cost of goods sold / Average
inventory 0.95 0.69
Return on Invested
capital
(Net income - dividends) / Total
capital 0.21 0.23
(i) Analysis of profitability position of the company
Inventory turnover ratio – the ratio of the company for 2015 as 0.95 and for 2016 0.69 is
indicating that of the company is quite impressive as it is able sell 69% of its inventory
within a year for 2016. From the above it is identified that the company’s inventory turnover
ratio is declined in 2016 as compared to that of 2015. However, the ratio of the company is
quite impressive as it is able sell 69% of its inventory within a year for 2016. This ratio is the
efficiency ratio and revels how effectively the company is managing its inventory through
comparison of COGS with the average inventory for the specific period. This ratio is states
the time which, the inventory is sold or turned into cash by Blackmores during the year. If
the company purchases large amount of inventory it has to sale large amount of inventory to
improve the inventory turnover ratio. However, if the company is not able to sell its
inventories in timely manner, it will have to incur various costs like holding costs and
storage costs.
Document Page
5ACCOUNTING FINANCIAL ANALYSIS REPORT
Return on invested capital – However, from the table it is revealed that the OIC of the
company is 23% in 2016 as compared to the 21% of 2015. Therefore, it can be said that the
ROIC of the company has improved in 2016 as compared to 2015. This ratio is used for
assessing the efficiency of the company with regard to the allocation of its capital for the
profitable investment. ROIC reveals how the company is utilising its capital for generation of
income (Ioannidis et al. 2014). However, whether the return is good or bad, it depends on the
company’s cost of capital. If the return is more than the cost of capital, it is regarded as good
return and vice versa.
QUESTION 4
(i) Calculation of asset management ratio
Ratios Formula 2015 2016
Asset management ratio
Receivable turnover ratio Sales / accounts receivable 4.41 5.33
Fixed asset turnover ratio Sales / Net fixed assets 4.47 5.15
(i) Analysis of asset management efficiency position
Receivable turnover ratio - From the above table it is identified that the receivable turnover
ratio of the company has improved as compared to the year 2015 and for 2015 it was 4 times
approximately and for 2016 it was 5 times approximately. It is measured to calculate the
efficiency of a company with regard to extension of credit and collection of the dues. It is the
activity ratio that states the efficiency of a company in utilization of its assets. a high ratio
indicates that the company is making its sales mainly on cash and on the contrary a low ratio
suggests that the company has poor collection procedures and an inefficient credit policy or
the customers are going through bad financial condition (Tayeh, Al-Jarrah and Tarhini
2015).
Document Page
6ACCOUNTING FINANCIAL ANALYSIS REPORT
Fixed asset turnover ratio – It can be identified from the above table that the ratio for the year
2016 is better as compared to 2015. A higher ratio indicates the better turnover position and
higher level of efficiency. It is used by the financial analyst to measure the operating
performance of the company and the ability of the company to create sales from the fixed
asset like property, plant and equipment or investment (Robinson et al. 2015).
QUESTION 5
Investment decision
Looking at the performance of the company through various ratios for the year 2015
as well as 2016 it is concluded that the firm is a better one to invest in as the financial
performance of the company is as per the industry standards and will definitely provide the
investor with positive return. The reasons of investment are as follows –
Return on invested capital of the company is 21% and 23% respectively for 2015 and
2016. It indicates that the company will provide consistent return to the investors.
The current ratio of the company is 1.63 and 1.53 respectively for the year 2015 and
2016. It indicates that the company is efficient and in better position to pay-off their
short-term obligations efficiently and thereby expected that the investors will get their
return on time.
tabler-icon-diamond-filled.svg

Paraphrase This Document

Need a fresh take? Get an instant paraphrase of this document with our AI Paraphraser
Document Page
7ACCOUNTING FINANCIAL ANALYSIS REPORT
Reference
Ioannidis, J.P., Greenland, S., Hlatky, M.A., Khoury, M.J., Macleod, M.R., Moher, D.,
Schulz, K.F. and Tibshirani, R., 2014. Increasing value and reducing waste in research
design, conduct, and analysis. The Lancet, 383(9912), pp.166-175.
Morris, S. and Shin, H.S., 2016. Illiquidity component of credit risk. International Economic
Review, 57(4), pp.1135-1148.
Noor, A. and Lodhi, S., 2015. Impact of Liquidity Ratio on Profitability: An Empirical Study
of Automobile Sector in Karachi. International Journal of Scientific and Research
Publications, p.639.
Robb, A.M. and Robinson, D.T., 2014. The capital structure decisions of new firms. The
Review of Financial Studies, 27(1), pp.153-179.
Robinson, T.R., Henry, E., Pirie, W.L. and Broihahn, M.A., 2015. International financial
statement analysis. John Wiley & Sons.
Tayeh, M., Al-Jarrah, I.M. and Tarhini, A., 2015. Accounting vs. market-based measures of
firm performance related to information technology investments.
Zeitun, R. and Tian, G.G., 2014. Capital structure and corporate performance: evidence from
Jordan.
Zhu, J., 2014. Quantitative models for performance evaluation and benchmarking: data
envelopment analysis with spreadsheets (Vol. 213). Springer.
chevron_up_icon
1 out of 8
circle_padding
hide_on_mobile
zoom_out_icon
[object Object]