Financial Ratio Analysis of BMW Group: A Comprehensive Report
VerifiedAdded on 2023/01/18
|14
|3647
|100
Report
AI Summary
This report presents a financial analysis of the BMW Group, examining its performance through various financial ratios. It begins with an executive summary and an introduction to accounting and financial analysis, highlighting their importance in managing finances and developing business strategies. The main body of the report delves into the calculation and analysis of several key ratios, including liquidity ratios (quick and current ratios), profitability ratios (gross profit and operating profit ratios), efficiency ratios (average receivable turnover and average payable turnover ratios), and gearing ratios (debt and debt-to-equity ratios). Each ratio is calculated using financial data from BMW's annual reports for 2017 and 2018, with interpretations of the results and their implications for the company's financial health and operational efficiency. The analysis identifies trends, such as changes in profitability and debt levels, and offers insights into BMW's ability to manage its assets, liabilities, and overall financial risk. The report concludes with a summary of the findings and references used. This report is a student contribution to Desklib, a platform offering AI-based study tools.
Accounting and
finance analysis of
a listed company
finance analysis of
a listed company
Paraphrase This Document
Need a fresh take? Get an instant paraphrase of this document with our AI Paraphraser
EXECUTIVE SUMMARY
This report summarised that use of financial ratio in order to identify the liquidity,
profitability, efficacy or market value of the company. With the help of accounting or financial
analysis business able to collect or summarised the accounting information and further used for
the analysis which helps in developing future strategies in respect of the company.
Table of Contents
EXECUTIVE SUMMARY ............................................................................................................2
INTRODUCTION...........................................................................................................................1
MAIN BODY...................................................................................................................................1
CONCLUSION................................................................................................................................9
REFERENCES..............................................................................................................................10
⊘ This is a preview!⊘
Do you want full access?
Subscribe today to unlock all pages.
Trusted by 1+ million students worldwide
INTRODUCTION
Accounting and financial analysis help the organization manage their finances as
distribute it as per the requirement daily operations. Accounting is the process which help the
internal people of the organization to manage their daily transactions which is related to
monetary terms. Record each of them and maintain proper books of accounts in order to analyse
its results. With the help of financial information, organization able to done financial analysis
which helps in measuring the profitability of the operations. It further identify the reasons as well
if company is in loss (Andansari, Raharjo and Andini, 2016). In order to get better understanding
of this concepts, this project report select the BMW Group which is German based multinational
automatic sector company. This report cover the various topics such as different types of ratios
along with calculation as well as it analysis for effective outcomes. Profitability, Liquidity,
Efficiency, Gearing and Investment ratio etc. are the different types of ratio.
MAIN BODY
BMW Group is a German company which produce auto-mobiles and motorcycles. It is
founded in 1916 and they manufacture luxury cars. There are various big names also included
with BMW because these are the subsidiary of it such as MINI, Rolls Royce etc. Below mention
various categories ratio calculated with the help of financial information of BMW company and
it will be collected from annual report. Calculation of ratio mentioned below:
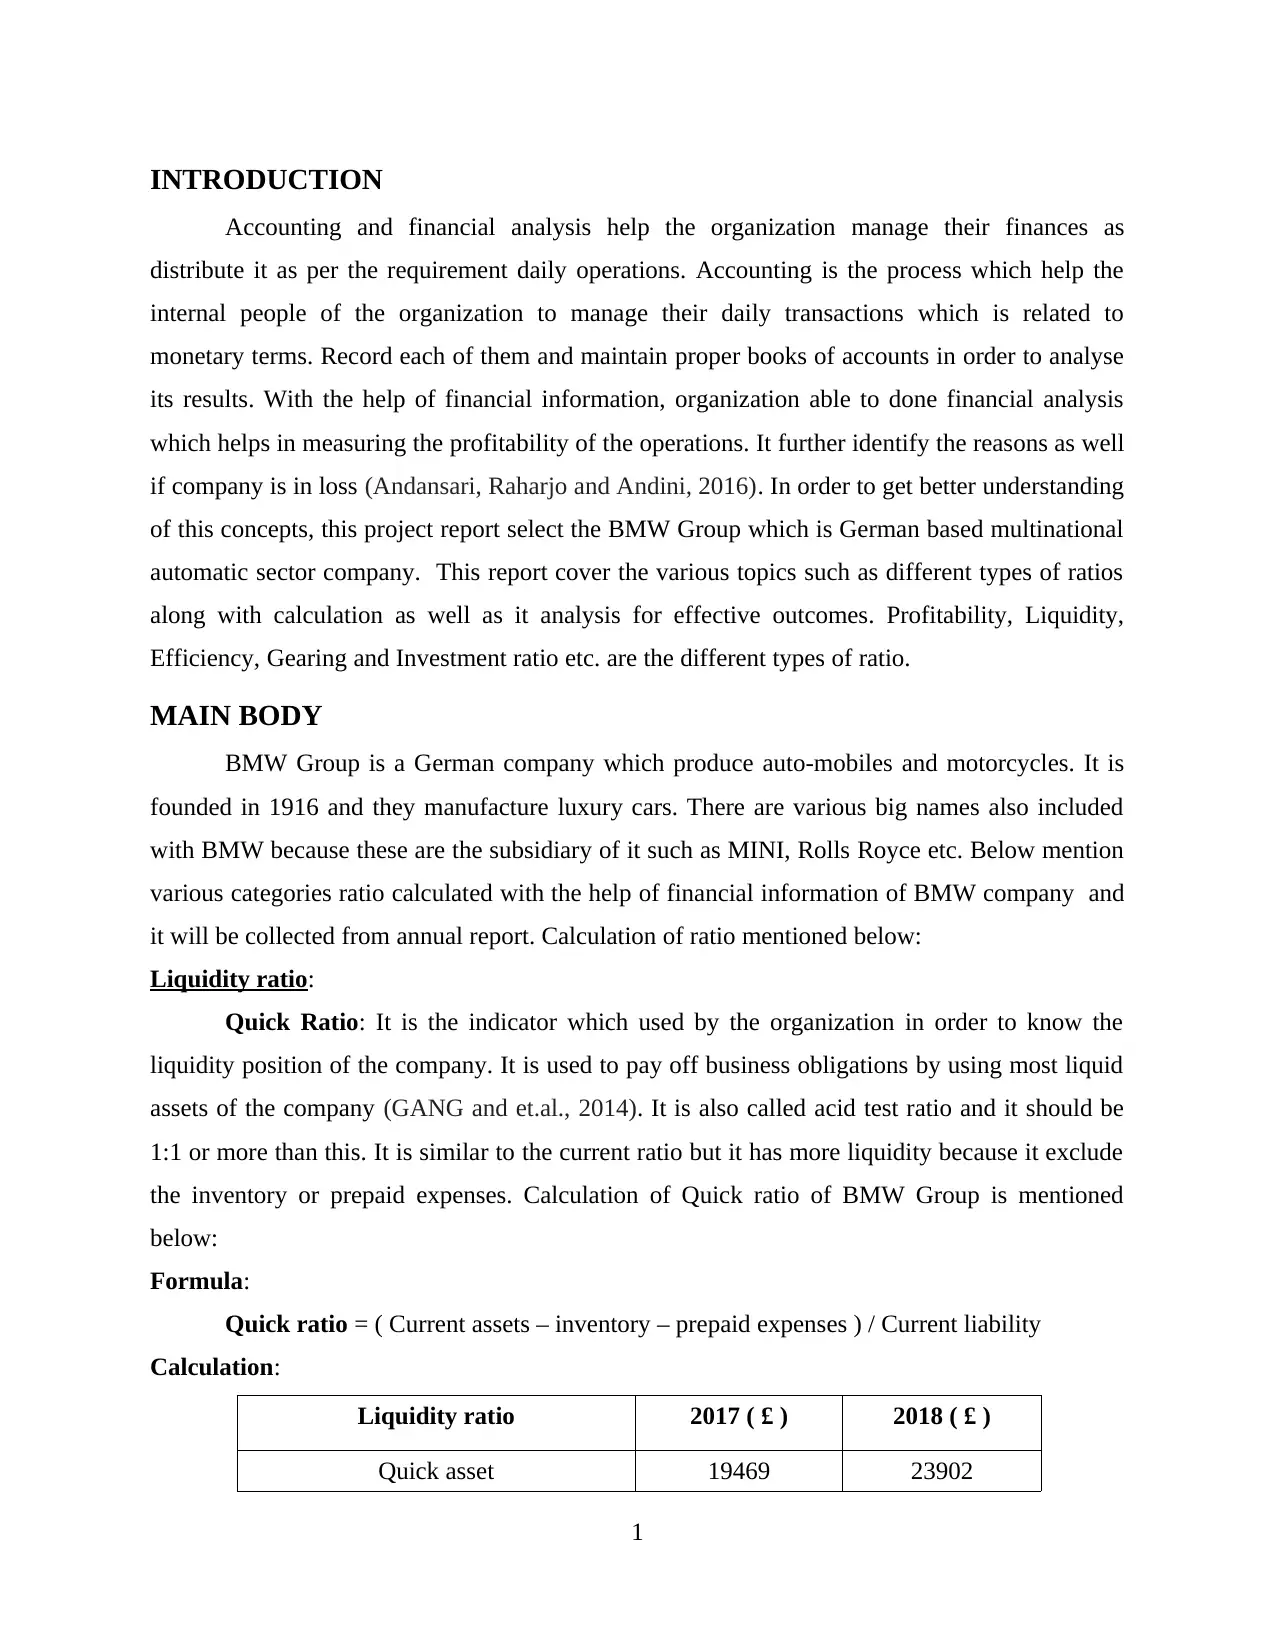
Liquidity ratio:
Quick Ratio: It is the indicator which used by the organization in order to know the
liquidity position of the company. It is used to pay off business obligations by using most liquid
assets of the company (GANG and et.al., 2014). It is also called acid test ratio and it should be
1:1 or more than this. It is similar to the current ratio but it has more liquidity because it exclude
the inventory or prepaid expenses. Calculation of Quick ratio of BMW Group is mentioned
below:
Formula:
Quick ratio = ( Current assets – inventory – prepaid expenses ) / Current liability
Calculation:
Liquidity ratio 2017 ( £ ) 2018 ( £ )
Quick asset 19469 23902
1
Accounting and financial analysis help the organization manage their finances as
distribute it as per the requirement daily operations. Accounting is the process which help the
internal people of the organization to manage their daily transactions which is related to
monetary terms. Record each of them and maintain proper books of accounts in order to analyse
its results. With the help of financial information, organization able to done financial analysis
which helps in measuring the profitability of the operations. It further identify the reasons as well
if company is in loss (Andansari, Raharjo and Andini, 2016). In order to get better understanding
of this concepts, this project report select the BMW Group which is German based multinational
automatic sector company. This report cover the various topics such as different types of ratios
along with calculation as well as it analysis for effective outcomes. Profitability, Liquidity,
Efficiency, Gearing and Investment ratio etc. are the different types of ratio.
MAIN BODY
BMW Group is a German company which produce auto-mobiles and motorcycles. It is
founded in 1916 and they manufacture luxury cars. There are various big names also included
with BMW because these are the subsidiary of it such as MINI, Rolls Royce etc. Below mention
various categories ratio calculated with the help of financial information of BMW company and
it will be collected from annual report. Calculation of ratio mentioned below:
Liquidity ratio:
Quick Ratio: It is the indicator which used by the organization in order to know the
liquidity position of the company. It is used to pay off business obligations by using most liquid
assets of the company (GANG and et.al., 2014). It is also called acid test ratio and it should be
1:1 or more than this. It is similar to the current ratio but it has more liquidity because it exclude
the inventory or prepaid expenses. Calculation of Quick ratio of BMW Group is mentioned
below:
Formula:
Quick ratio = ( Current assets – inventory – prepaid expenses ) / Current liability
Calculation:
Liquidity ratio 2017 ( £ ) 2018 ( £ )
Quick asset 19469 23902
1
Paraphrase This Document
Need a fresh take? Get an instant paraphrase of this document with our AI Paraphraser
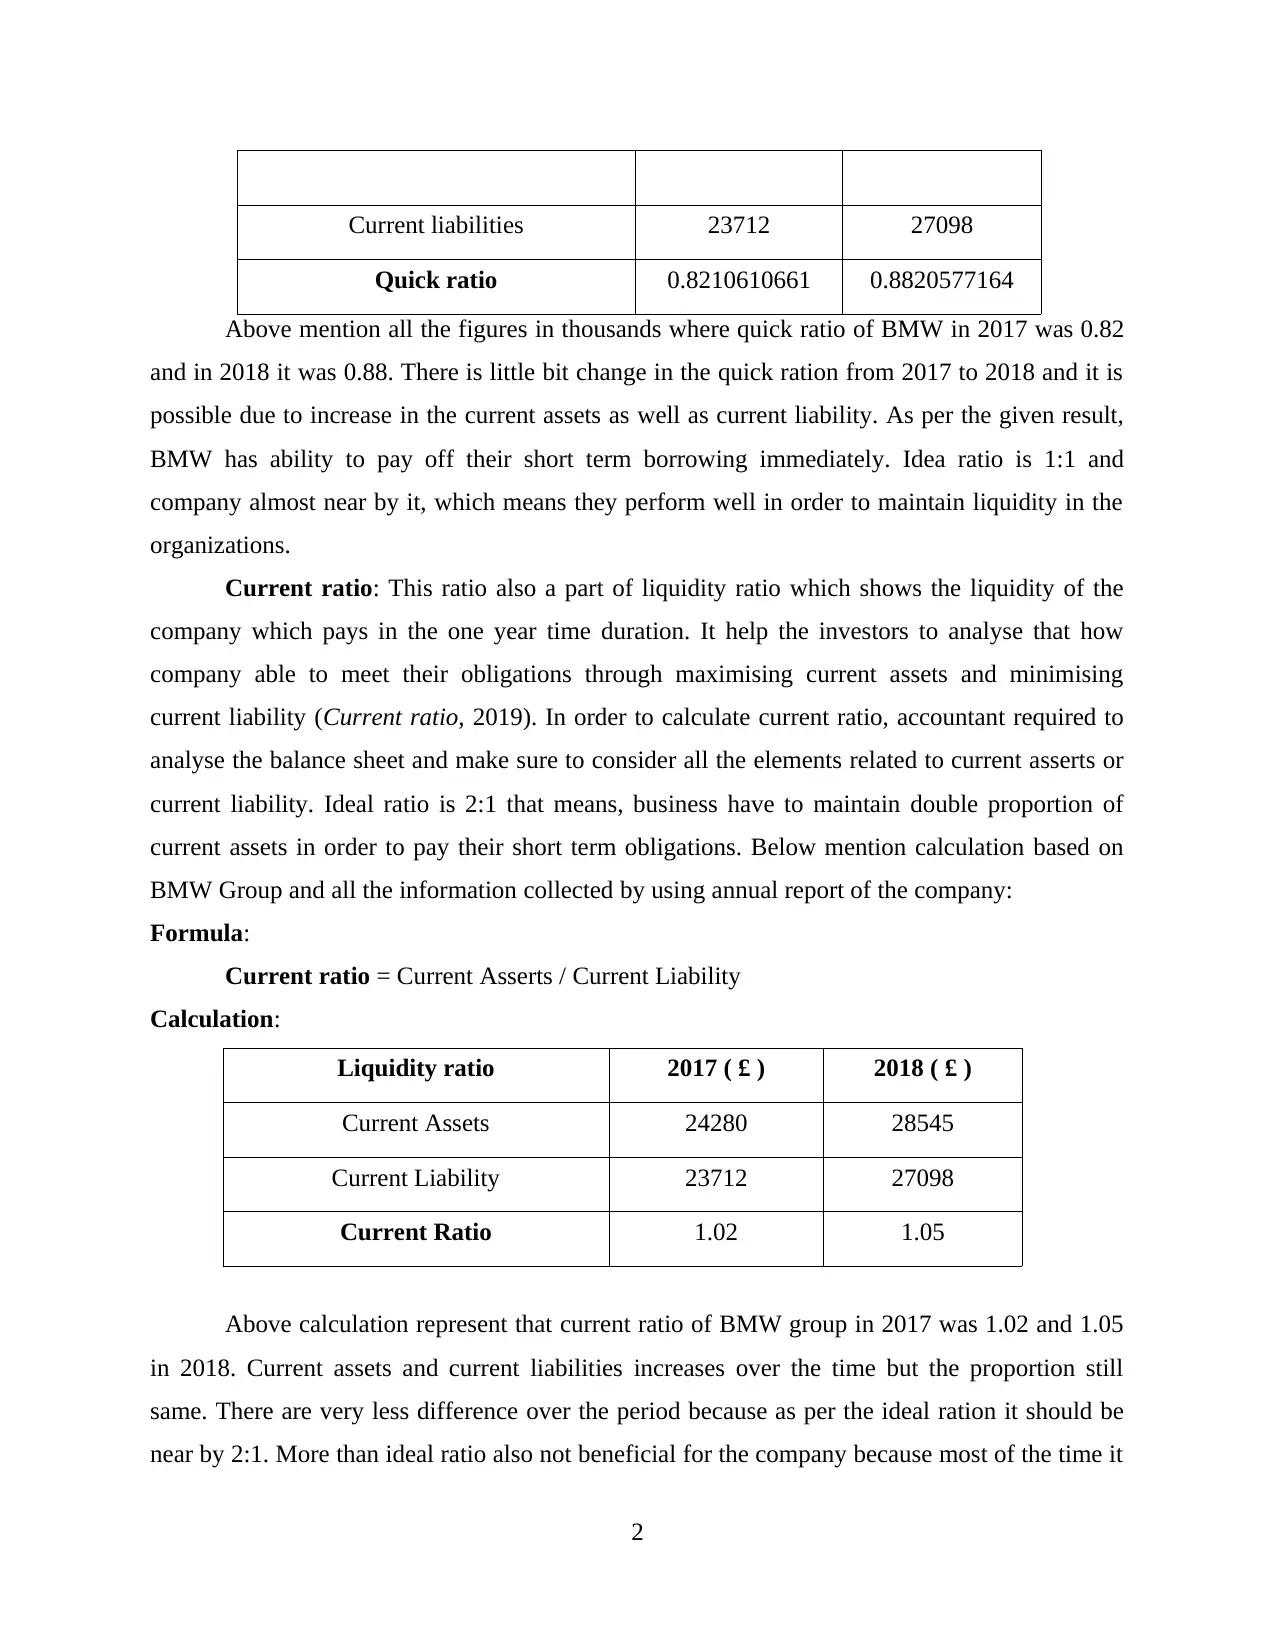
Current liabilities 23712 27098
Quick ratio 0.8210610661 0.8820577164
Above mention all the figures in thousands where quick ratio of BMW in 2017 was 0.82
and in 2018 it was 0.88. There is little bit change in the quick ration from 2017 to 2018 and it is
possible due to increase in the current assets as well as current liability. As per the given result,
BMW has ability to pay off their short term borrowing immediately. Idea ratio is 1:1 and
company almost near by it, which means they perform well in order to maintain liquidity in the
organizations.
Current ratio: This ratio also a part of liquidity ratio which shows the liquidity of the
company which pays in the one year time duration. It help the investors to analyse that how
company able to meet their obligations through maximising current assets and minimising
current liability (Current ratio, 2019). In order to calculate current ratio, accountant required to
analyse the balance sheet and make sure to consider all the elements related to current asserts or
current liability. Ideal ratio is 2:1 that means, business have to maintain double proportion of
current assets in order to pay their short term obligations. Below mention calculation based on
BMW Group and all the information collected by using annual report of the company:
Formula:
Current ratio = Current Asserts / Current Liability
Calculation:
Liquidity ratio 2017 ( £ ) 2018 ( £ )
Current Assets 24280 28545
Current Liability 23712 27098
Current Ratio 1.02 1.05
Above calculation represent that current ratio of BMW group in 2017 was 1.02 and 1.05
in 2018. Current assets and current liabilities increases over the time but the proportion still
same. There are very less difference over the period because as per the ideal ration it should be
near by 2:1. More than ideal ratio also not beneficial for the company because most of the time it
2
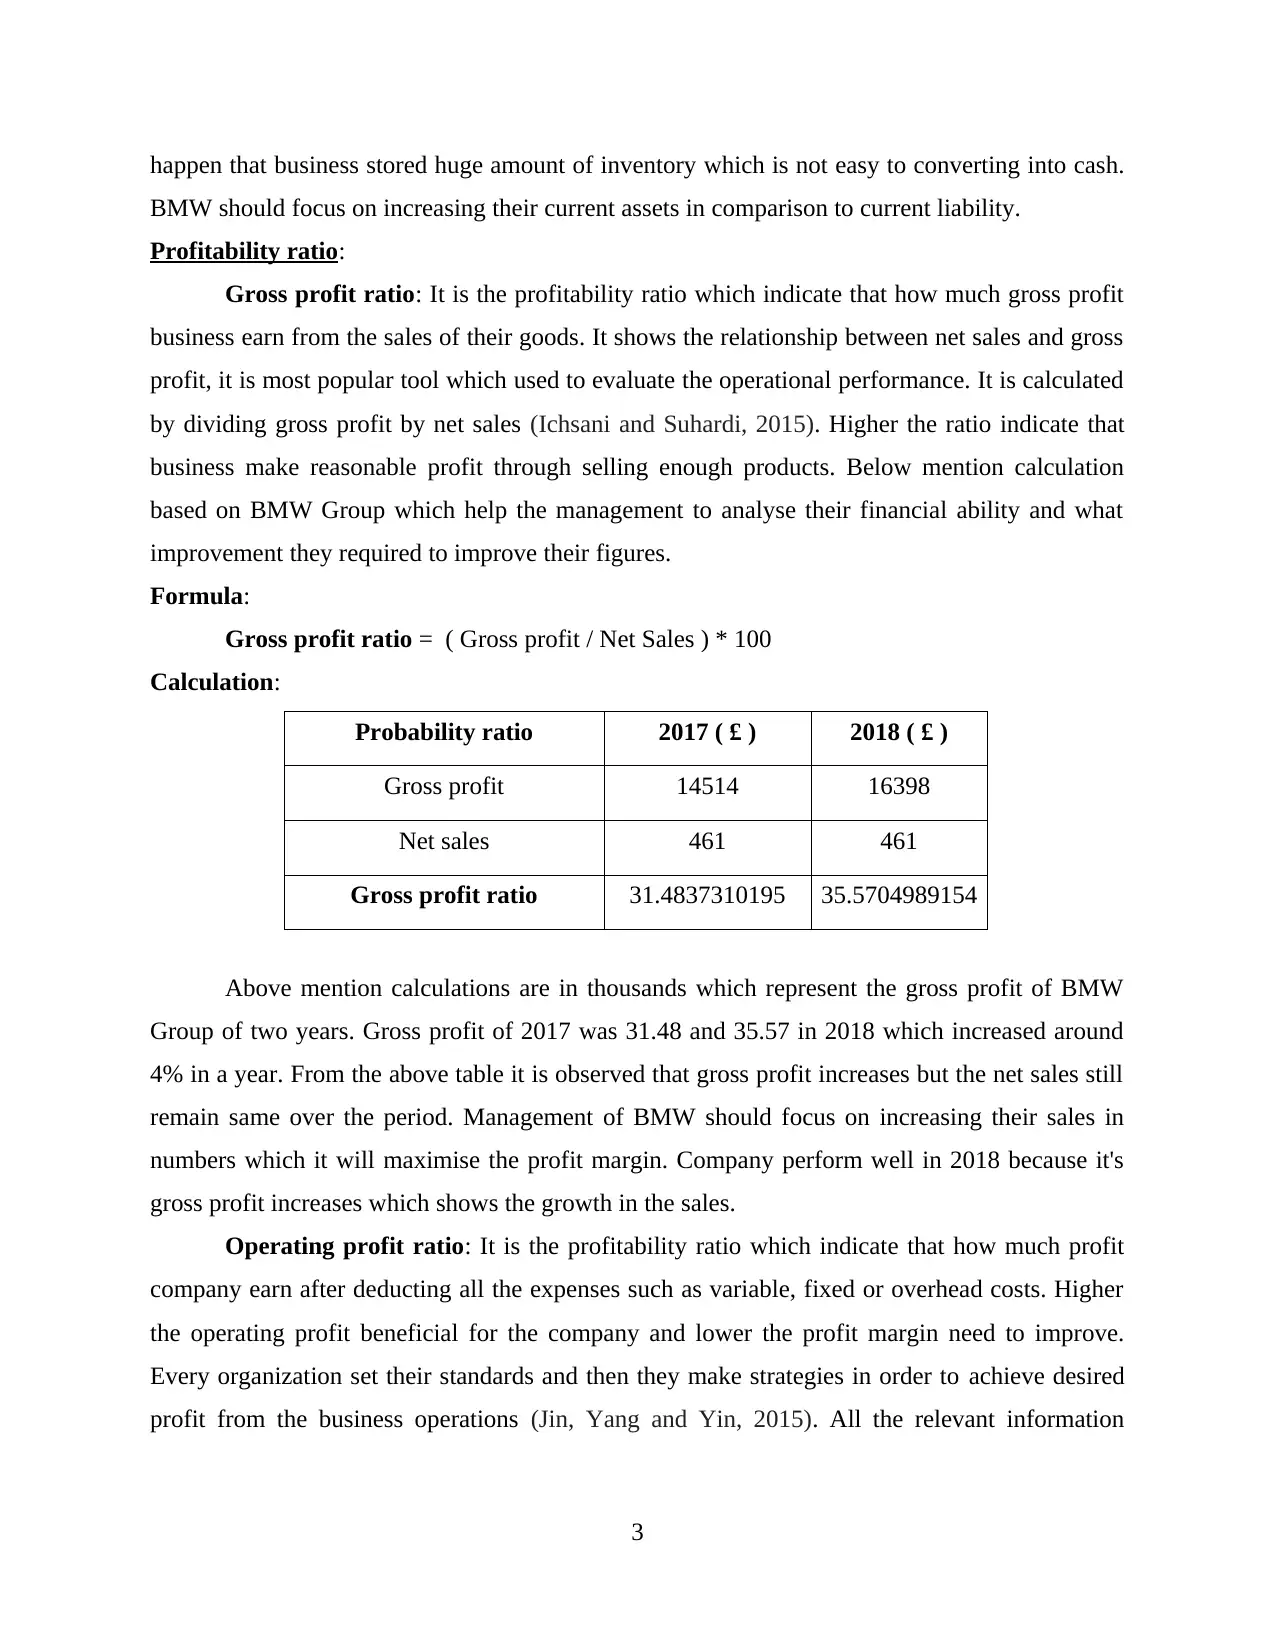
happen that business stored huge amount of inventory which is not easy to converting into cash.
BMW should focus on increasing their current assets in comparison to current liability.
Profitability ratio:
Gross profit ratio: It is the profitability ratio which indicate that how much gross profit
business earn from the sales of their goods. It shows the relationship between net sales and gross
profit, it is most popular tool which used to evaluate the operational performance. It is calculated
by dividing gross profit by net sales (Ichsani and Suhardi, 2015). Higher the ratio indicate that
business make reasonable profit through selling enough products. Below mention calculation
based on BMW Group which help the management to analyse their financial ability and what
improvement they required to improve their figures.
Formula:
Gross profit ratio = ( Gross profit / Net Sales ) * 100
Calculation:
Probability ratio 2017 ( £ ) 2018 ( £ )
Gross profit 14514 16398
Net sales 461 461
Gross profit ratio 31.4837310195 35.5704989154
Above mention calculations are in thousands which represent the gross profit of BMW
Group of two years. Gross profit of 2017 was 31.48 and 35.57 in 2018 which increased around
4% in a year. From the above table it is observed that gross profit increases but the net sales still
remain same over the period. Management of BMW should focus on increasing their sales in
numbers which it will maximise the profit margin. Company perform well in 2018 because it's
gross profit increases which shows the growth in the sales.
Operating profit ratio: It is the profitability ratio which indicate that how much profit
company earn after deducting all the expenses such as variable, fixed or overhead costs. Higher
the operating profit beneficial for the company and lower the profit margin need to improve.
Every organization set their standards and then they make strategies in order to achieve desired
profit from the business operations (Jin, Yang and Yin, 2015). All the relevant information
3
⊘ This is a preview!⊘
Do you want full access?
Subscribe today to unlock all pages.
Trusted by 1+ million students worldwide
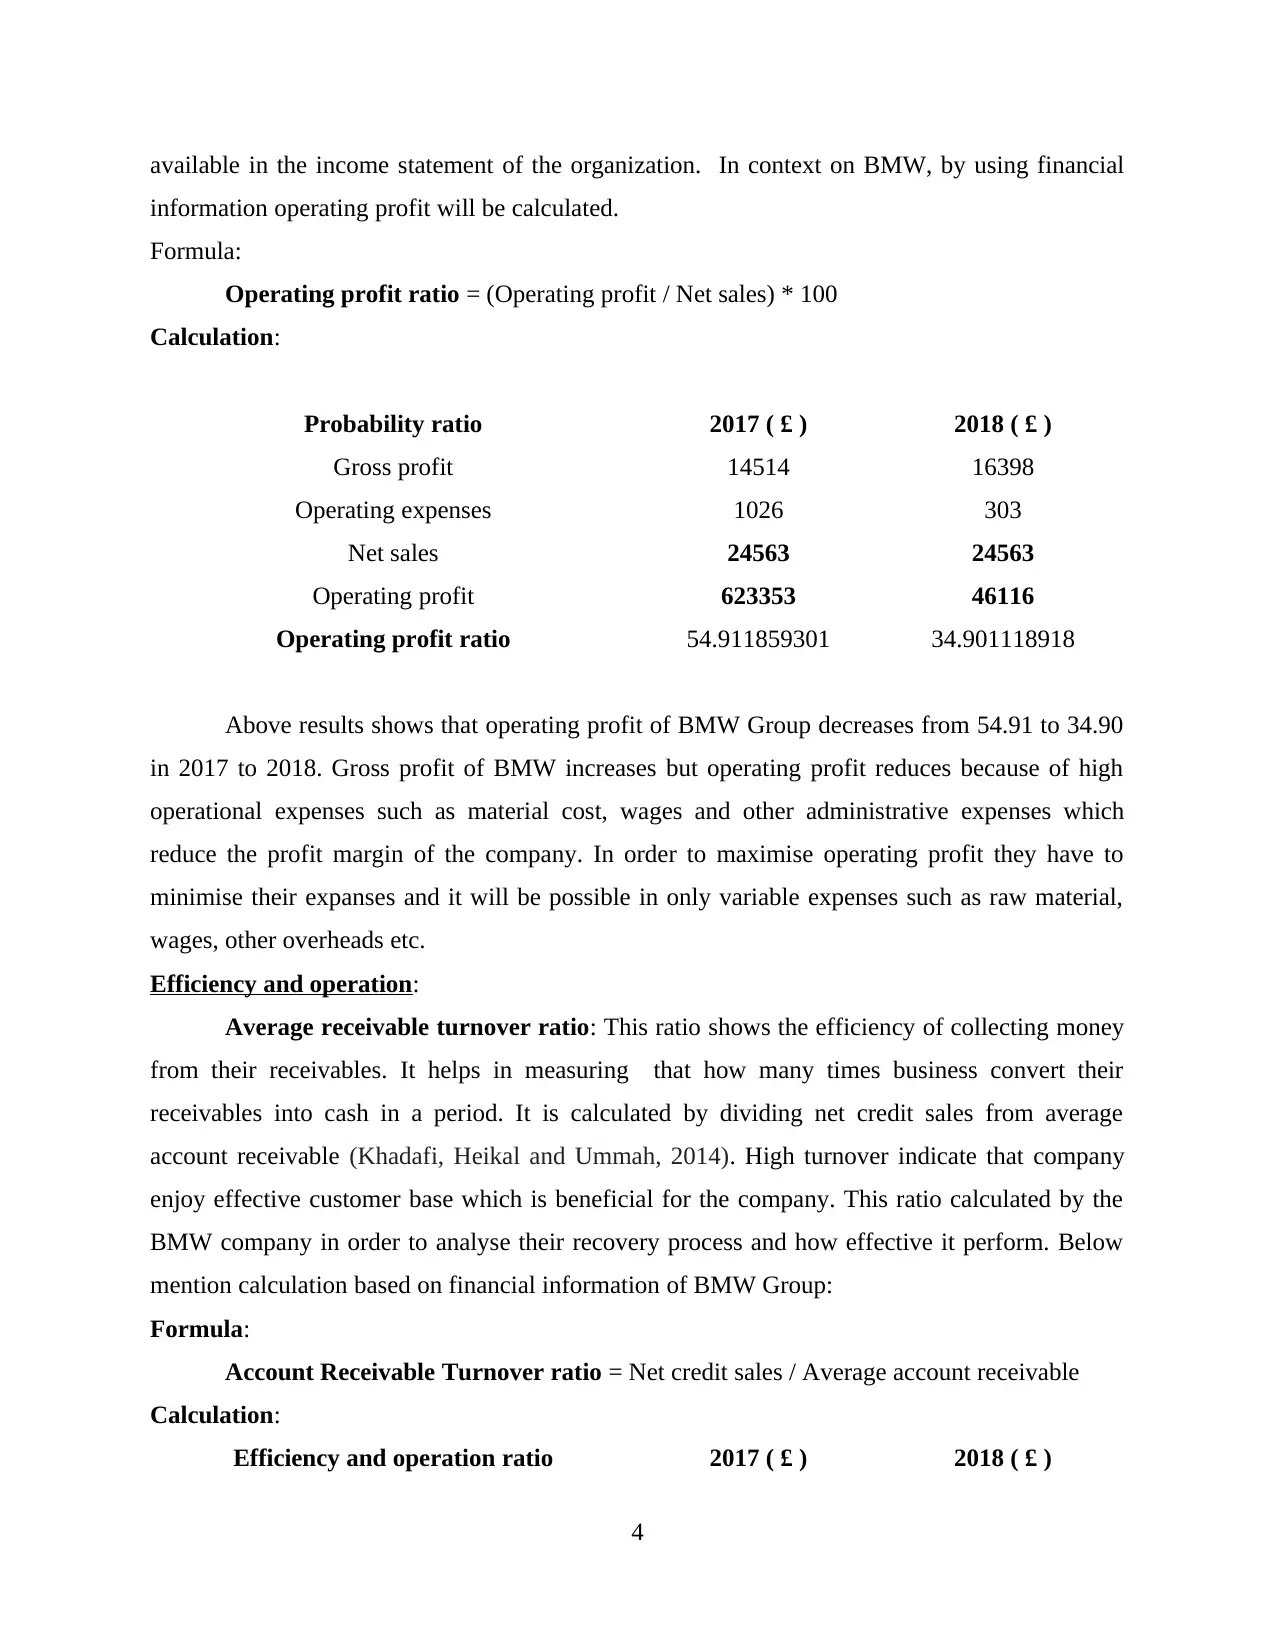
available in the income statement of the organization. In context on BMW, by using financial
information operating profit will be calculated.
Formula:
Operating profit ratio = (Operating profit / Net sales) * 100
Calculation:
Probability ratio 2017 ( £ ) 2018 ( £ )
Gross profit 14514 16398
Operating expenses 1026 303
Net sales 24563 24563
Operating profit 623353 46116
Operating profit ratio 54.911859301 34.901118918
Above results shows that operating profit of BMW Group decreases from 54.91 to 34.90
in 2017 to 2018. Gross profit of BMW increases but operating profit reduces because of high
operational expenses such as material cost, wages and other administrative expenses which
reduce the profit margin of the company. In order to maximise operating profit they have to
minimise their expanses and it will be possible in only variable expenses such as raw material,
wages, other overheads etc.
Efficiency and operation:
Average receivable turnover ratio: This ratio shows the efficiency of collecting money
from their receivables. It helps in measuring that how many times business convert their
receivables into cash in a period. It is calculated by dividing net credit sales from average
account receivable (Khadafi, Heikal and Ummah, 2014). High turnover indicate that company
enjoy effective customer base which is beneficial for the company. This ratio calculated by the
BMW company in order to analyse their recovery process and how effective it perform. Below
mention calculation based on financial information of BMW Group:
Formula:
Account Receivable Turnover ratio = Net credit sales / Average account receivable
Calculation:
Efficiency and operation ratio 2017 ( £ ) 2018 ( £ )
4
Paraphrase This Document
Need a fresh take? Get an instant paraphrase of this document with our AI Paraphraser
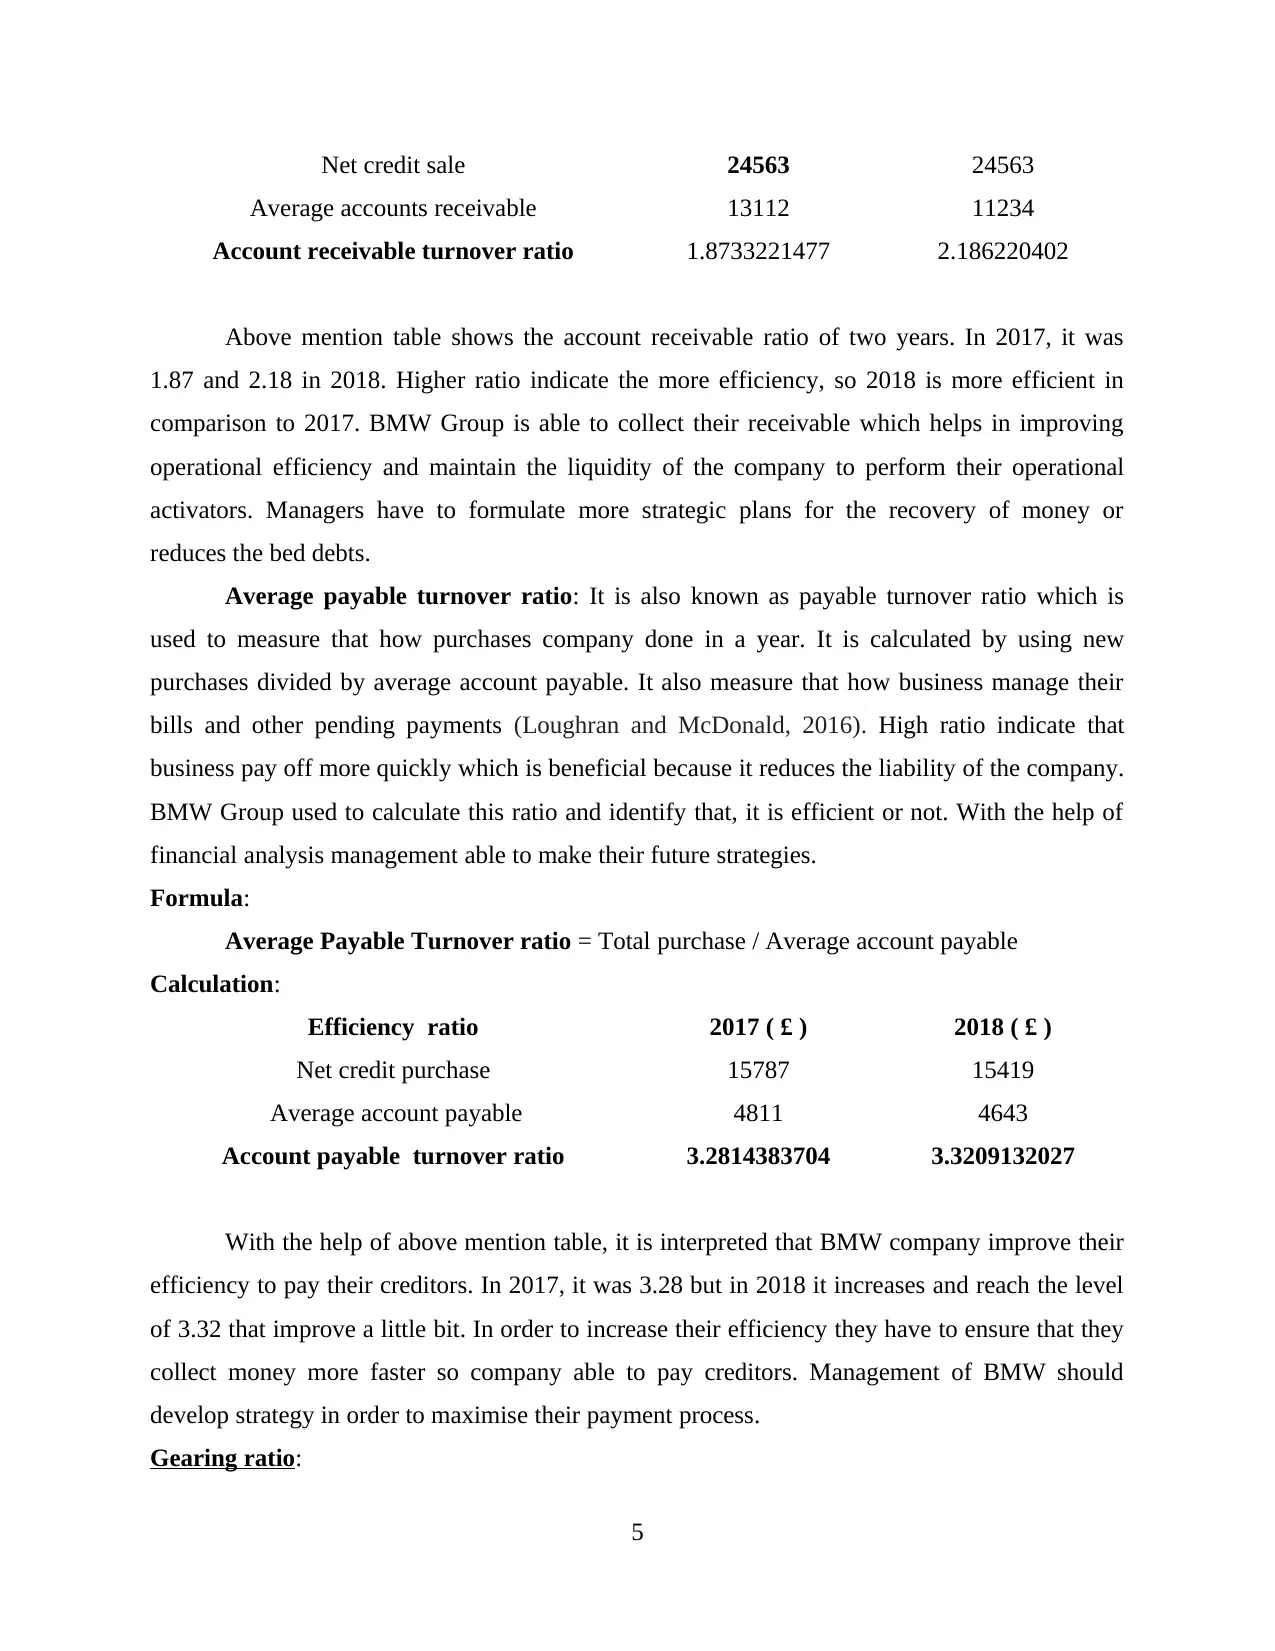
Net credit sale 24563 24563
Average accounts receivable 13112 11234
Account receivable turnover ratio 1.8733221477 2.186220402
Above mention table shows the account receivable ratio of two years. In 2017, it was
1.87 and 2.18 in 2018. Higher ratio indicate the more efficiency, so 2018 is more efficient in
comparison to 2017. BMW Group is able to collect their receivable which helps in improving
operational efficiency and maintain the liquidity of the company to perform their operational
activators. Managers have to formulate more strategic plans for the recovery of money or
reduces the bed debts.
Average payable turnover ratio: It is also known as payable turnover ratio which is
used to measure that how purchases company done in a year. It is calculated by using new
purchases divided by average account payable. It also measure that how business manage their
bills and other pending payments (Loughran and McDonald, 2016). High ratio indicate that
business pay off more quickly which is beneficial because it reduces the liability of the company.
BMW Group used to calculate this ratio and identify that, it is efficient or not. With the help of
financial analysis management able to make their future strategies.
Formula:
Average Payable Turnover ratio = Total purchase / Average account payable
Calculation:
Efficiency ratio 2017 ( £ ) 2018 ( £ )
Net credit purchase 15787 15419
Average account payable 4811 4643
Account payable turnover ratio 3.2814383704 3.3209132027
With the help of above mention table, it is interpreted that BMW company improve their
efficiency to pay their creditors. In 2017, it was 3.28 but in 2018 it increases and reach the level
of 3.32 that improve a little bit. In order to increase their efficiency they have to ensure that they
collect money more faster so company able to pay creditors. Management of BMW should
develop strategy in order to maximise their payment process.
Gearing ratio:
5
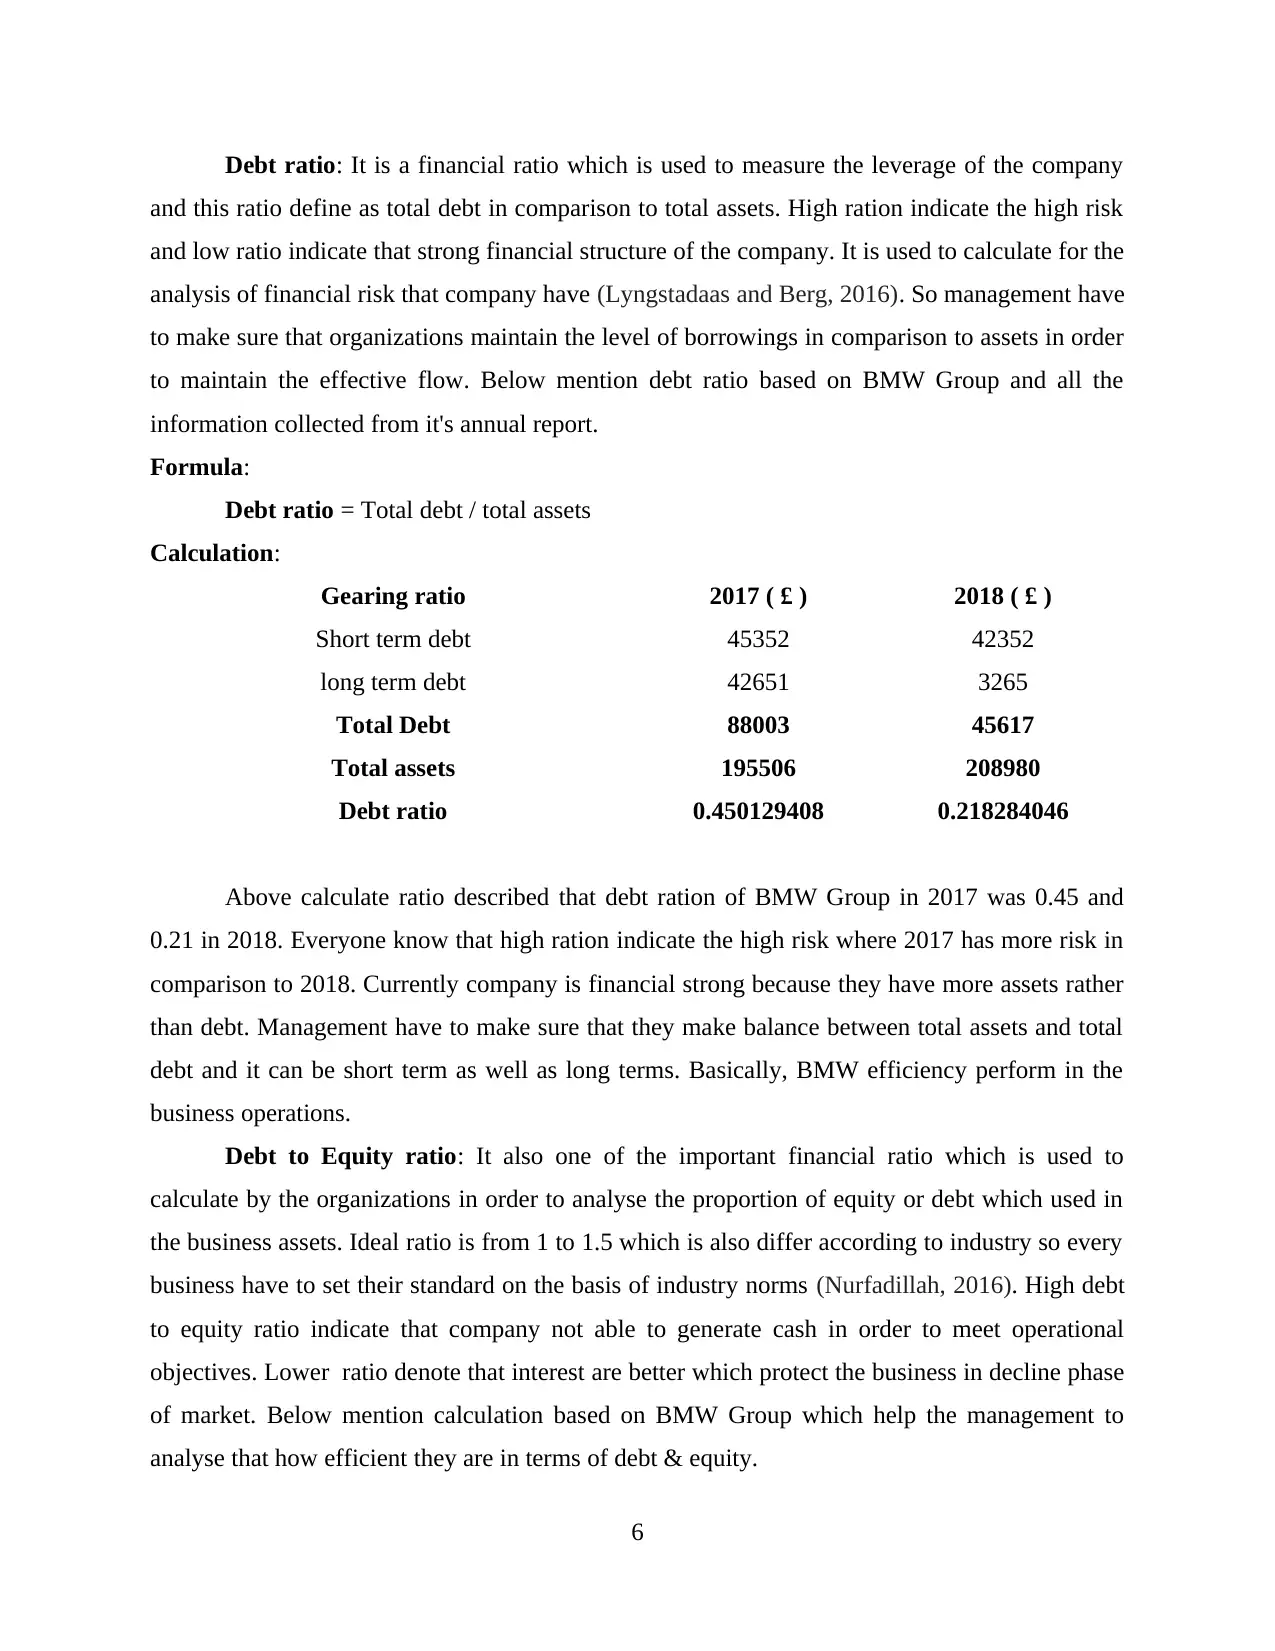
Debt ratio: It is a financial ratio which is used to measure the leverage of the company
and this ratio define as total debt in comparison to total assets. High ration indicate the high risk
and low ratio indicate that strong financial structure of the company. It is used to calculate for the
analysis of financial risk that company have (Lyngstadaas and Berg, 2016). So management have
to make sure that organizations maintain the level of borrowings in comparison to assets in order
to maintain the effective flow. Below mention debt ratio based on BMW Group and all the
information collected from it's annual report.
Formula:
Debt ratio = Total debt / total assets
Calculation:
Gearing ratio 2017 ( £ ) 2018 ( £ )
Short term debt 45352 42352
long term debt 42651 3265
Total Debt 88003 45617
Total assets 195506 208980
Debt ratio 0.450129408 0.218284046
Above calculate ratio described that debt ration of BMW Group in 2017 was 0.45 and
0.21 in 2018. Everyone know that high ration indicate the high risk where 2017 has more risk in
comparison to 2018. Currently company is financial strong because they have more assets rather
than debt. Management have to make sure that they make balance between total assets and total
debt and it can be short term as well as long terms. Basically, BMW efficiency perform in the
business operations.
Debt to Equity ratio: It also one of the important financial ratio which is used to
calculate by the organizations in order to analyse the proportion of equity or debt which used in
the business assets. Ideal ratio is from 1 to 1.5 which is also differ according to industry so every
business have to set their standard on the basis of industry norms (Nurfadillah, 2016). High debt
to equity ratio indicate that company not able to generate cash in order to meet operational
objectives. Lower ratio denote that interest are better which protect the business in decline phase
of market. Below mention calculation based on BMW Group which help the management to
analyse that how efficient they are in terms of debt & equity.
6
⊘ This is a preview!⊘
Do you want full access?
Subscribe today to unlock all pages.
Trusted by 1+ million students worldwide
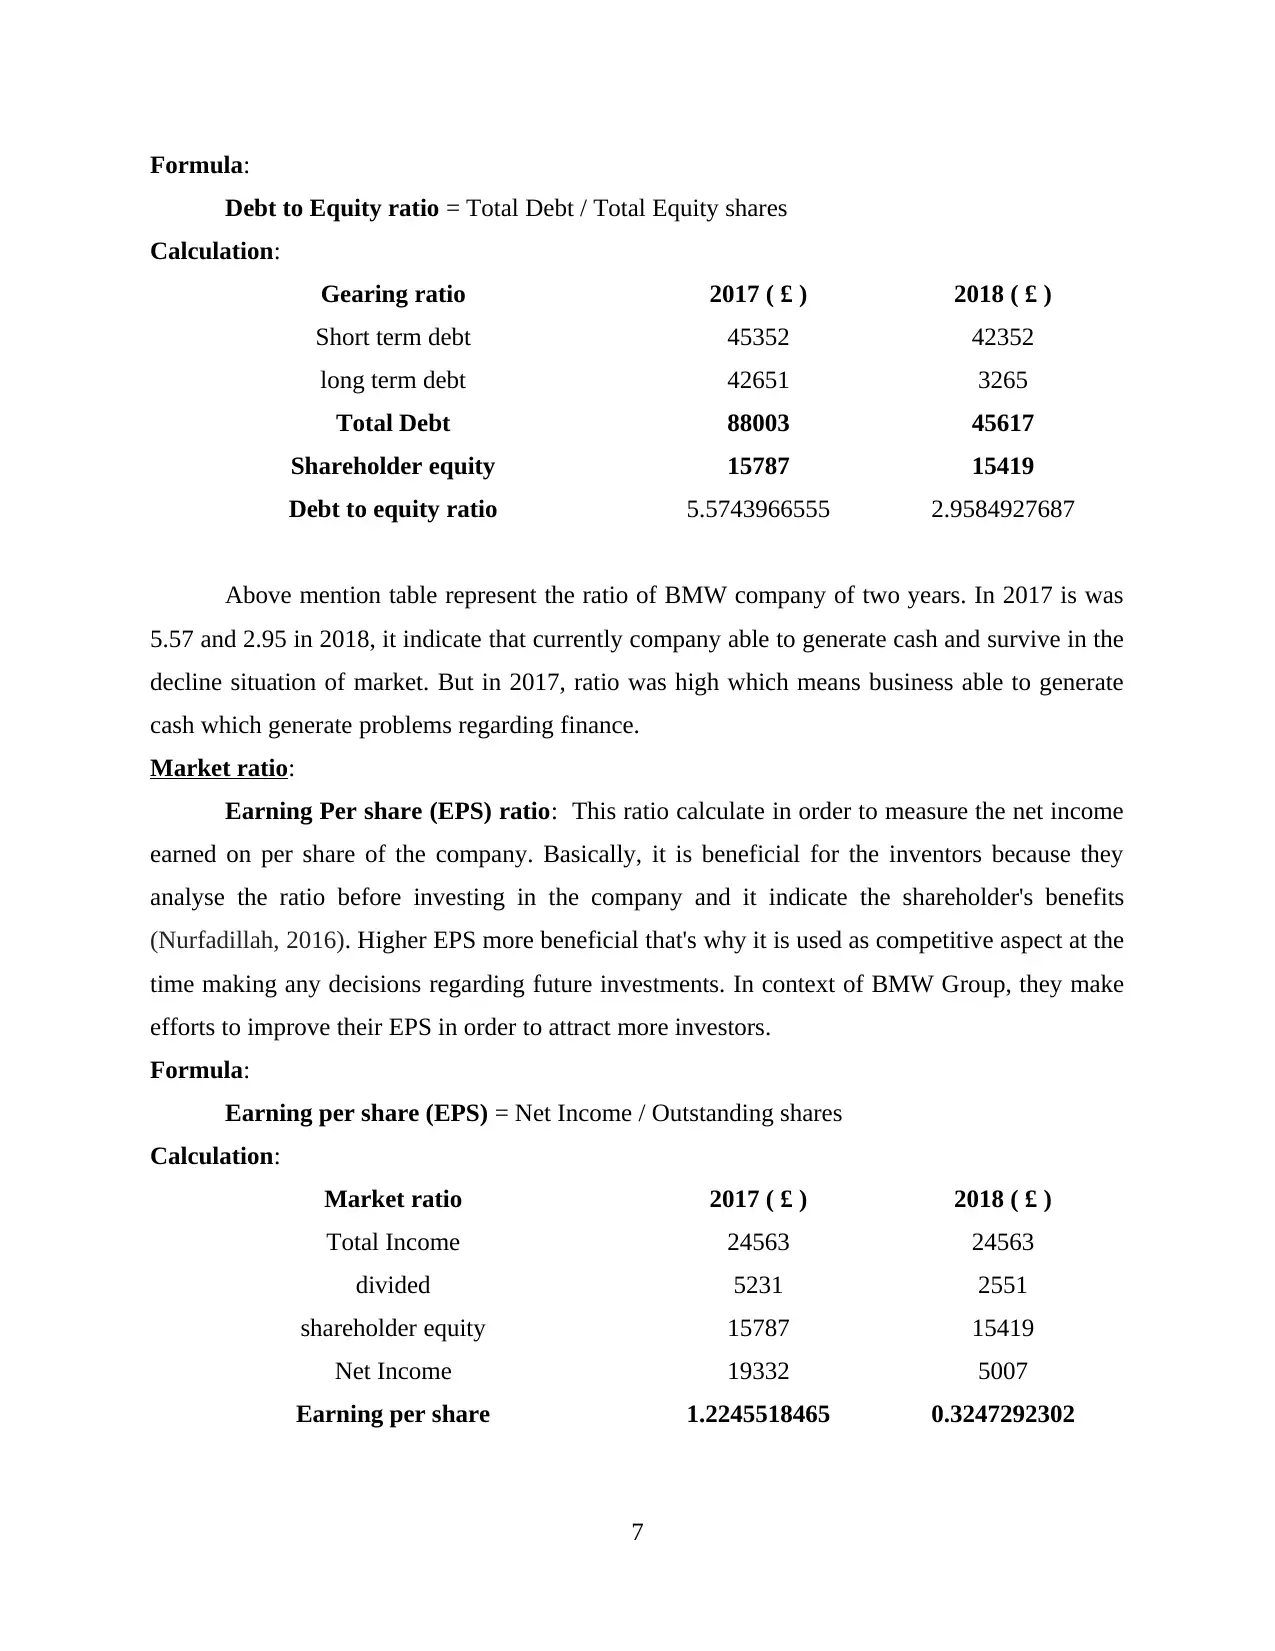
Formula:
Debt to Equity ratio = Total Debt / Total Equity shares
Calculation:
Gearing ratio 2017 ( £ ) 2018 ( £ )
Short term debt 45352 42352
long term debt 42651 3265
Total Debt 88003 45617
Shareholder equity 15787 15419
Debt to equity ratio 5.5743966555 2.9584927687
Above mention table represent the ratio of BMW company of two years. In 2017 is was
5.57 and 2.95 in 2018, it indicate that currently company able to generate cash and survive in the
decline situation of market. But in 2017, ratio was high which means business able to generate
cash which generate problems regarding finance.
Market ratio:
Earning Per share (EPS) ratio: This ratio calculate in order to measure the net income
earned on per share of the company. Basically, it is beneficial for the inventors because they
analyse the ratio before investing in the company and it indicate the shareholder's benefits
(Nurfadillah, 2016). Higher EPS more beneficial that's why it is used as competitive aspect at the
time making any decisions regarding future investments. In context of BMW Group, they make
efforts to improve their EPS in order to attract more investors.
Formula:
Earning per share (EPS) = Net Income / Outstanding shares
Calculation:
Market ratio 2017 ( £ ) 2018 ( £ )
Total Income 24563 24563
divided 5231 2551
shareholder equity 15787 15419
Net Income 19332 5007
Earning per share 1.2245518465 0.3247292302
7
Paraphrase This Document
Need a fresh take? Get an instant paraphrase of this document with our AI Paraphraser
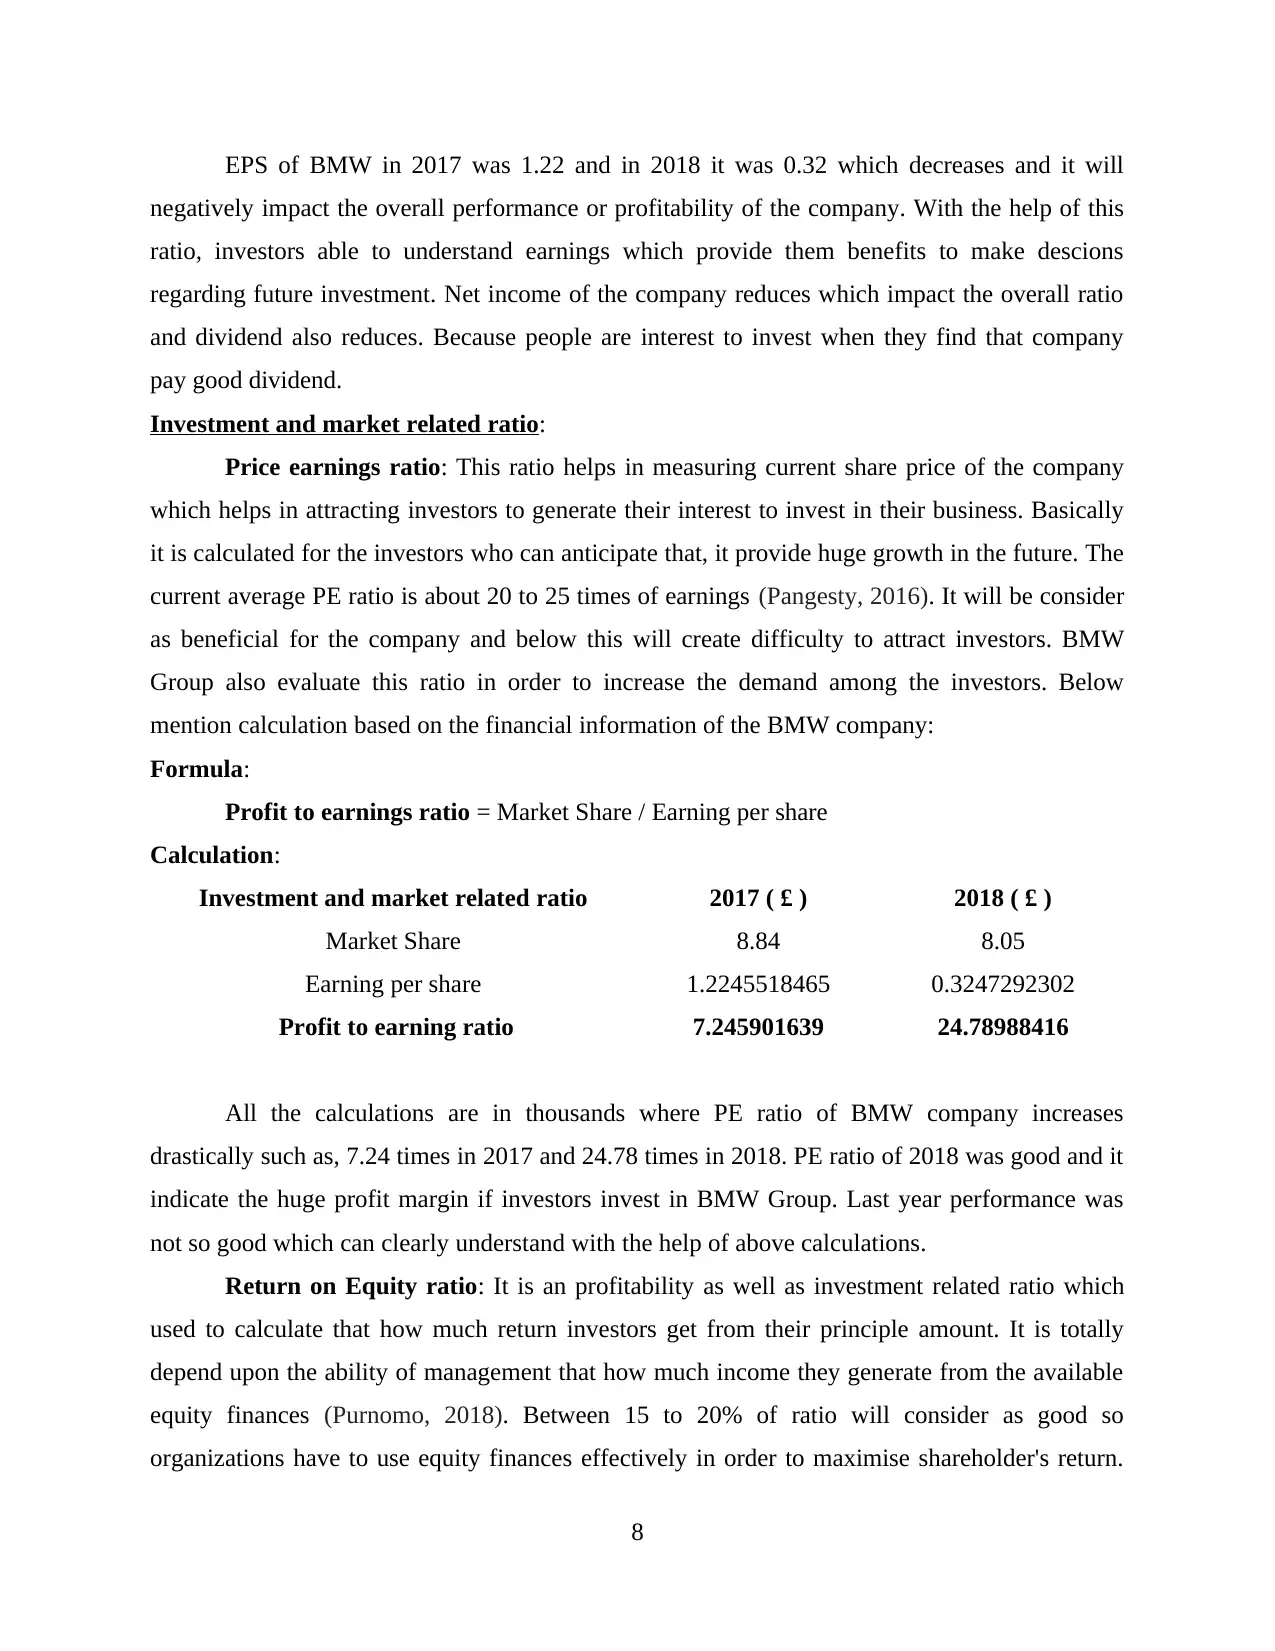
EPS of BMW in 2017 was 1.22 and in 2018 it was 0.32 which decreases and it will
negatively impact the overall performance or profitability of the company. With the help of this
ratio, investors able to understand earnings which provide them benefits to make descions
regarding future investment. Net income of the company reduces which impact the overall ratio
and dividend also reduces. Because people are interest to invest when they find that company
pay good dividend.
Investment and market related ratio:
Price earnings ratio: This ratio helps in measuring current share price of the company
which helps in attracting investors to generate their interest to invest in their business. Basically
it is calculated for the investors who can anticipate that, it provide huge growth in the future. The
current average PE ratio is about 20 to 25 times of earnings (Pangesty, 2016). It will be consider
as beneficial for the company and below this will create difficulty to attract investors. BMW
Group also evaluate this ratio in order to increase the demand among the investors. Below
mention calculation based on the financial information of the BMW company:
Formula:
Profit to earnings ratio = Market Share / Earning per share
Calculation:
Investment and market related ratio 2017 ( £ ) 2018 ( £ )
Market Share 8.84 8.05
Earning per share 1.2245518465 0.3247292302
Profit to earning ratio 7.245901639 24.78988416
All the calculations are in thousands where PE ratio of BMW company increases
drastically such as, 7.24 times in 2017 and 24.78 times in 2018. PE ratio of 2018 was good and it
indicate the huge profit margin if investors invest in BMW Group. Last year performance was
not so good which can clearly understand with the help of above calculations.
Return on Equity ratio: It is an profitability as well as investment related ratio which
used to calculate that how much return investors get from their principle amount. It is totally
depend upon the ability of management that how much income they generate from the available
equity finances (Purnomo, 2018). Between 15 to 20% of ratio will consider as good so
organizations have to use equity finances effectively in order to maximise shareholder's return.
8
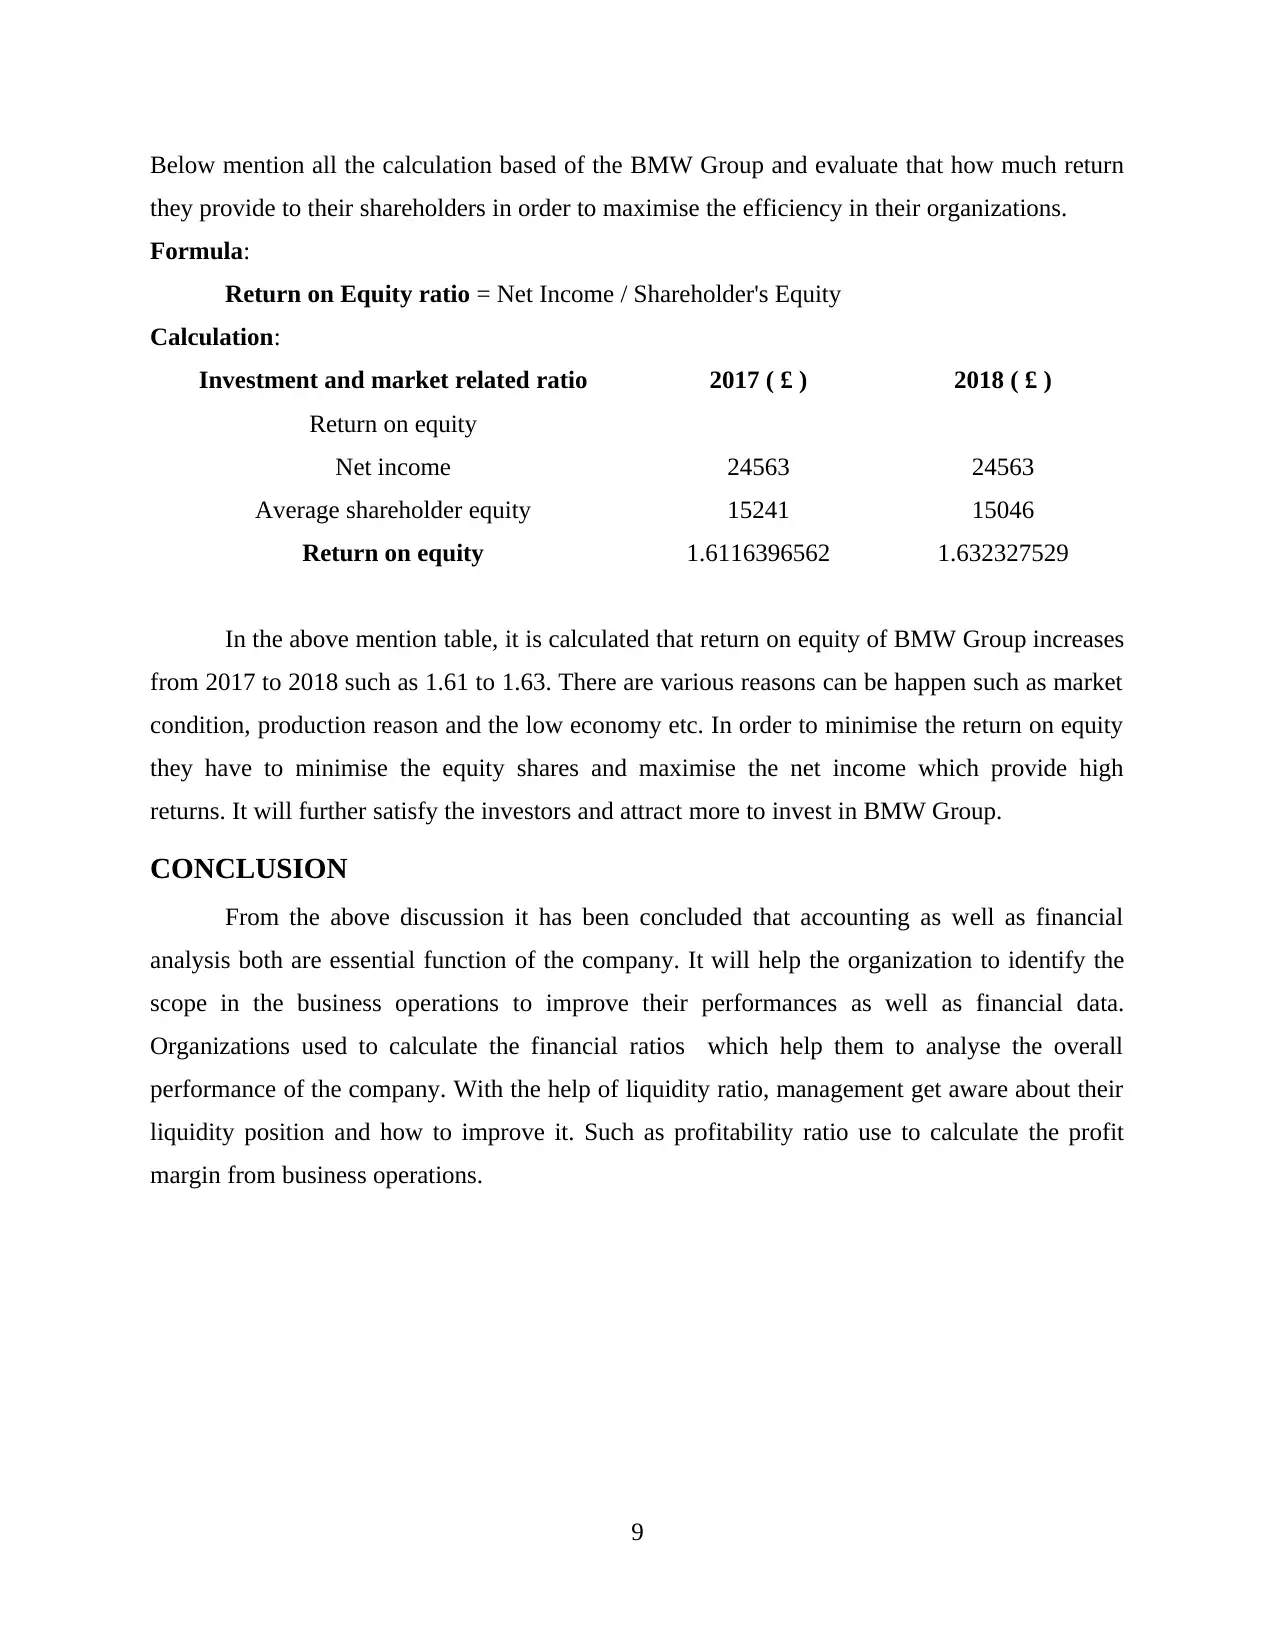
Below mention all the calculation based of the BMW Group and evaluate that how much return
they provide to their shareholders in order to maximise the efficiency in their organizations.
Formula:
Return on Equity ratio = Net Income / Shareholder's Equity
Calculation:
Investment and market related ratio 2017 ( £ ) 2018 ( £ )
Return on equity
Net income 24563 24563
Average shareholder equity 15241 15046
Return on equity 1.6116396562 1.632327529
In the above mention table, it is calculated that return on equity of BMW Group increases
from 2017 to 2018 such as 1.61 to 1.63. There are various reasons can be happen such as market
condition, production reason and the low economy etc. In order to minimise the return on equity
they have to minimise the equity shares and maximise the net income which provide high
returns. It will further satisfy the investors and attract more to invest in BMW Group.
CONCLUSION
From the above discussion it has been concluded that accounting as well as financial
analysis both are essential function of the company. It will help the organization to identify the
scope in the business operations to improve their performances as well as financial data.
Organizations used to calculate the financial ratios which help them to analyse the overall
performance of the company. With the help of liquidity ratio, management get aware about their
liquidity position and how to improve it. Such as profitability ratio use to calculate the profit
margin from business operations.
9
⊘ This is a preview!⊘
Do you want full access?
Subscribe today to unlock all pages.
Trusted by 1+ million students worldwide
1 out of 14
Related Documents


Your All-in-One AI-Powered Toolkit for Academic Success.
+13062052269
info@desklib.com
Available 24*7 on WhatsApp / Email
![[object Object]](/_next/static/media/star-bottom.7253800d.svg)
Unlock your academic potential
Copyright © 2020–2026 A2Z Services. All Rights Reserved. Developed and managed by ZUCOL.