Comparative Financial Analysis of Boohoo and ASOS for Investment
VerifiedAdded on 2023/06/15
|10
|2648
|193
Report
AI Summary
This report provides a comprehensive financial analysis of Boohoo and ASOS, focusing on their financial performance in 2021. It calculates and compares key financial ratios, including profitability ratios (gross profit ratio, net profit margin ratio, operating profit ratio, and return on equity), liquidity ratios (current ratio and quick ratio), gearing ratio (debt to equity), and investment ratios (earnings per share and price to earnings ratio). The analysis evaluates each company's ability to generate profit, manage short-term obligations, and provide returns to shareholders. The report concludes by assessing the investment potential of each company based on the ratio analysis, indicating which company presents a more favorable investment opportunity. Desklib provides a platform to access this and other solved assignments.
FINANCIAL REPORTING
Paraphrase This Document
Need a fresh take? Get an instant paraphrase of this document with our AI Paraphraser
TABLE OF CONTENTS
INTRODUCTION...........................................................................................................................1
MAIN BODY...................................................................................................................................1
Analysing the financial position of Boohoo & ASOS............................................................1
CONCLUSION................................................................................................................................6
REFERENCES................................................................................................................................8
INTRODUCTION
Financial reporting is concerned with having appropriate financial result of an
organization so that appropriate decision can be made. In the current era, significance of
financial results has inclined as awareness regarding sound decision is increased which require
firm to pay attention on making financial reporting. The current report is based on ascertaining
financial position and performance of Boohoo & ASOS. It will give emphasis on identifying the
best option for investment purpose.
Analysing the financial position of Boohoo & ASOS
Calculating the ratios of ASOS and Boohoo for the year 2021
Financial position of the company can be determined by paying attention on having
relevant calculation of ratios by assessing income and balance sheet (What is Financial
Reporting? 2021). The current report will focus on having significant evaluation of below
mentioned ratios in turn s crucial insights about prevailing financial health can be done.
Profitability ratios
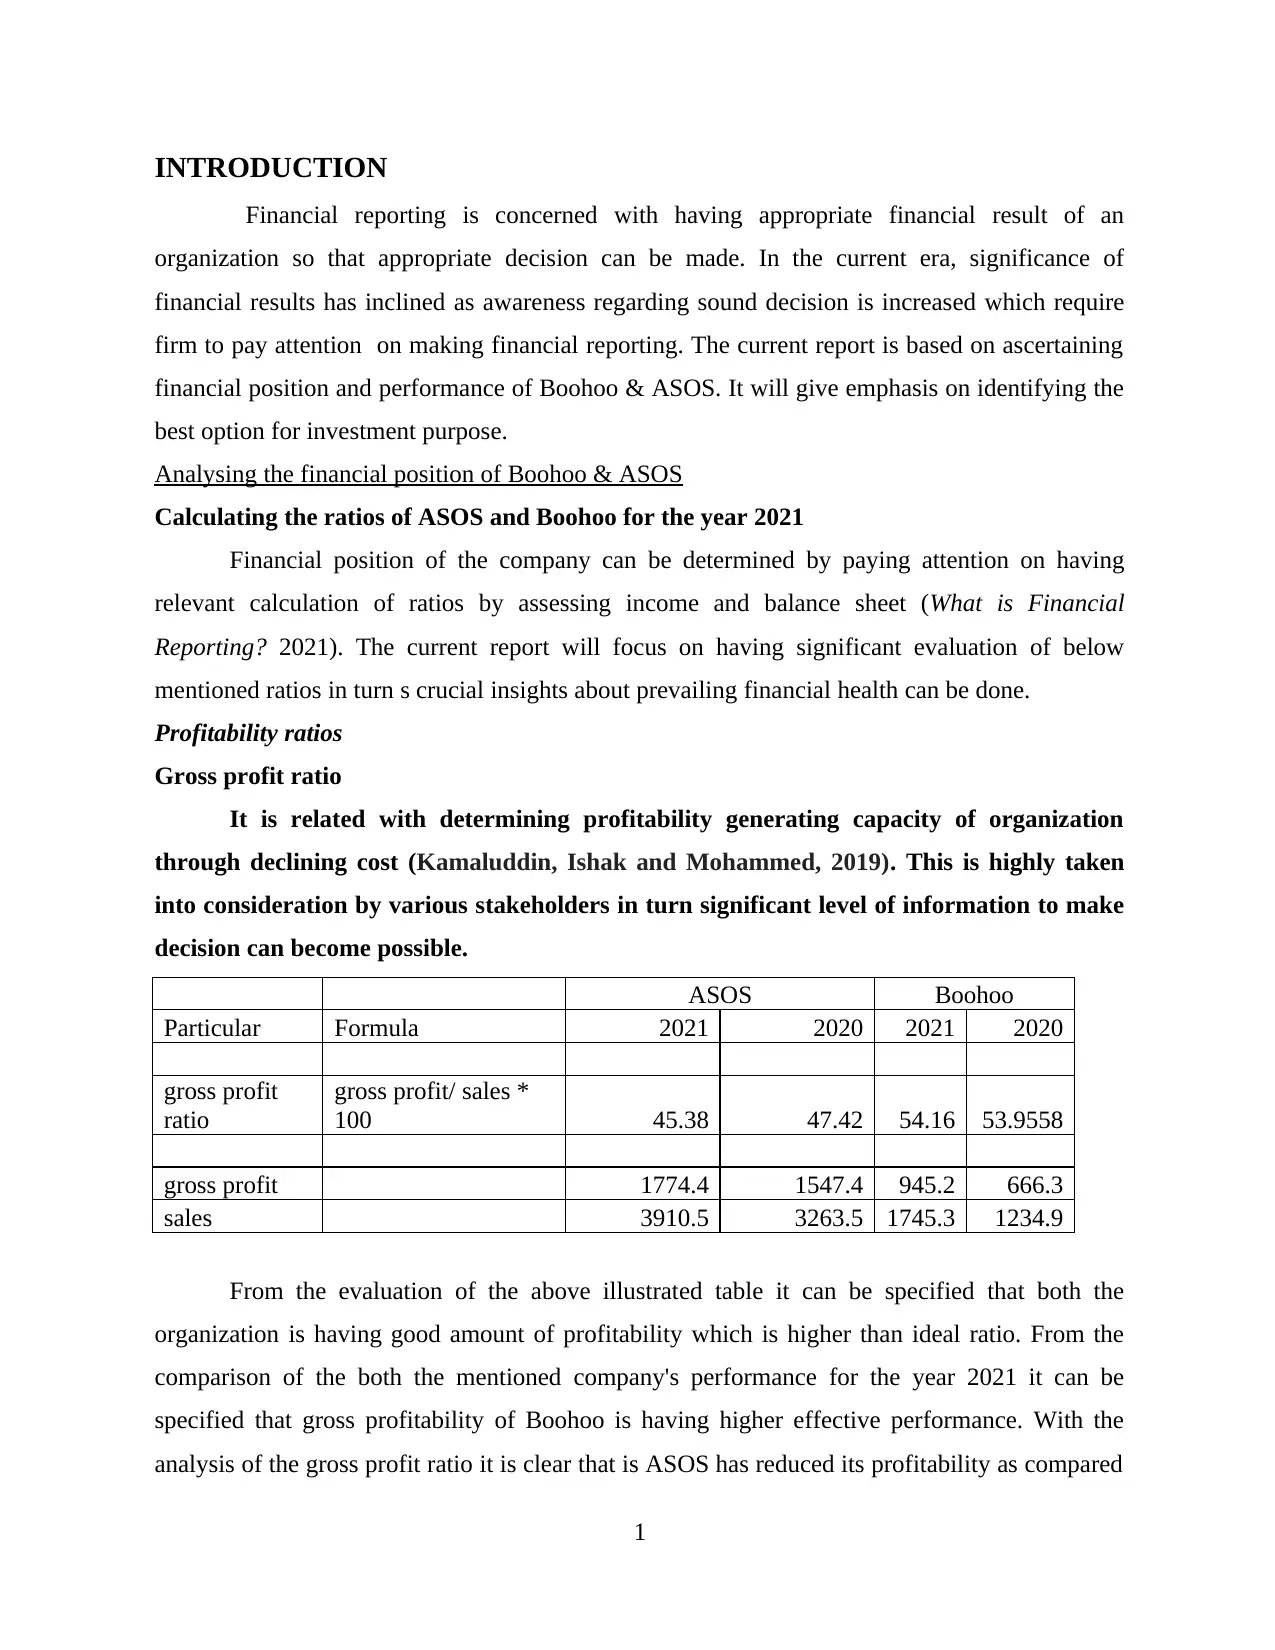
Gross profit ratio
It is related with determining profitability generating capacity of organization
through declining cost (Kamaluddin, Ishak and Mohammed, 2019). This is highly taken
into consideration by various stakeholders in turn significant level of information to make
decision can become possible.
ASOS Boohoo
Particular Formula 2021 2020 2021 2020
gross profit
ratio
gross profit/ sales *
100 45.38 47.42 54.16 53.9558
gross profit 1774.4 1547.4 945.2 666.3
sales 3910.5 3263.5 1745.3 1234.9
From the evaluation of the above illustrated table it can be specified that both the
organization is having good amount of profitability which is higher than ideal ratio. From the
comparison of the both the mentioned company's performance for the year 2021 it can be
specified that gross profitability of Boohoo is having higher effective performance. With the
analysis of the gross profit ratio it is clear that is ASOS has reduced its profitability as compared
1
Financial reporting is concerned with having appropriate financial result of an
organization so that appropriate decision can be made. In the current era, significance of
financial results has inclined as awareness regarding sound decision is increased which require
firm to pay attention on making financial reporting. The current report is based on ascertaining
financial position and performance of Boohoo & ASOS. It will give emphasis on identifying the
best option for investment purpose.
Analysing the financial position of Boohoo & ASOS
Calculating the ratios of ASOS and Boohoo for the year 2021
Financial position of the company can be determined by paying attention on having
relevant calculation of ratios by assessing income and balance sheet (What is Financial
Reporting? 2021). The current report will focus on having significant evaluation of below
mentioned ratios in turn s crucial insights about prevailing financial health can be done.
Profitability ratios
Gross profit ratio
It is related with determining profitability generating capacity of organization
through declining cost (Kamaluddin, Ishak and Mohammed, 2019). This is highly taken
into consideration by various stakeholders in turn significant level of information to make
decision can become possible.
ASOS Boohoo
Particular Formula 2021 2020 2021 2020
gross profit
ratio
gross profit/ sales *
100 45.38 47.42 54.16 53.9558
gross profit 1774.4 1547.4 945.2 666.3
sales 3910.5 3263.5 1745.3 1234.9
From the evaluation of the above illustrated table it can be specified that both the
organization is having good amount of profitability which is higher than ideal ratio. From the
comparison of the both the mentioned company's performance for the year 2021 it can be
specified that gross profitability of Boohoo is having higher effective performance. With the
analysis of the gross profit ratio it is clear that is ASOS has reduced its profitability as compared
1
⊘ This is a preview!⊘
Do you want full access?
Subscribe today to unlock all pages.
Trusted by 1+ million students worldwide
to last year where is Boohoo has increased its profitability. This implies that investment within
Boohoo will be more beneficial to the investor's for generating good Returns. In the year 2020
the performance of ASOS was more and Boohoo was less in 2020 and it increased in the year
2021.
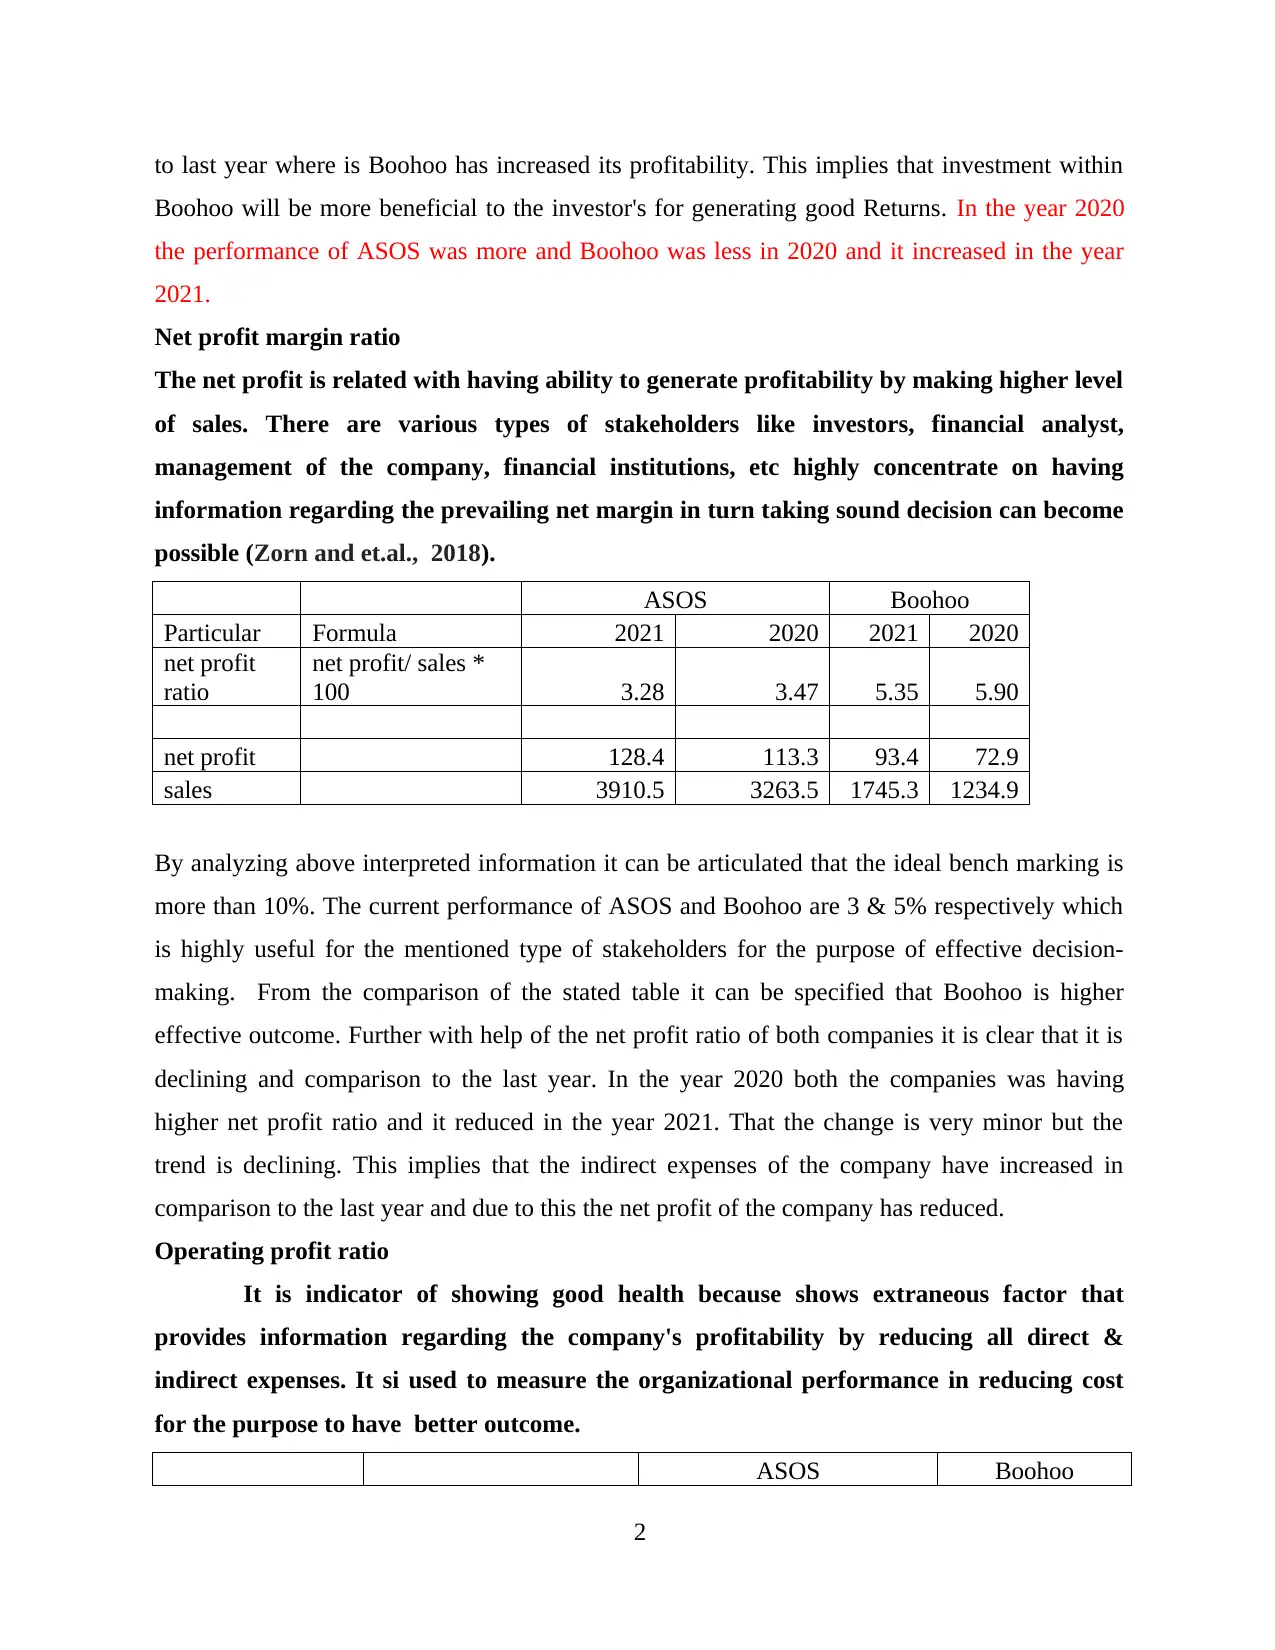
Net profit margin ratio
The net profit is related with having ability to generate profitability by making higher level
of sales. There are various types of stakeholders like investors, financial analyst,
management of the company, financial institutions, etc highly concentrate on having
information regarding the prevailing net margin in turn taking sound decision can become
possible (Zorn and et.al., 2018).
ASOS Boohoo
Particular Formula 2021 2020 2021 2020
net profit
ratio
net profit/ sales *
100 3.28 3.47 5.35 5.90
net profit 128.4 113.3 93.4 72.9
sales 3910.5 3263.5 1745.3 1234.9
By analyzing above interpreted information it can be articulated that the ideal bench marking is
more than 10%. The current performance of ASOS and Boohoo are 3 & 5% respectively which
is highly useful for the mentioned type of stakeholders for the purpose of effective decision-
making. From the comparison of the stated table it can be specified that Boohoo is higher
effective outcome. Further with help of the net profit ratio of both companies it is clear that it is
declining and comparison to the last year. In the year 2020 both the companies was having
higher net profit ratio and it reduced in the year 2021. That the change is very minor but the
trend is declining. This implies that the indirect expenses of the company have increased in
comparison to the last year and due to this the net profit of the company has reduced.
Operating profit ratio
It is indicator of showing good health because shows extraneous factor that
provides information regarding the company's profitability by reducing all direct &
indirect expenses. It si used to measure the organizational performance in reducing cost
for the purpose to have better outcome.
ASOS Boohoo
2
Boohoo will be more beneficial to the investor's for generating good Returns. In the year 2020
the performance of ASOS was more and Boohoo was less in 2020 and it increased in the year
2021.
Net profit margin ratio
The net profit is related with having ability to generate profitability by making higher level
of sales. There are various types of stakeholders like investors, financial analyst,
management of the company, financial institutions, etc highly concentrate on having
information regarding the prevailing net margin in turn taking sound decision can become
possible (Zorn and et.al., 2018).
ASOS Boohoo
Particular Formula 2021 2020 2021 2020
net profit
ratio
net profit/ sales *
100 3.28 3.47 5.35 5.90
net profit 128.4 113.3 93.4 72.9
sales 3910.5 3263.5 1745.3 1234.9
By analyzing above interpreted information it can be articulated that the ideal bench marking is
more than 10%. The current performance of ASOS and Boohoo are 3 & 5% respectively which
is highly useful for the mentioned type of stakeholders for the purpose of effective decision-
making. From the comparison of the stated table it can be specified that Boohoo is higher
effective outcome. Further with help of the net profit ratio of both companies it is clear that it is
declining and comparison to the last year. In the year 2020 both the companies was having
higher net profit ratio and it reduced in the year 2021. That the change is very minor but the
trend is declining. This implies that the indirect expenses of the company have increased in
comparison to the last year and due to this the net profit of the company has reduced.
Operating profit ratio
It is indicator of showing good health because shows extraneous factor that
provides information regarding the company's profitability by reducing all direct &
indirect expenses. It si used to measure the organizational performance in reducing cost
for the purpose to have better outcome.
ASOS Boohoo
2
Paraphrase This Document
Need a fresh take? Get an instant paraphrase of this document with our AI Paraphraser
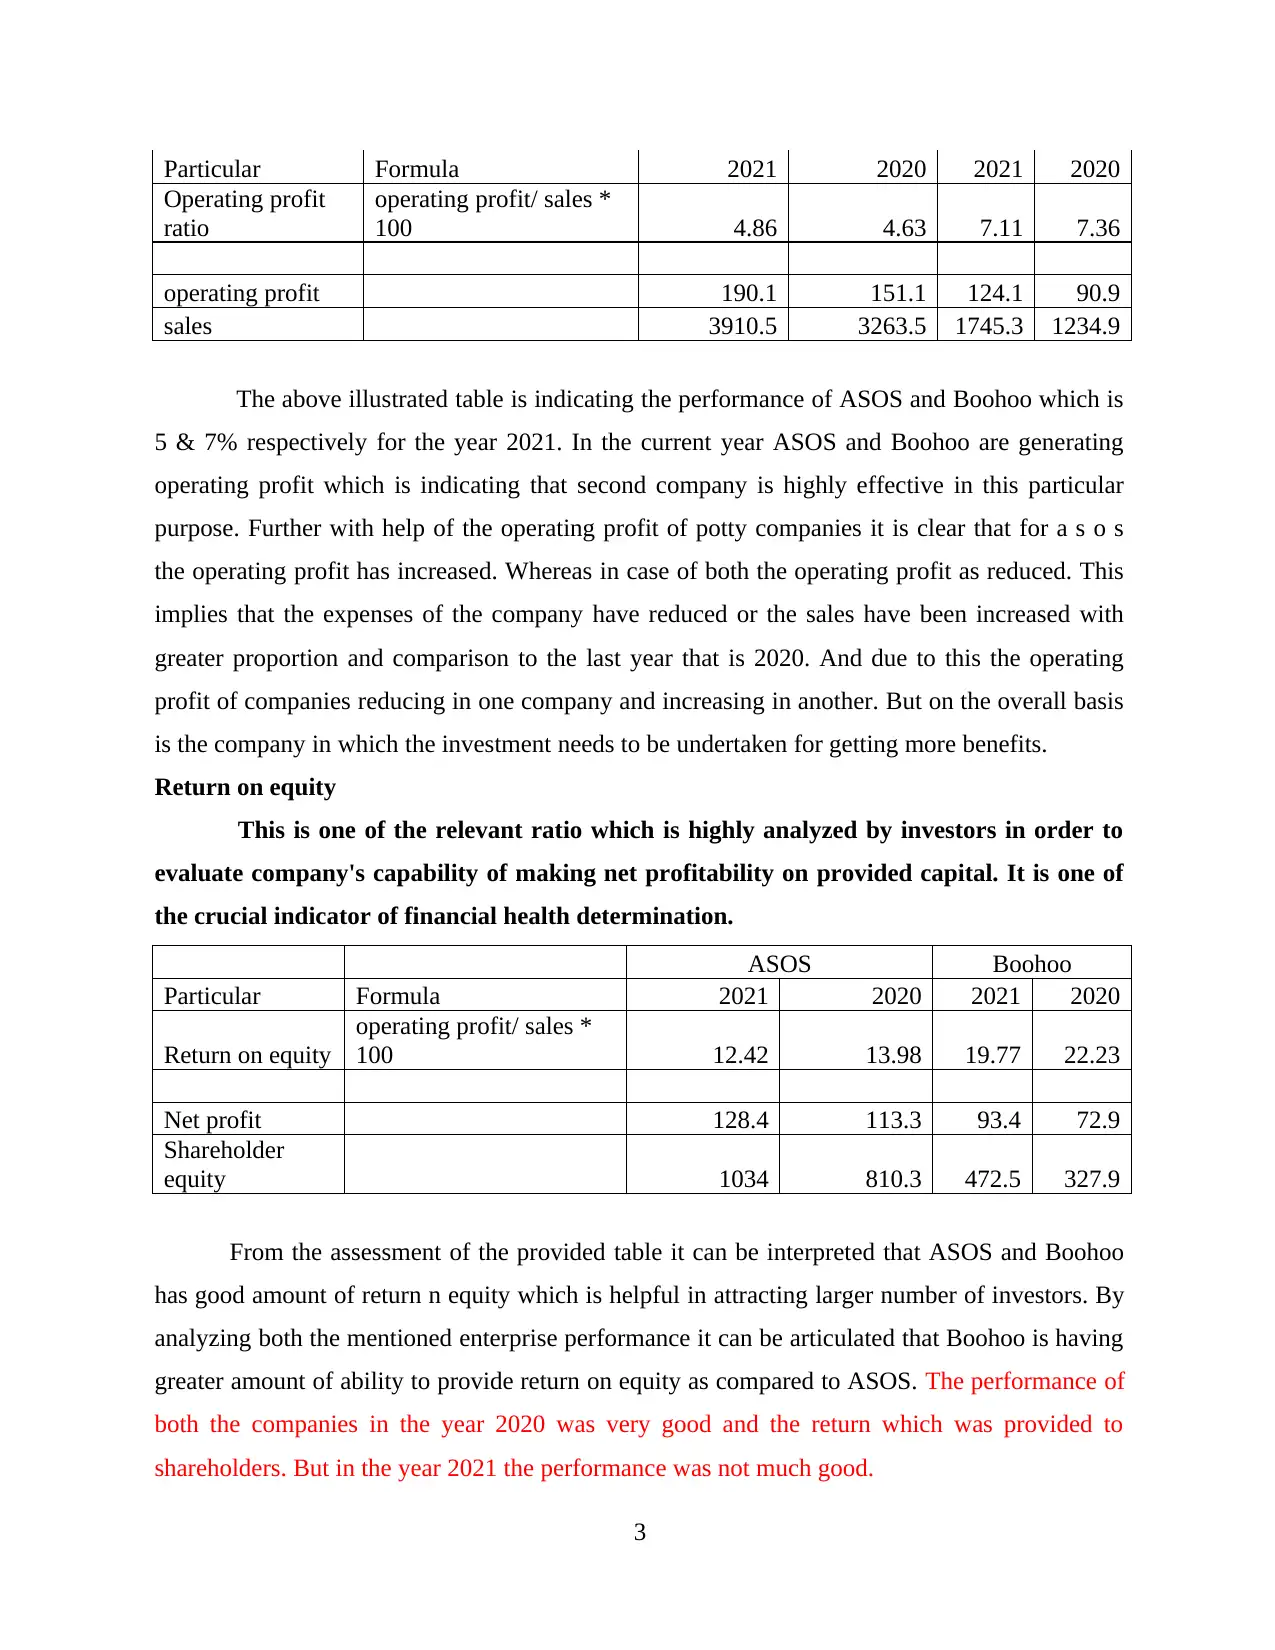
Particular Formula 2021 2020 2021 2020
Operating profit
ratio
operating profit/ sales *
100 4.86 4.63 7.11 7.36
operating profit 190.1 151.1 124.1 90.9
sales 3910.5 3263.5 1745.3 1234.9
The above illustrated table is indicating the performance of ASOS and Boohoo which is
5 & 7% respectively for the year 2021. In the current year ASOS and Boohoo are generating
operating profit which is indicating that second company is highly effective in this particular
purpose. Further with help of the operating profit of potty companies it is clear that for a s o s
the operating profit has increased. Whereas in case of both the operating profit as reduced. This
implies that the expenses of the company have reduced or the sales have been increased with
greater proportion and comparison to the last year that is 2020. And due to this the operating
profit of companies reducing in one company and increasing in another. But on the overall basis
is the company in which the investment needs to be undertaken for getting more benefits.
Return on equity
This is one of the relevant ratio which is highly analyzed by investors in order to
evaluate company's capability of making net profitability on provided capital. It is one of
the crucial indicator of financial health determination.
ASOS Boohoo
Particular Formula 2021 2020 2021 2020
Return on equity
operating profit/ sales *
100 12.42 13.98 19.77 22.23
Net profit 128.4 113.3 93.4 72.9
Shareholder
equity 1034 810.3 472.5 327.9
From the assessment of the provided table it can be interpreted that ASOS and Boohoo
has good amount of return n equity which is helpful in attracting larger number of investors. By
analyzing both the mentioned enterprise performance it can be articulated that Boohoo is having
greater amount of ability to provide return on equity as compared to ASOS. The performance of
both the companies in the year 2020 was very good and the return which was provided to
shareholders. But in the year 2021 the performance was not much good.
3
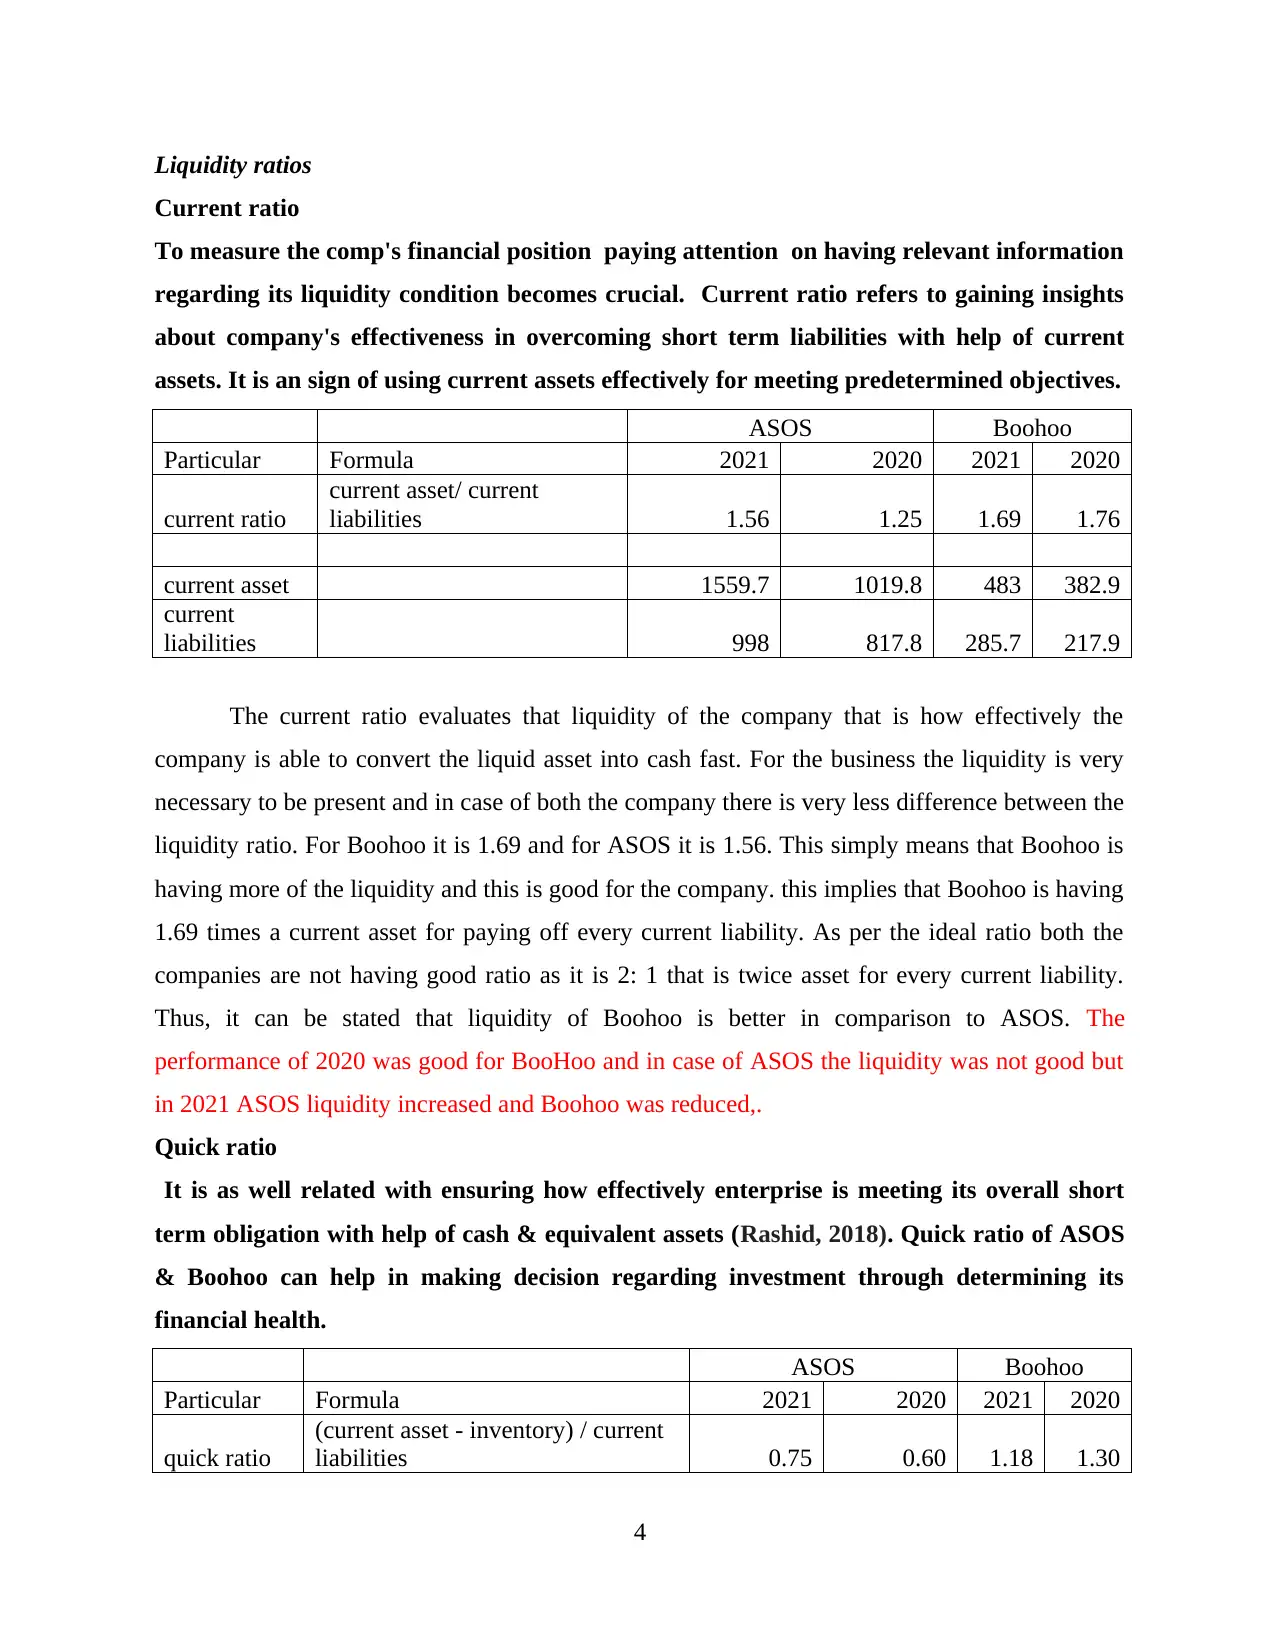
Liquidity ratios
Current ratio
To measure the comp's financial position paying attention on having relevant information
regarding its liquidity condition becomes crucial. Current ratio refers to gaining insights
about company's effectiveness in overcoming short term liabilities with help of current
assets. It is an sign of using current assets effectively for meeting predetermined objectives.
ASOS Boohoo
Particular Formula 2021 2020 2021 2020
current ratio
current asset/ current
liabilities 1.56 1.25 1.69 1.76
current asset 1559.7 1019.8 483 382.9
current
liabilities 998 817.8 285.7 217.9
The current ratio evaluates that liquidity of the company that is how effectively the
company is able to convert the liquid asset into cash fast. For the business the liquidity is very
necessary to be present and in case of both the company there is very less difference between the
liquidity ratio. For Boohoo it is 1.69 and for ASOS it is 1.56. This simply means that Boohoo is
having more of the liquidity and this is good for the company. this implies that Boohoo is having
1.69 times a current asset for paying off every current liability. As per the ideal ratio both the
companies are not having good ratio as it is 2: 1 that is twice asset for every current liability.
Thus, it can be stated that liquidity of Boohoo is better in comparison to ASOS. The
performance of 2020 was good for BooHoo and in case of ASOS the liquidity was not good but
in 2021 ASOS liquidity increased and Boohoo was reduced,.
Quick ratio
It is as well related with ensuring how effectively enterprise is meeting its overall short
term obligation with help of cash & equivalent assets (Rashid, 2018). Quick ratio of ASOS
& Boohoo can help in making decision regarding investment through determining its
financial health.
ASOS Boohoo
Particular Formula 2021 2020 2021 2020
quick ratio
(current asset - inventory) / current
liabilities 0.75 0.60 1.18 1.30
4
⊘ This is a preview!⊘
Do you want full access?
Subscribe today to unlock all pages.
Trusted by 1+ million students worldwide
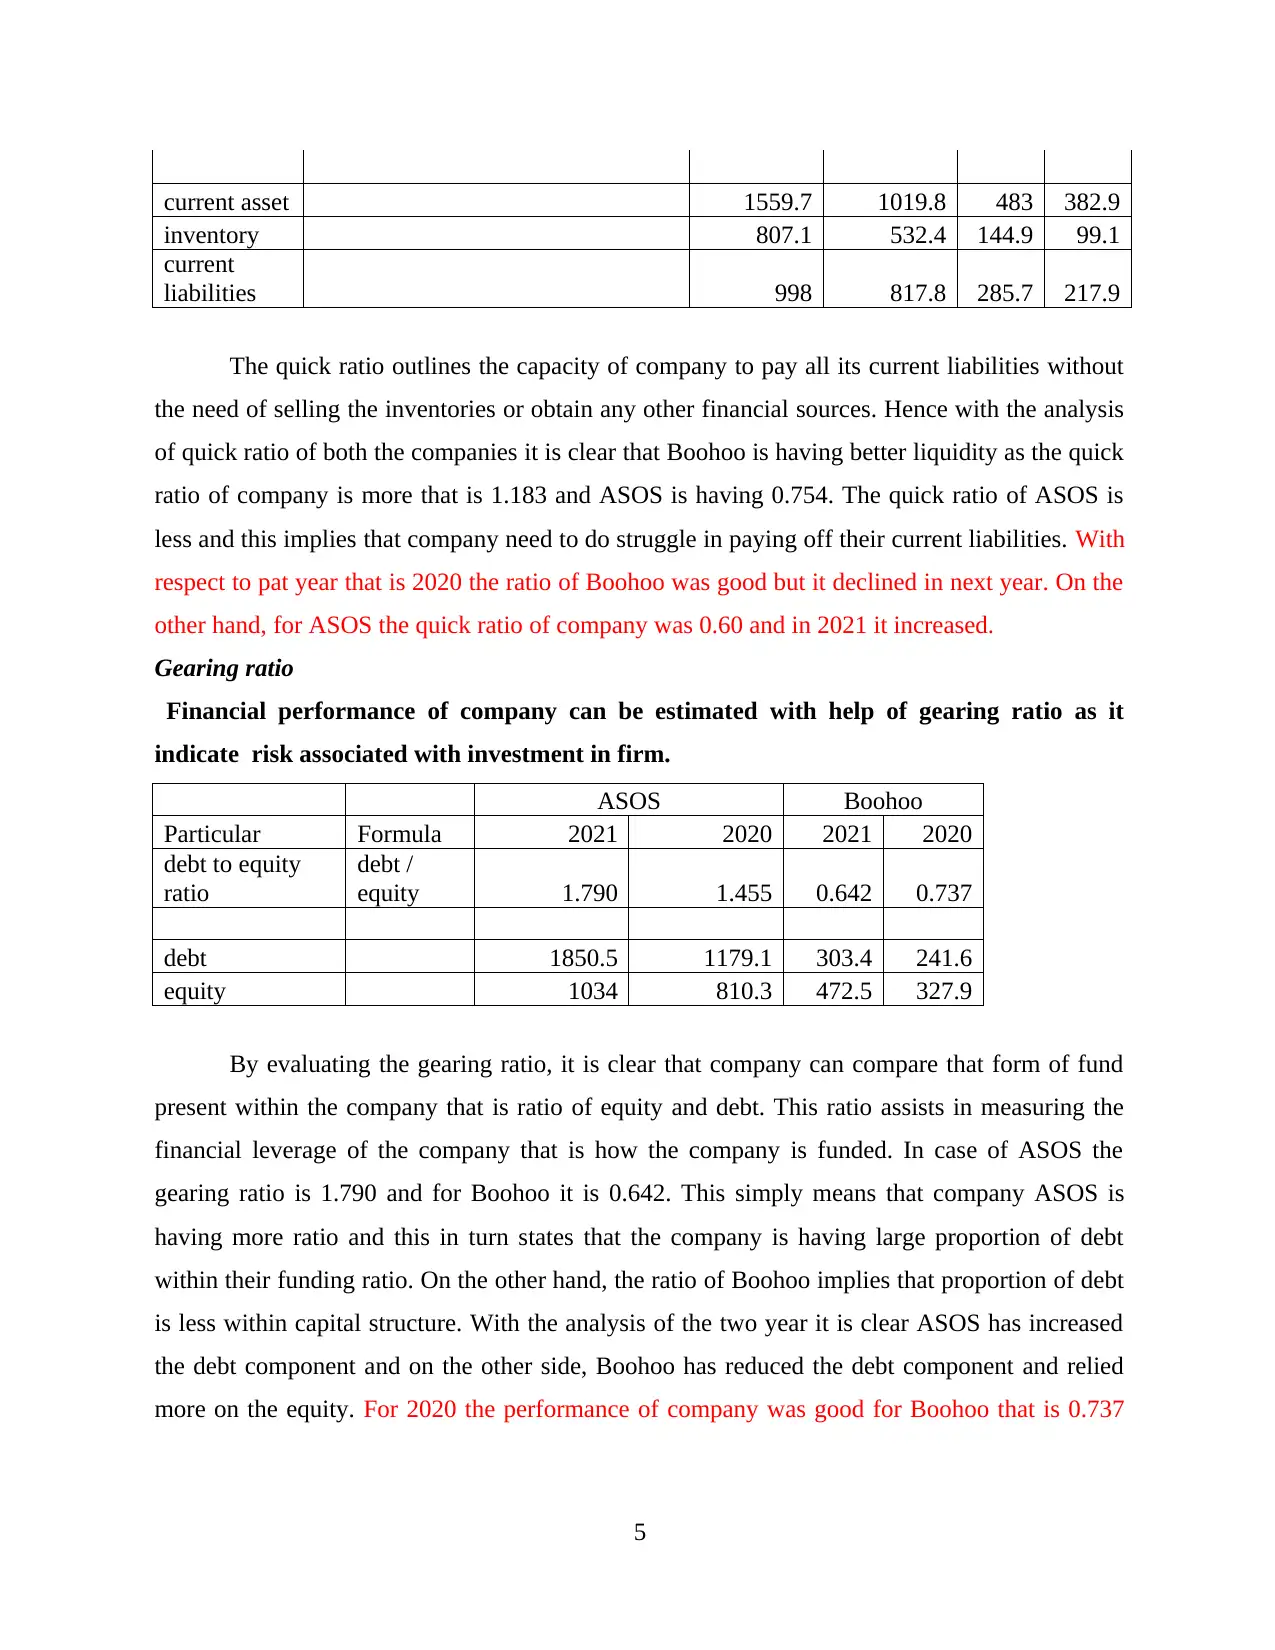
current asset 1559.7 1019.8 483 382.9
inventory 807.1 532.4 144.9 99.1
current
liabilities 998 817.8 285.7 217.9
The quick ratio outlines the capacity of company to pay all its current liabilities without
the need of selling the inventories or obtain any other financial sources. Hence with the analysis
of quick ratio of both the companies it is clear that Boohoo is having better liquidity as the quick
ratio of company is more that is 1.183 and ASOS is having 0.754. The quick ratio of ASOS is
less and this implies that company need to do struggle in paying off their current liabilities. With
respect to pat year that is 2020 the ratio of Boohoo was good but it declined in next year. On the
other hand, for ASOS the quick ratio of company was 0.60 and in 2021 it increased.
Gearing ratio
Financial performance of company can be estimated with help of gearing ratio as it
indicate risk associated with investment in firm.
ASOS Boohoo
Particular Formula 2021 2020 2021 2020
debt to equity
ratio
debt /
equity 1.790 1.455 0.642 0.737
debt 1850.5 1179.1 303.4 241.6
equity 1034 810.3 472.5 327.9
By evaluating the gearing ratio, it is clear that company can compare that form of fund
present within the company that is ratio of equity and debt. This ratio assists in measuring the
financial leverage of the company that is how the company is funded. In case of ASOS the
gearing ratio is 1.790 and for Boohoo it is 0.642. This simply means that company ASOS is
having more ratio and this in turn states that the company is having large proportion of debt
within their funding ratio. On the other hand, the ratio of Boohoo implies that proportion of debt
is less within capital structure. With the analysis of the two year it is clear ASOS has increased
the debt component and on the other side, Boohoo has reduced the debt component and relied
more on the equity. For 2020 the performance of company was good for Boohoo that is 0.737
5
Paraphrase This Document
Need a fresh take? Get an instant paraphrase of this document with our AI Paraphraser
but it declined in 0.642. On the other hand, ASOS the performance of 2020 was not good but in
2021 it increased.
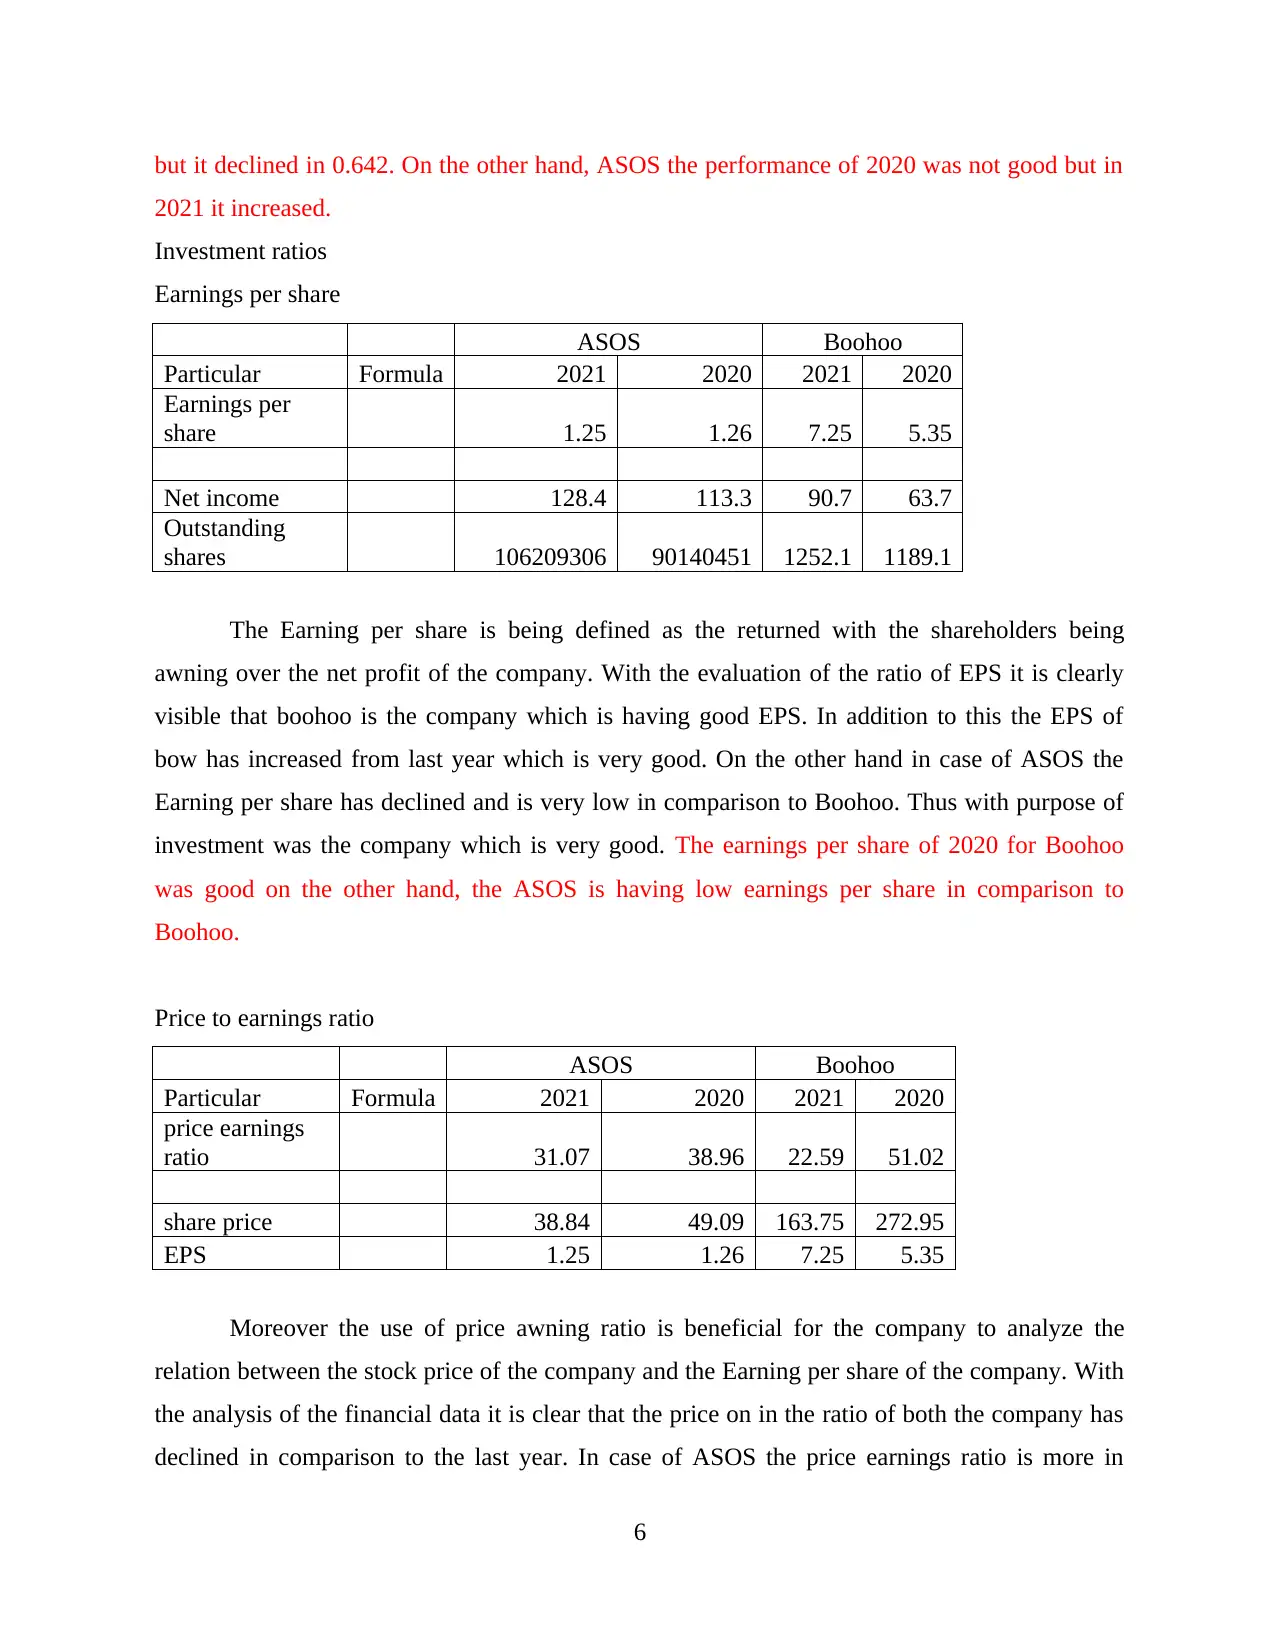
Investment ratios
Earnings per share
ASOS Boohoo
Particular Formula 2021 2020 2021 2020
Earnings per
share 1.25 1.26 7.25 5.35
Net income 128.4 113.3 90.7 63.7
Outstanding
shares 106209306 90140451 1252.1 1189.1
The Earning per share is being defined as the returned with the shareholders being
awning over the net profit of the company. With the evaluation of the ratio of EPS it is clearly
visible that boohoo is the company which is having good EPS. In addition to this the EPS of
bow has increased from last year which is very good. On the other hand in case of ASOS the
Earning per share has declined and is very low in comparison to Boohoo. Thus with purpose of
investment was the company which is very good. The earnings per share of 2020 for Boohoo
was good on the other hand, the ASOS is having low earnings per share in comparison to
Boohoo.
Price to earnings ratio
ASOS Boohoo
Particular Formula 2021 2020 2021 2020
price earnings
ratio 31.07 38.96 22.59 51.02
share price 38.84 49.09 163.75 272.95
EPS 1.25 1.26 7.25 5.35
Moreover the use of price awning ratio is beneficial for the company to analyze the
relation between the stock price of the company and the Earning per share of the company. With
the analysis of the financial data it is clear that the price on in the ratio of both the company has
declined in comparison to the last year. In case of ASOS the price earnings ratio is more in
6
2021 it increased.
Investment ratios
Earnings per share
ASOS Boohoo
Particular Formula 2021 2020 2021 2020
Earnings per
share 1.25 1.26 7.25 5.35
Net income 128.4 113.3 90.7 63.7
Outstanding
shares 106209306 90140451 1252.1 1189.1
The Earning per share is being defined as the returned with the shareholders being
awning over the net profit of the company. With the evaluation of the ratio of EPS it is clearly
visible that boohoo is the company which is having good EPS. In addition to this the EPS of
bow has increased from last year which is very good. On the other hand in case of ASOS the
Earning per share has declined and is very low in comparison to Boohoo. Thus with purpose of
investment was the company which is very good. The earnings per share of 2020 for Boohoo
was good on the other hand, the ASOS is having low earnings per share in comparison to
Boohoo.
Price to earnings ratio
ASOS Boohoo
Particular Formula 2021 2020 2021 2020
price earnings
ratio 31.07 38.96 22.59 51.02
share price 38.84 49.09 163.75 272.95
EPS 1.25 1.26 7.25 5.35
Moreover the use of price awning ratio is beneficial for the company to analyze the
relation between the stock price of the company and the Earning per share of the company. With
the analysis of the financial data it is clear that the price on in the ratio of both the company has
declined in comparison to the last year. In case of ASOS the price earnings ratio is more in
6
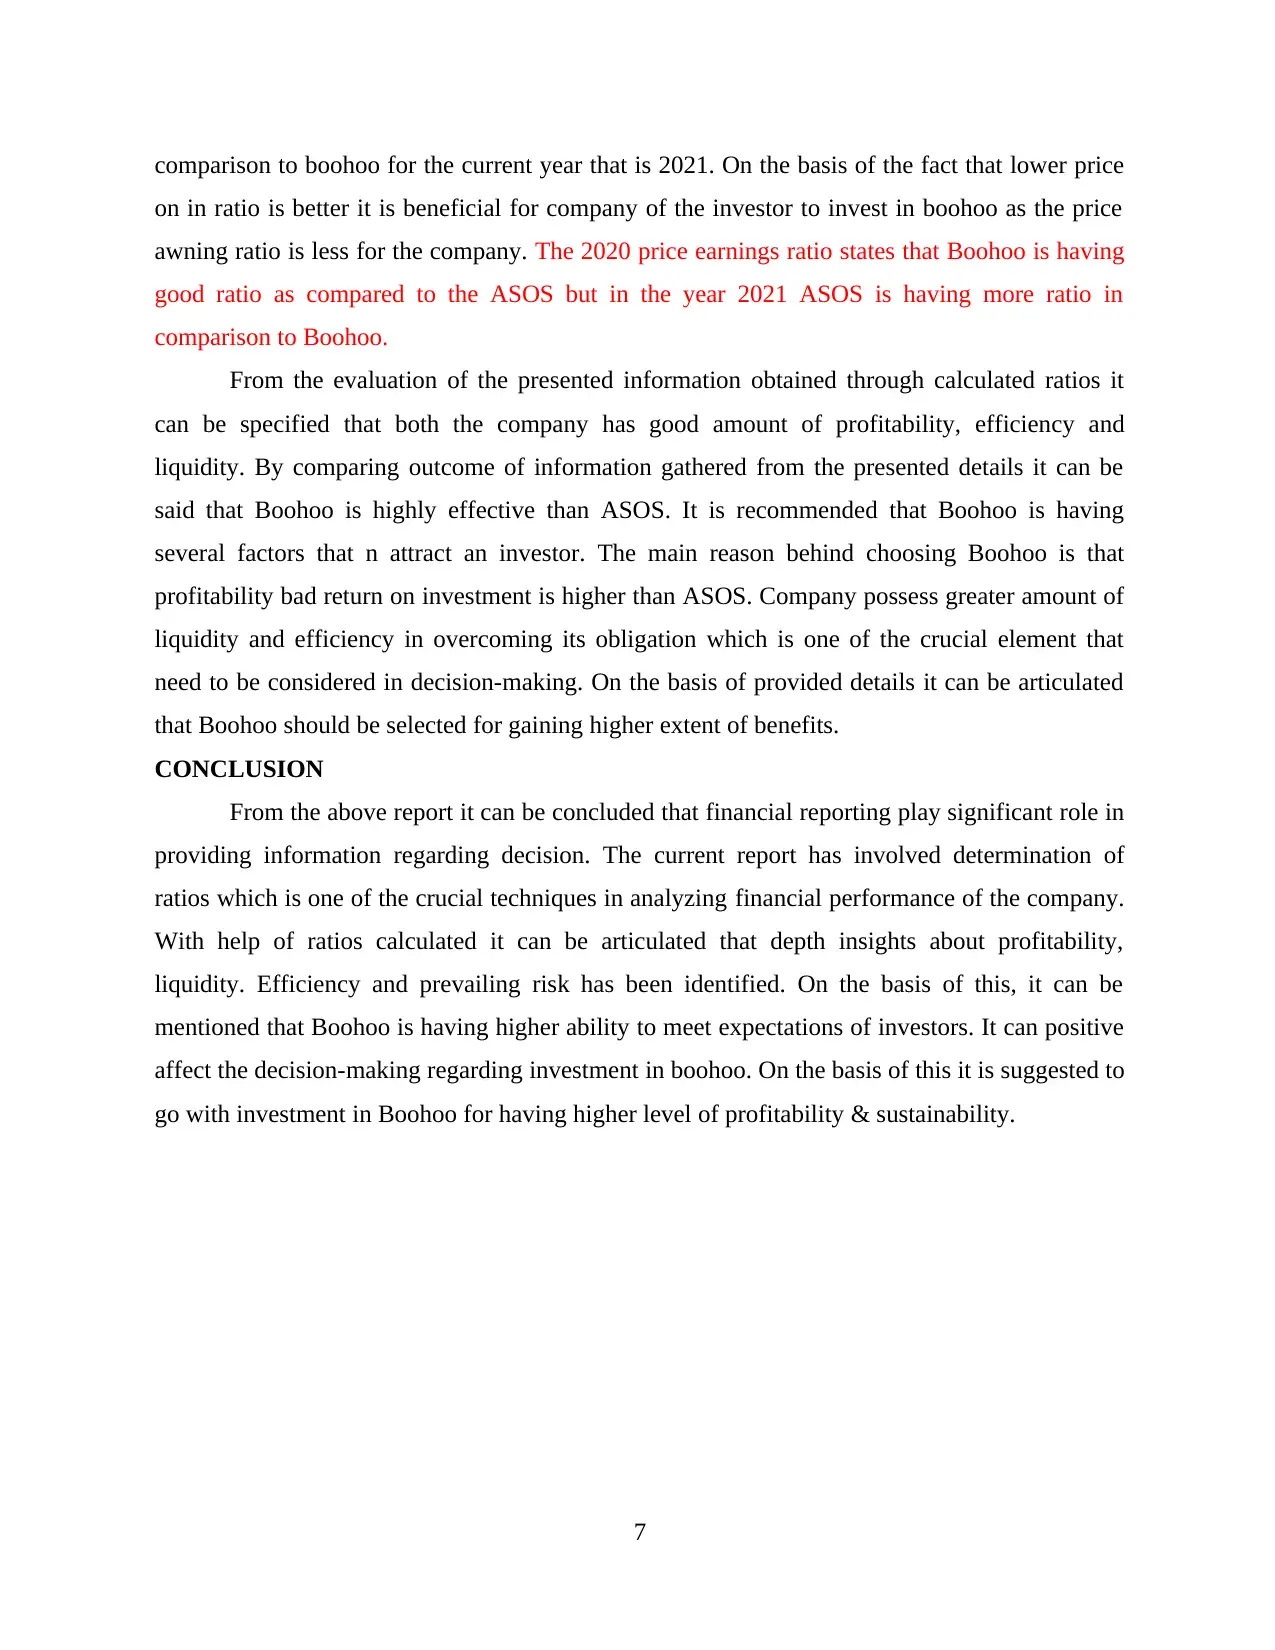
comparison to boohoo for the current year that is 2021. On the basis of the fact that lower price
on in ratio is better it is beneficial for company of the investor to invest in boohoo as the price
awning ratio is less for the company. The 2020 price earnings ratio states that Boohoo is having
good ratio as compared to the ASOS but in the year 2021 ASOS is having more ratio in
comparison to Boohoo.
From the evaluation of the presented information obtained through calculated ratios it
can be specified that both the company has good amount of profitability, efficiency and
liquidity. By comparing outcome of information gathered from the presented details it can be
said that Boohoo is highly effective than ASOS. It is recommended that Boohoo is having
several factors that n attract an investor. The main reason behind choosing Boohoo is that
profitability bad return on investment is higher than ASOS. Company possess greater amount of
liquidity and efficiency in overcoming its obligation which is one of the crucial element that
need to be considered in decision-making. On the basis of provided details it can be articulated
that Boohoo should be selected for gaining higher extent of benefits.
CONCLUSION
From the above report it can be concluded that financial reporting play significant role in
providing information regarding decision. The current report has involved determination of
ratios which is one of the crucial techniques in analyzing financial performance of the company.
With help of ratios calculated it can be articulated that depth insights about profitability,
liquidity. Efficiency and prevailing risk has been identified. On the basis of this, it can be
mentioned that Boohoo is having higher ability to meet expectations of investors. It can positive
affect the decision-making regarding investment in boohoo. On the basis of this it is suggested to
go with investment in Boohoo for having higher level of profitability & sustainability.
7
⊘ This is a preview!⊘
Do you want full access?
Subscribe today to unlock all pages.
Trusted by 1+ million students worldwide
REFERENCES
Books and Journals
Alarussi, A. S. A., 2021. Financial ratios and efficiency in Malaysian listed companies. Asian
Journal of Economics and Banking.
Kamaluddin, A., Ishak, N. and Mohammed, N. F., 2019. Financial distress prediction through
cash flow ratios analysis. International Journal of Financial Research.10(3). pp.63-76.
Myšková, R. and Hájek, P., 2017. Comprehensive assessment of firm financial performance
using financial ratios and linguistic analysis of annual reports. Journal of International
Studies, volume 10, issue: 4.
Rashid, C. A., 2018. Efficiency of financial ratios analysis for evaluating companies’
liquidity. International Journal of Social Sciences & Educational Studies. 4(4). p.110.
Zorn, A. and et.al., 2018. Financial ratios as indicators of economic sustainability: A
quantitative analysis for Swiss dairy farms. Sustainability. 10(8). p.2942.
Online
What is Financial Reporting?. 2021. [Online]. Available through:
<https://www.accountingtools.com/articles/what-is-financial-
reporting.html#:~:text=Financial%20reporting%20is%20the%20financial,its
%20stakeholders%20and%20the%20public.&text=Financial%20statements%2C
%20which%20include%20the,and%20statement%20of%20cash%20flows>.
What is the Inventory Turnover Ratio? 2021. [Online]. Available through:
<https://corporatefinanceinstitute.com/resources/knowledge/finance/inventory-turnover-
ratio/>
8
1 out of 10
Related Documents


Your All-in-One AI-Powered Toolkit for Academic Success.
+13062052269
info@desklib.com
Available 24*7 on WhatsApp / Email
![[object Object]](/_next/static/media/star-bottom.7253800d.svg)
Unlock your academic potential
Copyright © 2020–2026 A2Z Services. All Rights Reserved. Developed and managed by ZUCOL.