Strategic Financial Analysis and Comparison of Booker and Tate & Lyle
VerifiedAdded on 2023/05/28
|69
|13055
|110
Report
AI Summary
This report conducts a strategic financial analysis of Booker and Tate & Lyle using methods such as trend analysis, ratio analysis, and DuPont analysis. The analysis reveals that Booker's financial performance is generally better than Tate & Lyle's. However, the report recommends that both companies adopt contemporary methods like EVA, CAPM, and the efficient market hypothesis to enhance their financial evaluations and overcome the limitations of traditional methods. The report includes a detailed comparison of profitability, liquidity, and efficiency ratios, along with an assessment of the merits and demerits of each analytical method used. It also discusses the application of contemporary financial analysis models for improved strategic decision-making.
1
Strategic financial analysis
Strategic financial analysis
Paraphrase This Document
Need a fresh take? Get an instant paraphrase of this document with our AI Paraphraser
2
Executive Summary
The present report is developed for providing an insight into different methods of
strategic financial analysis adopted by business companies for financial evaluation. This has
been carried out by conducting strategic financial analysis of the two companies that are Booker
and Tata&Lyle. The financial analysis is carried out with the use of trend analysis, ratio and du-
Pont analysis that Booker financial performance is better than that if its competitor Tate&Lyle.
However, it is recommended to the financial managers of both the companies to adopt the use of
contemporary methods such as EVA, CAPM and efficient market hypothesis for conducting
financial analysis to overcome the drawbacks presents in the traditional methods.
3
Contents
Executive Summary.........................................................................................................................2
1.0: Introduction..............................................................................................................................4
2.0: Brief Introduction of Two Companies......................................................................................4
3.0: Financial Analysis Method.......................................................................................................5
3.1: Ratio Analysis...........................................................................................................................6
3.1.1: Profitability Ratio Analysis...................................................................................................6
3.1.2: Liquidity Analysis.................................................................................................................8
3.1.3: Efficiency Ratios.................................................................................................................10
3.1.4: Investors Analysis................................................................................................................12
3.2: Common Size Analysis..........................................................................................................14
3.2.1: Vertical – SOPL, SOFP and SOCF.....................................................................................14
3.2.2: Horizontal – SOPL, SOFP and SOCF.................................................................................17
3.3: Du-Pont Analysis of Booker for last five years......................................................................20
4.0: Merits and Demerits of each of analytical methods used to analyse the performance of
company.........................................................................................................................................22
4.1 Ratio Analysis..........................................................................................................................22
4.2 Trend Analysis (Horizontal &Vertical Analysis)....................................................................23
4.3: Du-Pont Analysis....................................................................................................................24
5. Contemporary Methods.............................................................................................................24
5.1 Capital Asset Pricing Model....................................................................................................24
5.2 Economic Value Added (EVA)...............................................................................................24
5.3 Efficient Market Hypothesis....................................................................................................25
6.0: Conclusion and Recommendation..........................................................................................25
7.0: References..............................................................................................................................26
8.0: Appendixes.............................................................................................................................28
⊘ This is a preview!⊘
Do you want full access?
Subscribe today to unlock all pages.
Trusted by 1+ million students worldwide
4
1.0: Introduction
The process of Strategic Financial Analysis (SFA) can be described as the task of
preparing the financial plan for development of business goals and objectives to be achieved.
The financial plan is developed for determining the ways that a business can adopt for achieving
its strategic goals and objectives. It can be regarded as a value-creating framework that helps
senior executives to examine the business strategy, evaluate its performance and thereby valuing
the business. The financial analysis is regarded to be very important for businesses to undertaken
an overview of the financial position of a company that can assist in its future financial planning
process. The financial management decisions help a company to make important investment
decisions regarding its future growth and development. The financial analysis enables a company
to develop adequate financial strategy that results in maximization of shareholder value. The
financial strategy developed though conducting financial evaluation helps a company to gain an
insight into the financial resources possessed for achieving its strategic goals and objectives
(Ehrhardt and Brigham, 2016).
The main objective of the report is to conduct a critical assessment of the principal
method used for analyzing the financial position of a company as an outsider. The method of
financial analysis includes calculation of financial ratios, vertical and horizontal and DuPont
analysis. Also, it intends to present the major drawbacks that re present within the financial
analysis methods and proposed more effective methods that can be sued for overcoming these
drawbacks. The overall financial analysis is carried out by presenting working examples from the
selected listed companies that are Booker Group PLC & Tate &Lyre PLC.
2.0: Brief Introduction of Two Companies
Booker Group PLC is recognized as the largest food wholesale operator within the UK
that is involved in providing both branded and private label goods to about 40,000 customers. It
operates convenience stores, grocers, pubs and restaurants and as such the group comprises of
Booker Wholesale, Booker Direct, Classic Drinks, Family Shopper and many other business
units. The major product of the company includes grocery, fresh food, beers, wines, tobacco and
Paraphrase This Document
Need a fresh take? Get an instant paraphrase of this document with our AI Paraphraser
5
alcoholic products. The non-food product items of the company include stationery, furniture,
office equipment and clothing (Booker, 2017).
On the other hand, Tate & Lyle PLC is recognized as a global supplier of food and
beverage ingredients to industrial markets. The company is headquartered within the UK and has
attained a leadership position within the food and beverage industry at a global level with the use
of its innovative technology to transform the raw materials and developing large-scale
manufacturing plants. The high manufacturing capabilities of the company has enabled it to
produce high quality ingredients for the customers. The company aspired to attain a global
position in providing special food ingredients and solutions.
3.0: Financial Analysis Method
Ratio Analysis
The method of ratio analysis has proved to be very effective for gaining an analysis of the
financial position of a company. It is regarded to be a quantitative method of analysis that can be
effectively sued for evaluating different financial aspects of a company such as determination of
its efficiency, liquidity, profitability, solvency and others. The different financial ratios are
calculated with the use of financial information disclosed by a company in its financial
statements.
Vertical Analysis
Vertical analysis can be regarded as a method of comparing the financial statement in
which each line item can be expressed as a percentage of base figures such as income statements
can be expressed as a percentage of gross sales (Gibson, 2008).
Horizontal Analysis
It is also known as trend analysis that involves expressing the financial items in the
financial statements as a percentage of the amount in the baseline year and taking the baseline
amount to be 100%.
DuPont
6
The method of financial analysis involves analyzing decomposing the different metrics of
return on equity for assessing the financial performance of a company (Monks and Lajoux,
2010).
3.1: Ratio Analysis
3.1.1: Profitability Ratio Analysis
Net Profit margin
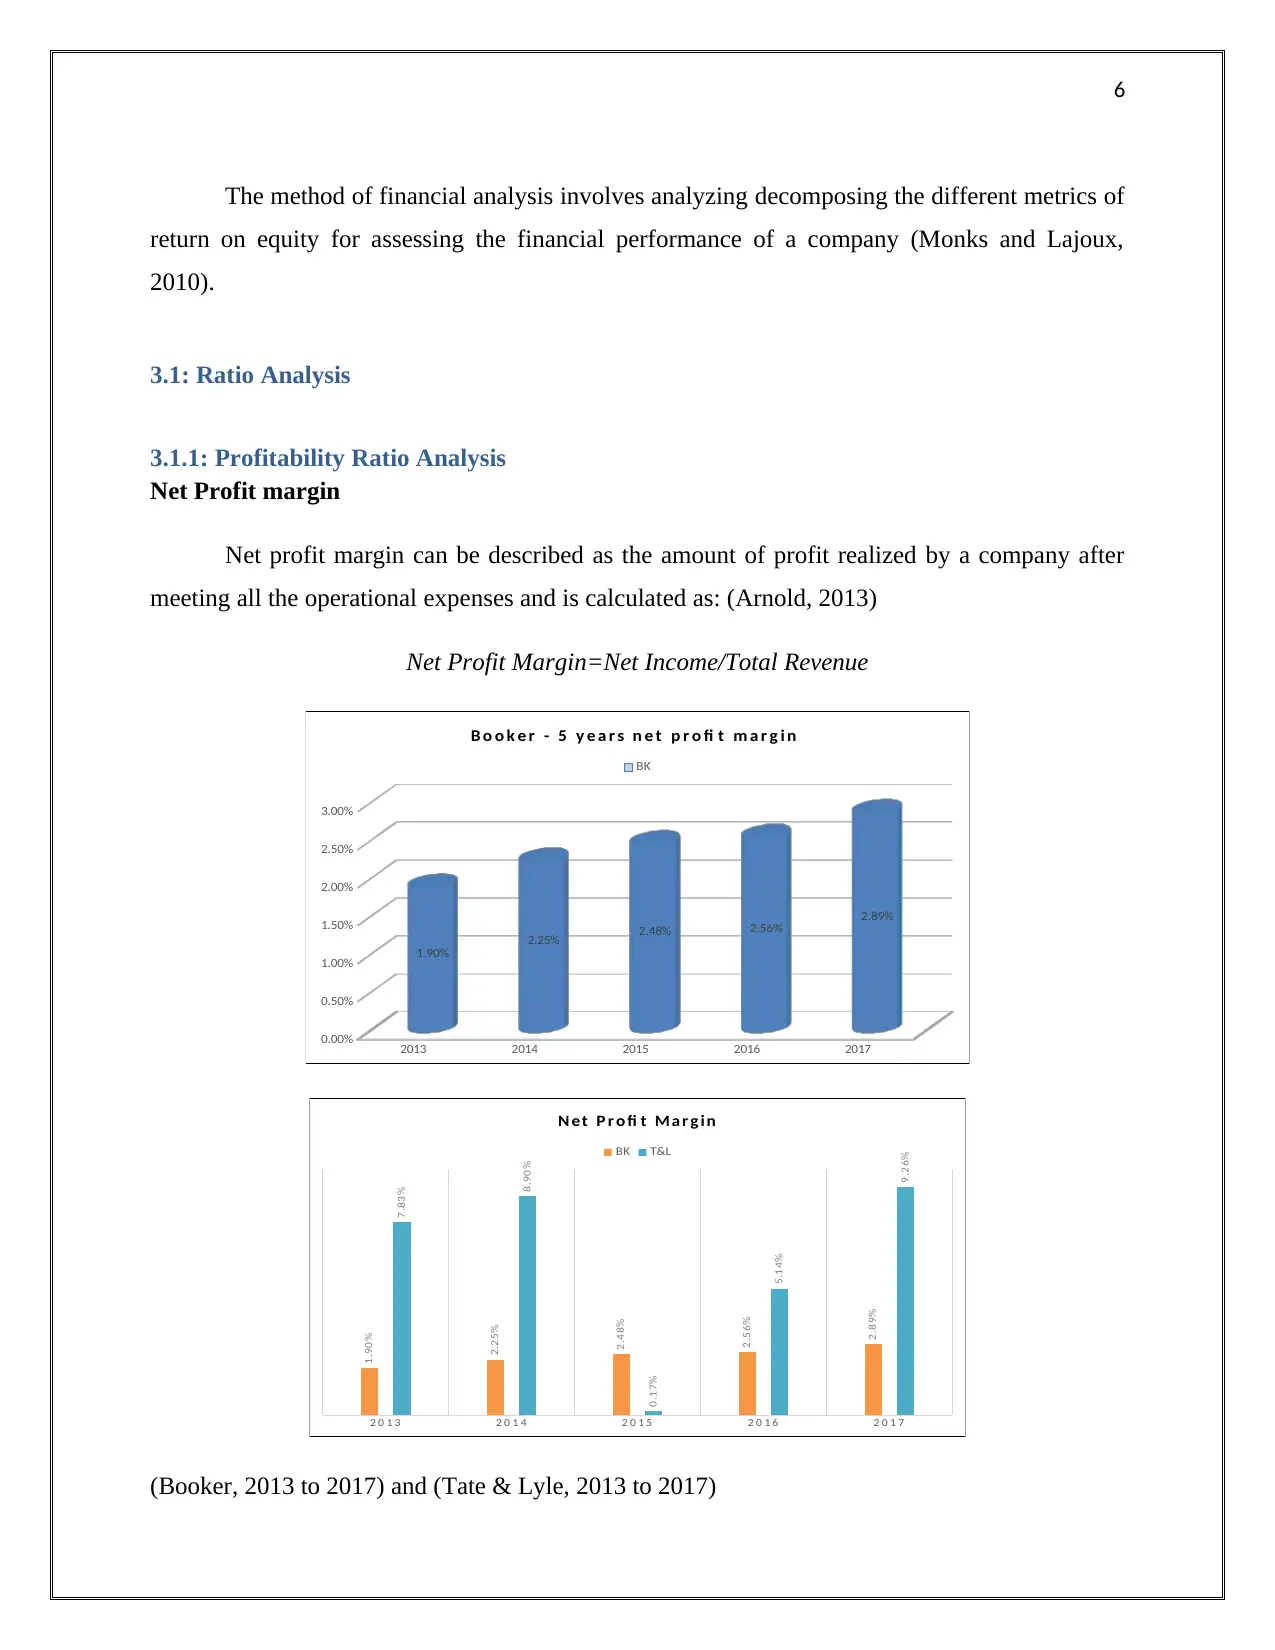
Net profit margin can be described as the amount of profit realized by a company after
meeting all the operational expenses and is calculated as: (Arnold, 2013)
Net Profit Margin=Net Income/Total Revenue
2013 2014 2015 2016 2017
0.00%
0.50%
1.00%
1.50%
2.00%
2.50%
3.00%
1.90%
2.25% 2.48% 2.56% 2.89%
B o o k e r - 5 y e a r s n e t p r o fi t m a r g i n
BK
2 0 1 3 2 0 1 4 2 0 1 5 2 0 1 6 2 0 1 7
1.90%
2.25%
2.48%
2.56%
2.89%
7.83%
8.90%
0.17%
5.14%
9.26%
N et P r o fi t Ma r g in
BK T&L
(Booker, 2013 to 2017) and (Tate & Lyle, 2013 to 2017)
The method of financial analysis involves analyzing decomposing the different metrics of
return on equity for assessing the financial performance of a company (Monks and Lajoux,
2010).
3.1: Ratio Analysis
3.1.1: Profitability Ratio Analysis
Net Profit margin
Net profit margin can be described as the amount of profit realized by a company after
meeting all the operational expenses and is calculated as: (Arnold, 2013)
Net Profit Margin=Net Income/Total Revenue
2013 2014 2015 2016 2017
0.00%
0.50%
1.00%
1.50%
2.00%
2.50%
3.00%
1.90%
2.25% 2.48% 2.56% 2.89%
B o o k e r - 5 y e a r s n e t p r o fi t m a r g i n
BK
2 0 1 3 2 0 1 4 2 0 1 5 2 0 1 6 2 0 1 7
1.90%
2.25%
2.48%
2.56%
2.89%
7.83%
8.90%
0.17%
5.14%
9.26%
N et P r o fi t Ma r g in
BK T&L
(Booker, 2013 to 2017) and (Tate & Lyle, 2013 to 2017)
⊘ This is a preview!⊘
Do you want full access?
Subscribe today to unlock all pages.
Trusted by 1+ million students worldwide
7
The comparison of the net profit margin ratio’s of both the companies over the financial
year 2013-2017 have depicted that its net profitability have increased over the selected financial
period. The comparison of the ratio with its competitor Tate &Lyle have revealed that its net
profitability is higher than Booker over the selected financial period. This means that Booker
need to reduce its operational costs for realizing higher profitability for outperforming its
competitors.
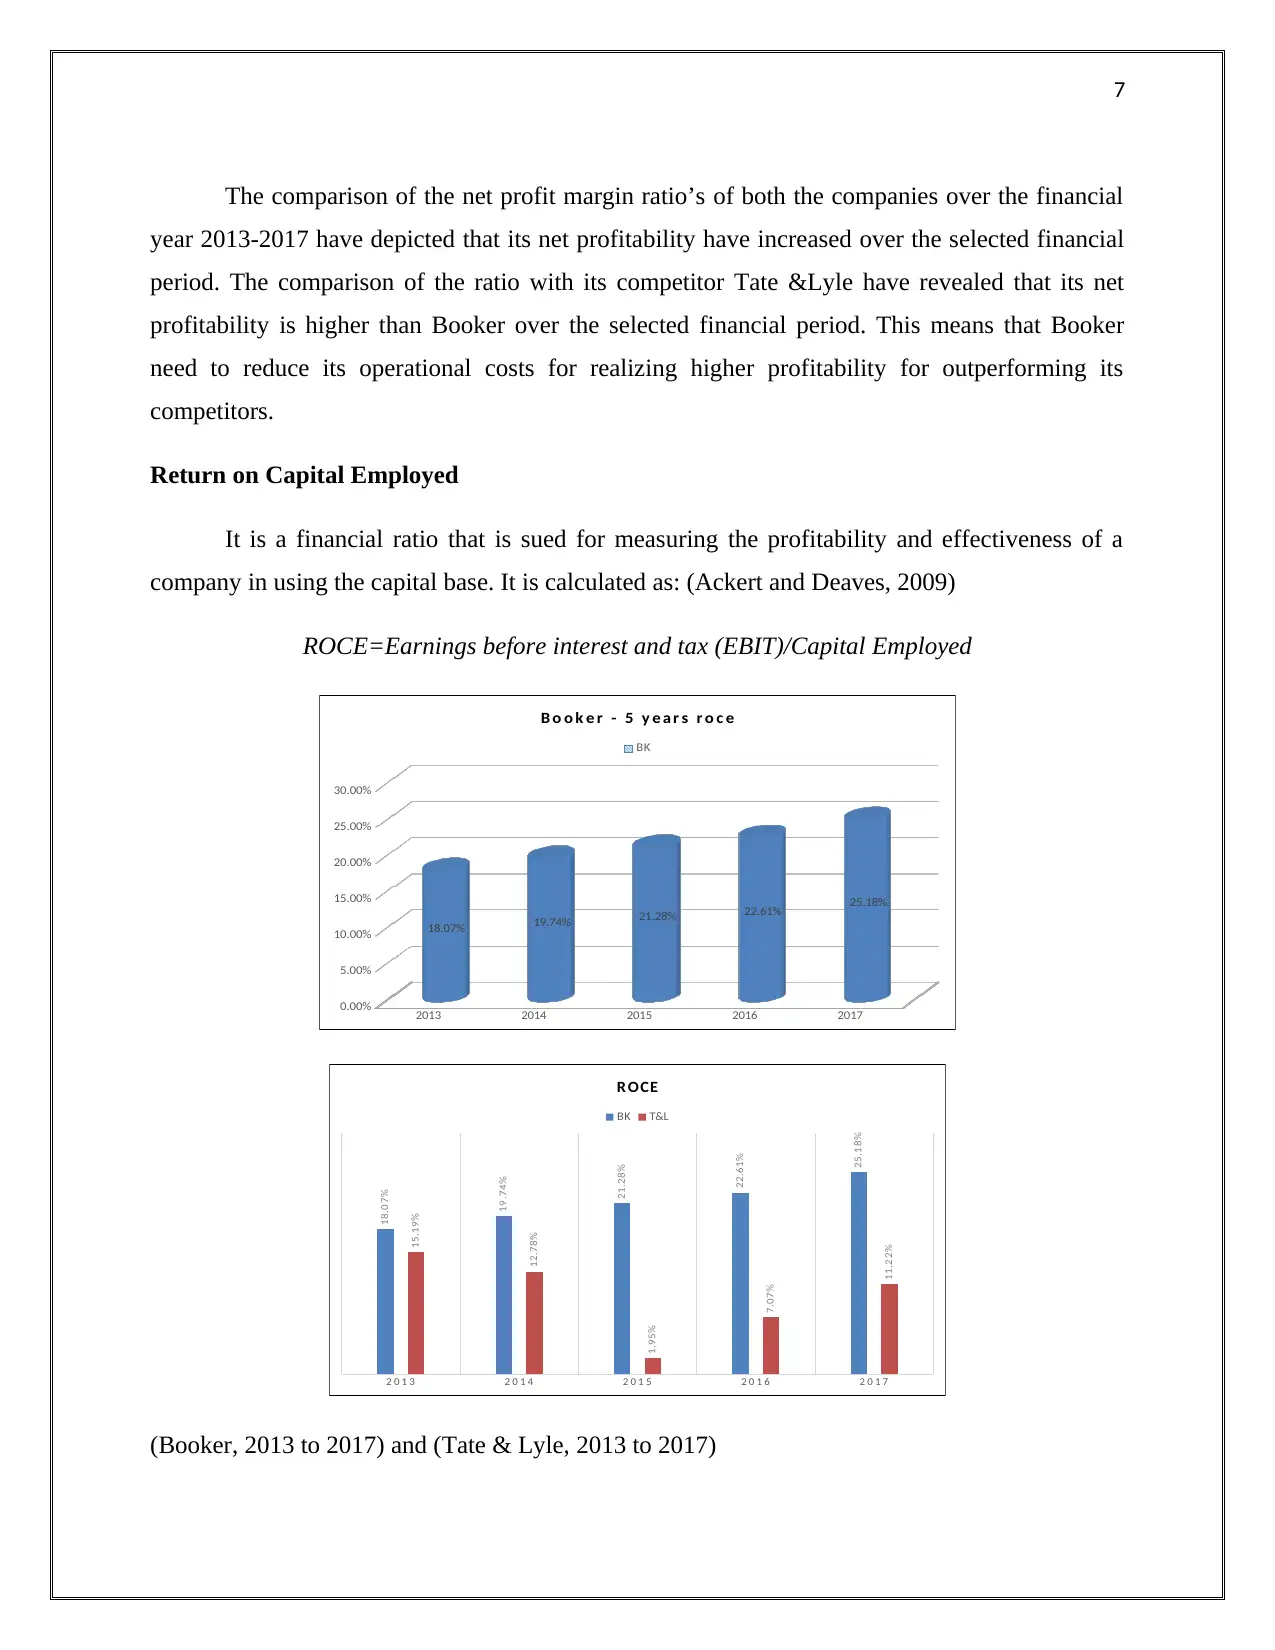
Return on Capital Employed
It is a financial ratio that is sued for measuring the profitability and effectiveness of a
company in using the capital base. It is calculated as: (Ackert and Deaves, 2009)
ROCE=Earnings before interest and tax (EBIT)/Capital Employed
2013 2014 2015 2016 2017
0.00%
5.00%
10.00%
15.00%
20.00%
25.00%
30.00%
18.07% 19.74% 21.28% 22.61% 25.18%
B o o k e r - 5 y e a r s r o c e
BK
2 0 1 3 2 0 1 4 2 0 1 5 2 0 1 6 2 0 1 7
18.07%
19.74%
21.28%
22.61%
25.18%
15.19%
12.78%
1.95%
7.07%
11.22%
R OCE
BK T&L
(Booker, 2013 to 2017) and (Tate & Lyle, 2013 to 2017)
The comparison of the net profit margin ratio’s of both the companies over the financial
year 2013-2017 have depicted that its net profitability have increased over the selected financial
period. The comparison of the ratio with its competitor Tate &Lyle have revealed that its net
profitability is higher than Booker over the selected financial period. This means that Booker
need to reduce its operational costs for realizing higher profitability for outperforming its
competitors.
Return on Capital Employed
It is a financial ratio that is sued for measuring the profitability and effectiveness of a
company in using the capital base. It is calculated as: (Ackert and Deaves, 2009)
ROCE=Earnings before interest and tax (EBIT)/Capital Employed
2013 2014 2015 2016 2017
0.00%
5.00%
10.00%
15.00%
20.00%
25.00%
30.00%
18.07% 19.74% 21.28% 22.61% 25.18%
B o o k e r - 5 y e a r s r o c e
BK
2 0 1 3 2 0 1 4 2 0 1 5 2 0 1 6 2 0 1 7
18.07%
19.74%
21.28%
22.61%
25.18%
15.19%
12.78%
1.95%
7.07%
11.22%
R OCE
BK T&L
(Booker, 2013 to 2017) and (Tate & Lyle, 2013 to 2017)
Paraphrase This Document
Need a fresh take? Get an instant paraphrase of this document with our AI Paraphraser
8
The ratio of the company BK has increased from 2013-2017 stating that its efficiency to
use capital for generating profits is on increase. On the other hand, the ratio of the company Tate
&Lyle is lower in comparison to BK depicting that its efficiency to utilize capital base is not so
effective in comparison to Booker. Booker is having high capital turnover which indicates that it
trades more for each dollar of capital invested. Tate & Lyle has realized a constant decrease in its
ROCE despite of increase in the net profitability which can be linked to its poor management by
the Chief Financial Officer.
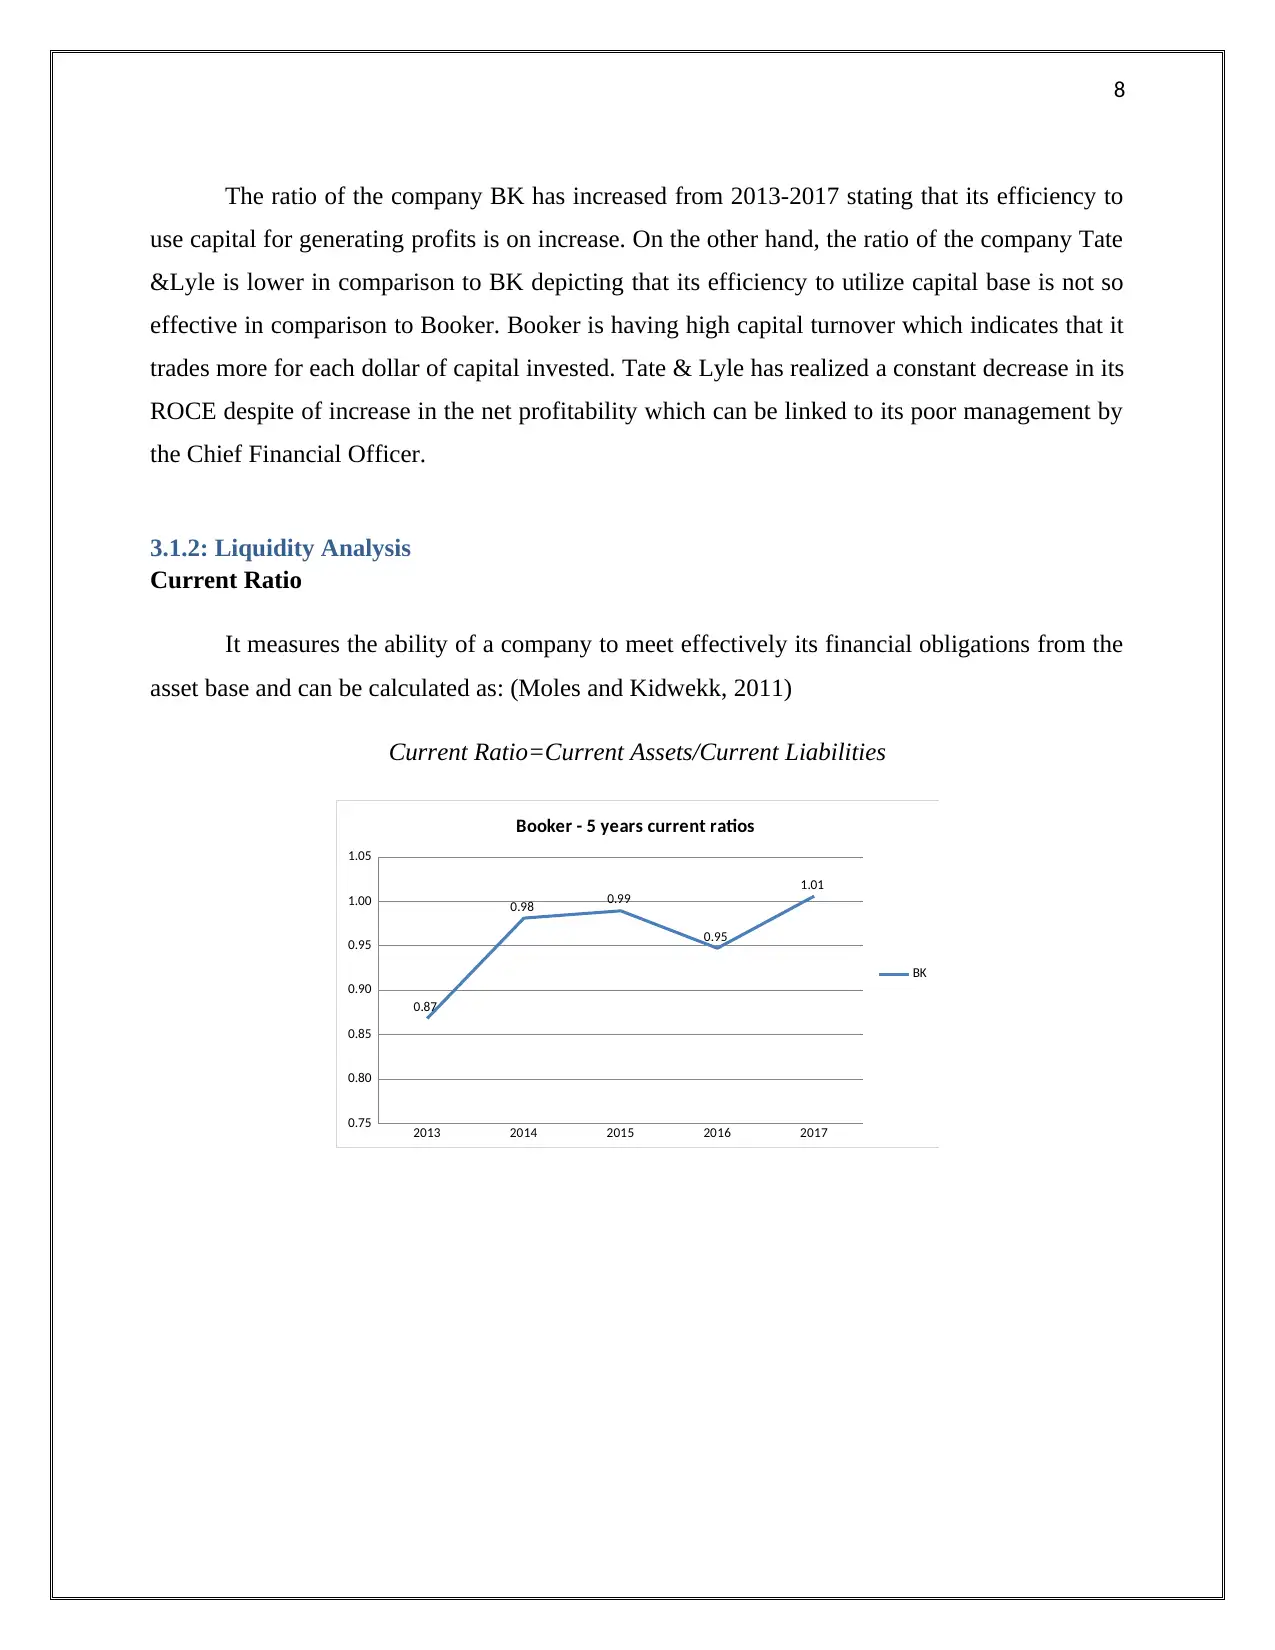
3.1.2: Liquidity Analysis
Current Ratio
It measures the ability of a company to meet effectively its financial obligations from the
asset base and can be calculated as: (Moles and Kidwekk, 2011)
Current Ratio=Current Assets/Current Liabilities
2013 2014 2015 2016 2017
0.75
0.80
0.85
0.90
0.95
1.00
1.05
0.87
0.98 0.99
0.95
1.01
Booker - 5 years current ratios
BK
The ratio of the company BK has increased from 2013-2017 stating that its efficiency to
use capital for generating profits is on increase. On the other hand, the ratio of the company Tate
&Lyle is lower in comparison to BK depicting that its efficiency to utilize capital base is not so
effective in comparison to Booker. Booker is having high capital turnover which indicates that it
trades more for each dollar of capital invested. Tate & Lyle has realized a constant decrease in its
ROCE despite of increase in the net profitability which can be linked to its poor management by
the Chief Financial Officer.
3.1.2: Liquidity Analysis
Current Ratio
It measures the ability of a company to meet effectively its financial obligations from the
asset base and can be calculated as: (Moles and Kidwekk, 2011)
Current Ratio=Current Assets/Current Liabilities
2013 2014 2015 2016 2017
0.75
0.80
0.85
0.90
0.95
1.00
1.05
0.87
0.98 0.99
0.95
1.01
Booker - 5 years current ratios
BK
9
2013 2014 2015 2016 2017
0.00
0.50
1.00
1.50
2.00
2.50
0.87 0.98 0.99 0.95 1.01
2.31
1.50
1.32
1.63
2.10
Current Ratio
BK
T&L
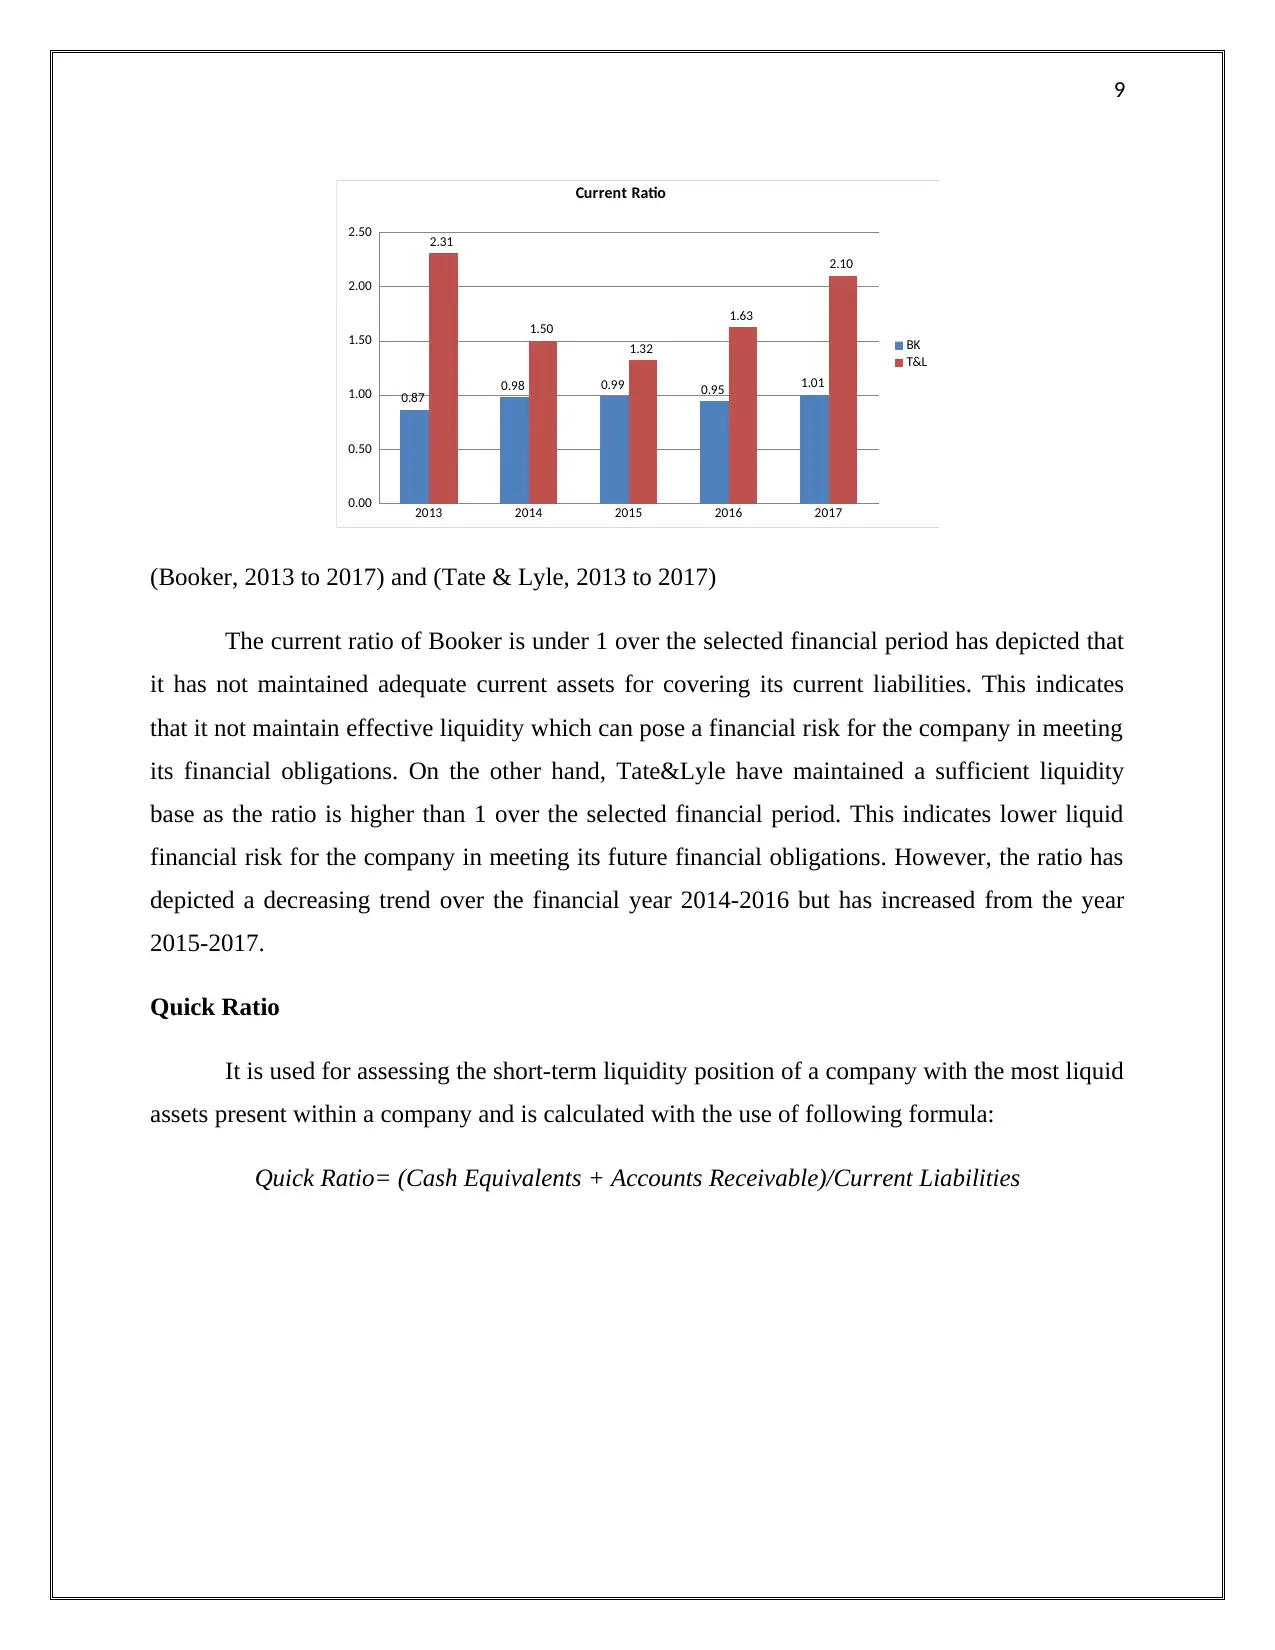
(Booker, 2013 to 2017) and (Tate & Lyle, 2013 to 2017)
The current ratio of Booker is under 1 over the selected financial period has depicted that
it has not maintained adequate current assets for covering its current liabilities. This indicates
that it not maintain effective liquidity which can pose a financial risk for the company in meeting
its financial obligations. On the other hand, Tate&Lyle have maintained a sufficient liquidity
base as the ratio is higher than 1 over the selected financial period. This indicates lower liquid
financial risk for the company in meeting its future financial obligations. However, the ratio has
depicted a decreasing trend over the financial year 2014-2016 but has increased from the year
2015-2017.
Quick Ratio
It is used for assessing the short-term liquidity position of a company with the most liquid
assets present within a company and is calculated with the use of following formula:
Quick Ratio= (Cash Equivalents + Accounts Receivable)/Current Liabilities
2013 2014 2015 2016 2017
0.00
0.50
1.00
1.50
2.00
2.50
0.87 0.98 0.99 0.95 1.01
2.31
1.50
1.32
1.63
2.10
Current Ratio
BK
T&L
(Booker, 2013 to 2017) and (Tate & Lyle, 2013 to 2017)
The current ratio of Booker is under 1 over the selected financial period has depicted that
it has not maintained adequate current assets for covering its current liabilities. This indicates
that it not maintain effective liquidity which can pose a financial risk for the company in meeting
its financial obligations. On the other hand, Tate&Lyle have maintained a sufficient liquidity
base as the ratio is higher than 1 over the selected financial period. This indicates lower liquid
financial risk for the company in meeting its future financial obligations. However, the ratio has
depicted a decreasing trend over the financial year 2014-2016 but has increased from the year
2015-2017.
Quick Ratio
It is used for assessing the short-term liquidity position of a company with the most liquid
assets present within a company and is calculated with the use of following formula:
Quick Ratio= (Cash Equivalents + Accounts Receivable)/Current Liabilities
⊘ This is a preview!⊘
Do you want full access?
Subscribe today to unlock all pages.
Trusted by 1+ million students worldwide
10
2013 2014 2015 2016 2017
0.00
0.05
0.10
0.15
0.20
0.25
0.30
0.35
0.40
0.45
0.50
0.34
0.44 0.45 0.44 0.46
Booker - 5 years quick ratios
BK
2013 2014 2015 2016 2017
0.00
0.20
0.40
0.60
0.80
1.00
1.20
1.40
1.60
0.34
0.44 0.45 0.44 0.46
1.44
0.98
0.81
1.03
1.20
Quick Ratio
BK
T&L
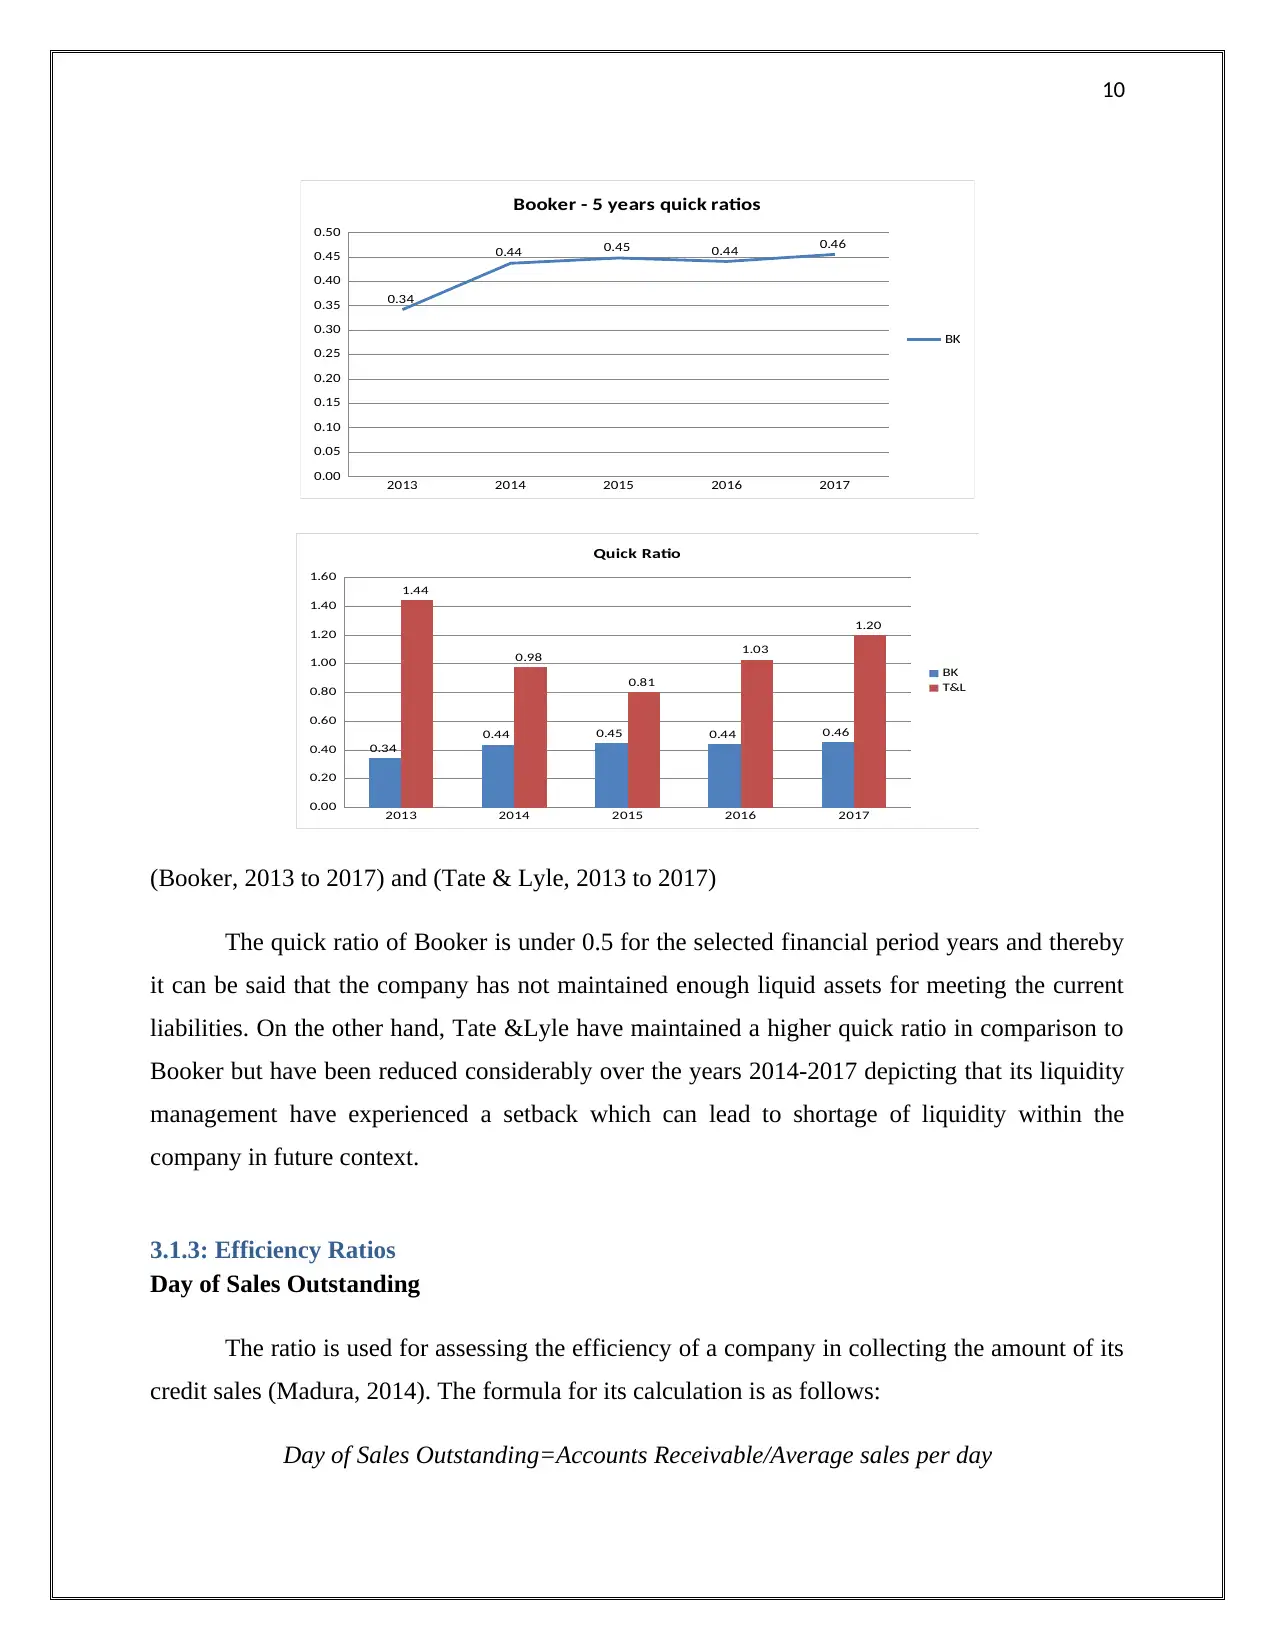
(Booker, 2013 to 2017) and (Tate & Lyle, 2013 to 2017)
The quick ratio of Booker is under 0.5 for the selected financial period years and thereby
it can be said that the company has not maintained enough liquid assets for meeting the current
liabilities. On the other hand, Tate &Lyle have maintained a higher quick ratio in comparison to
Booker but have been reduced considerably over the years 2014-2017 depicting that its liquidity
management have experienced a setback which can lead to shortage of liquidity within the
company in future context.
3.1.3: Efficiency Ratios
Day of Sales Outstanding
The ratio is used for assessing the efficiency of a company in collecting the amount of its
credit sales (Madura, 2014). The formula for its calculation is as follows:
Day of Sales Outstanding=Accounts Receivable/Average sales per day
2013 2014 2015 2016 2017
0.00
0.05
0.10
0.15
0.20
0.25
0.30
0.35
0.40
0.45
0.50
0.34
0.44 0.45 0.44 0.46
Booker - 5 years quick ratios
BK
2013 2014 2015 2016 2017
0.00
0.20
0.40
0.60
0.80
1.00
1.20
1.40
1.60
0.34
0.44 0.45 0.44 0.46
1.44
0.98
0.81
1.03
1.20
Quick Ratio
BK
T&L
(Booker, 2013 to 2017) and (Tate & Lyle, 2013 to 2017)
The quick ratio of Booker is under 0.5 for the selected financial period years and thereby
it can be said that the company has not maintained enough liquid assets for meeting the current
liabilities. On the other hand, Tate &Lyle have maintained a higher quick ratio in comparison to
Booker but have been reduced considerably over the years 2014-2017 depicting that its liquidity
management have experienced a setback which can lead to shortage of liquidity within the
company in future context.
3.1.3: Efficiency Ratios
Day of Sales Outstanding
The ratio is used for assessing the efficiency of a company in collecting the amount of its
credit sales (Madura, 2014). The formula for its calculation is as follows:
Day of Sales Outstanding=Accounts Receivable/Average sales per day
Paraphrase This Document
Need a fresh take? Get an instant paraphrase of this document with our AI Paraphraser
11
2013 2014 2015 2016 2017
0.00
1.00
2.00
3.00
4.00
5.00
6.00
7.00
8.00
9.00
10.00
4.95 4.62 5.17
7.17
9.91
B o ok e r - 5 y e ar s D S O
BK
2013 2014 2015 2016 2017
0.00
5.00
10.00
15.00
20.00
25.00
30.00
35.00
40.00
4.95 4.62 5.17 7.17
9.91
33
37 37 38
32
Days of Sales Outstanding
BK
T&L
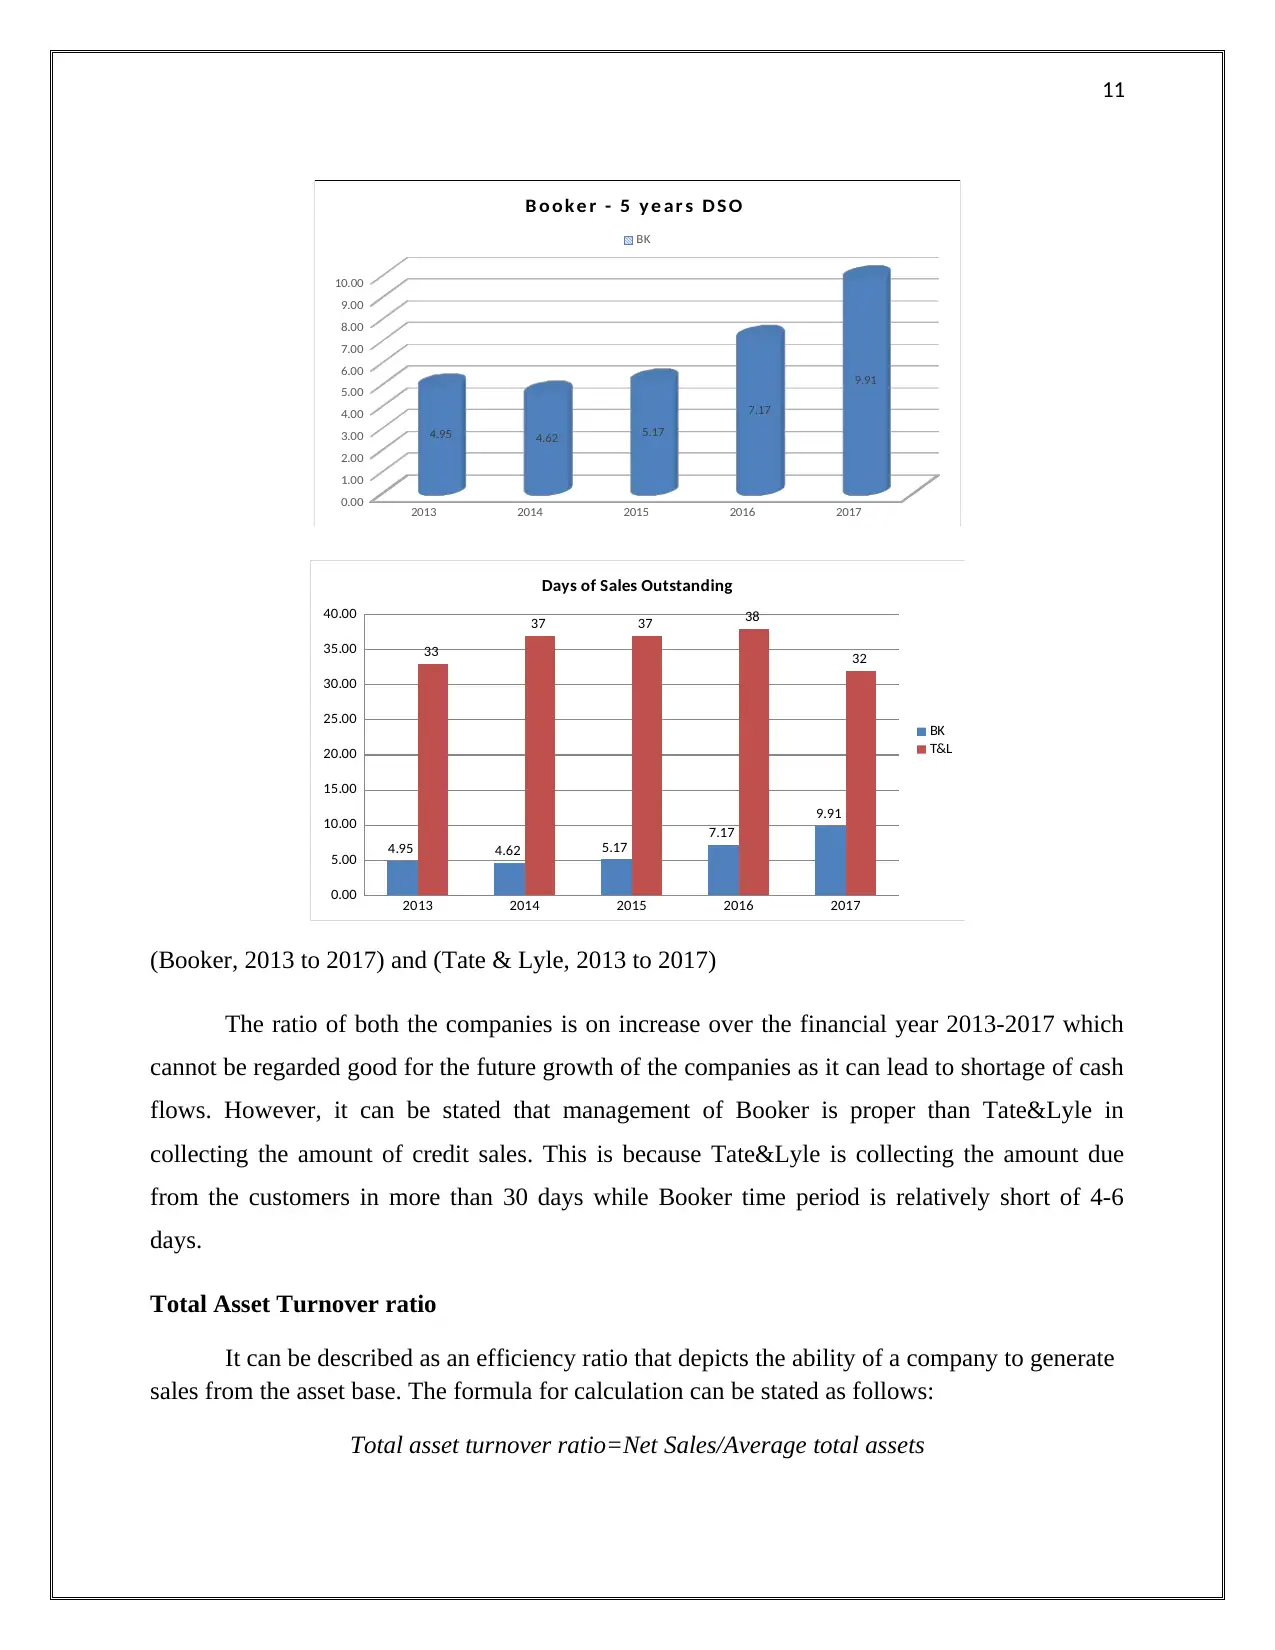
(Booker, 2013 to 2017) and (Tate & Lyle, 2013 to 2017)
The ratio of both the companies is on increase over the financial year 2013-2017 which
cannot be regarded good for the future growth of the companies as it can lead to shortage of cash
flows. However, it can be stated that management of Booker is proper than Tate&Lyle in
collecting the amount of credit sales. This is because Tate&Lyle is collecting the amount due
from the customers in more than 30 days while Booker time period is relatively short of 4-6
days.
Total Asset Turnover ratio
It can be described as an efficiency ratio that depicts the ability of a company to generate
sales from the asset base. The formula for calculation can be stated as follows:
Total asset turnover ratio=Net Sales/Average total assets
2013 2014 2015 2016 2017
0.00
1.00
2.00
3.00
4.00
5.00
6.00
7.00
8.00
9.00
10.00
4.95 4.62 5.17
7.17
9.91
B o ok e r - 5 y e ar s D S O
BK
2013 2014 2015 2016 2017
0.00
5.00
10.00
15.00
20.00
25.00
30.00
35.00
40.00
4.95 4.62 5.17 7.17
9.91
33
37 37 38
32
Days of Sales Outstanding
BK
T&L
(Booker, 2013 to 2017) and (Tate & Lyle, 2013 to 2017)
The ratio of both the companies is on increase over the financial year 2013-2017 which
cannot be regarded good for the future growth of the companies as it can lead to shortage of cash
flows. However, it can be stated that management of Booker is proper than Tate&Lyle in
collecting the amount of credit sales. This is because Tate&Lyle is collecting the amount due
from the customers in more than 30 days while Booker time period is relatively short of 4-6
days.
Total Asset Turnover ratio
It can be described as an efficiency ratio that depicts the ability of a company to generate
sales from the asset base. The formula for calculation can be stated as follows:
Total asset turnover ratio=Net Sales/Average total assets
12
2013 2014 2015 2016 2017
3.60
3.65
3.70
3.75
3.80
3.85
3.90
3.95
4.00
Booker - 5 years Total Asset Turnover Ratio
BK
2013 2014 2015 2016 2017
0.00
0.50
1.00
1.50
2.00
2.50
3.00
3.50
4.00
4.50
3.90 3.96 3.76 3.75 3.78
1.14 1.05 0.96 0.95 1.03
Total Asset Turnover Ratio
BK
T & L
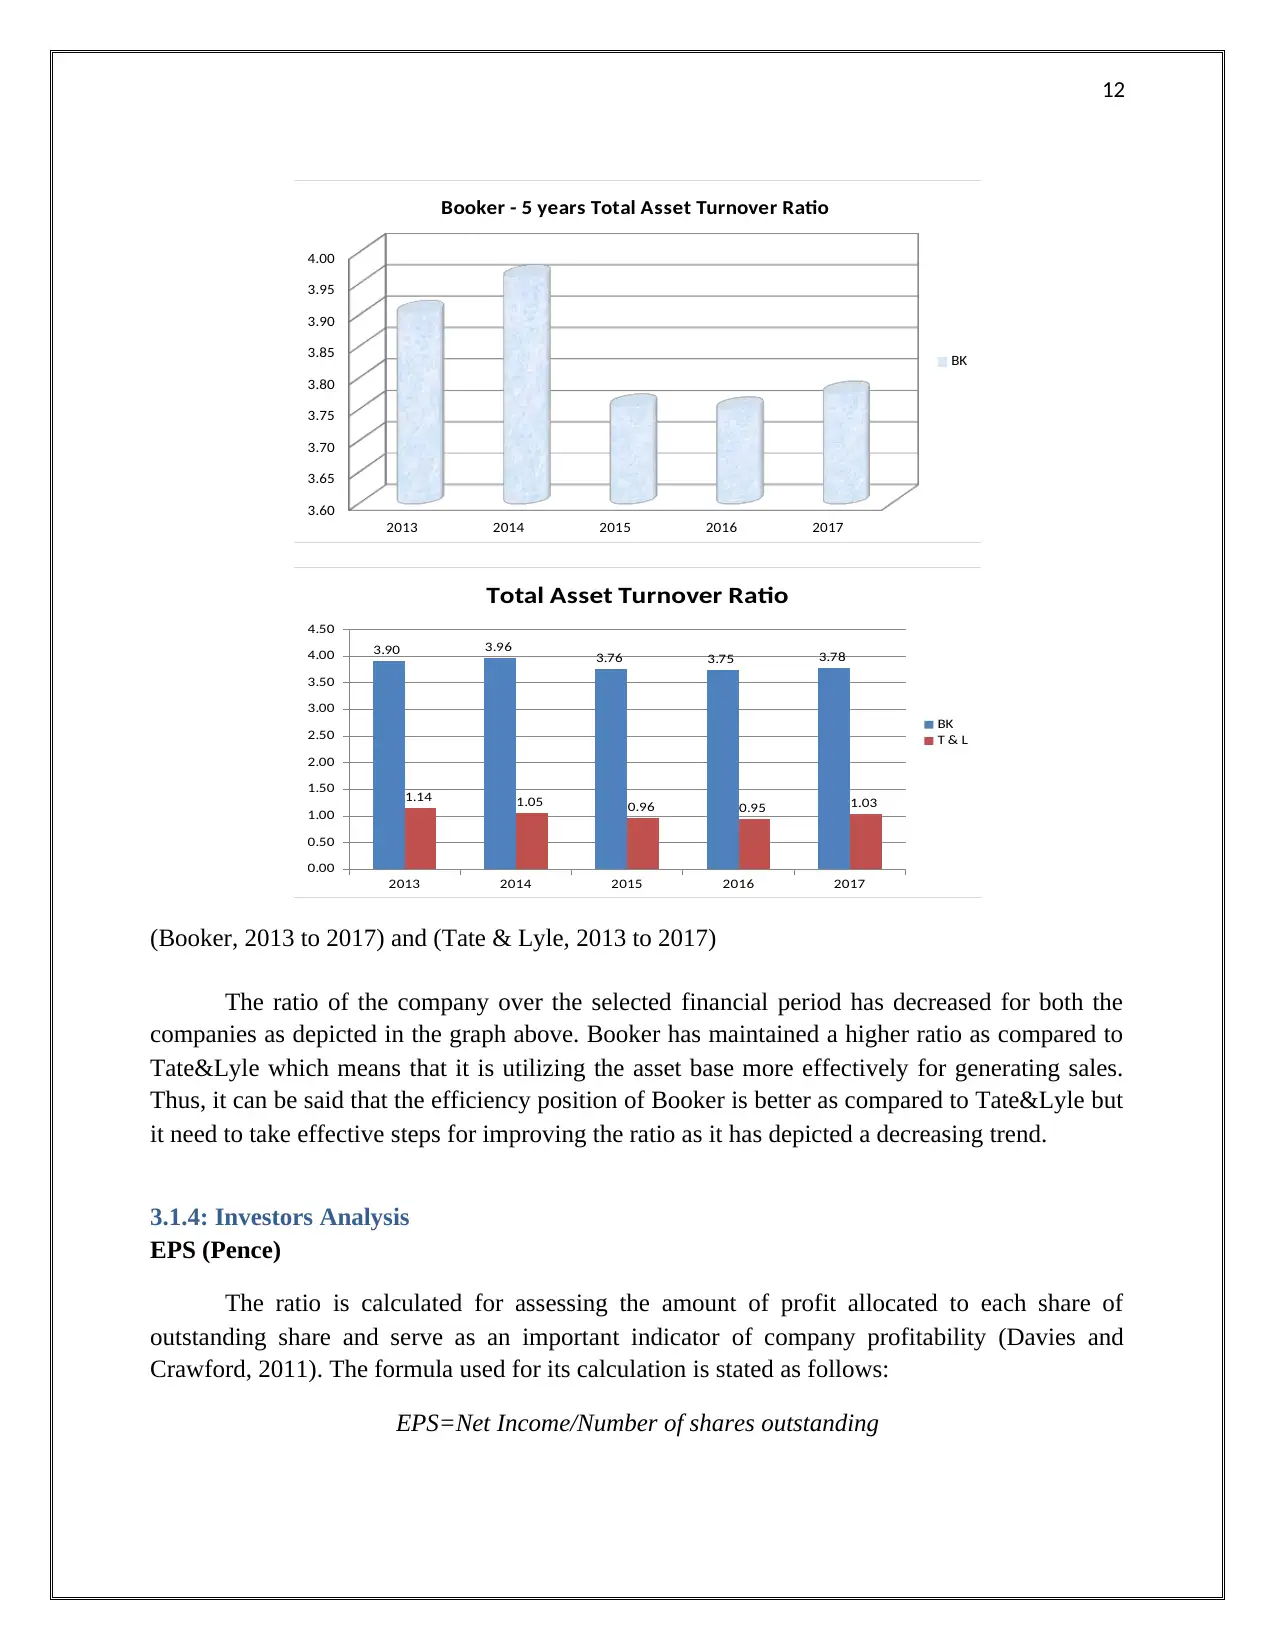
(Booker, 2013 to 2017) and (Tate & Lyle, 2013 to 2017)
The ratio of the company over the selected financial period has decreased for both the
companies as depicted in the graph above. Booker has maintained a higher ratio as compared to
Tate&Lyle which means that it is utilizing the asset base more effectively for generating sales.
Thus, it can be said that the efficiency position of Booker is better as compared to Tate&Lyle but
it need to take effective steps for improving the ratio as it has depicted a decreasing trend.
3.1.4: Investors Analysis
EPS (Pence)
The ratio is calculated for assessing the amount of profit allocated to each share of
outstanding share and serve as an important indicator of company profitability (Davies and
Crawford, 2011). The formula used for its calculation is stated as follows:
EPS=Net Income/Number of shares outstanding
2013 2014 2015 2016 2017
3.60
3.65
3.70
3.75
3.80
3.85
3.90
3.95
4.00
Booker - 5 years Total Asset Turnover Ratio
BK
2013 2014 2015 2016 2017
0.00
0.50
1.00
1.50
2.00
2.50
3.00
3.50
4.00
4.50
3.90 3.96 3.76 3.75 3.78
1.14 1.05 0.96 0.95 1.03
Total Asset Turnover Ratio
BK
T & L
(Booker, 2013 to 2017) and (Tate & Lyle, 2013 to 2017)
The ratio of the company over the selected financial period has decreased for both the
companies as depicted in the graph above. Booker has maintained a higher ratio as compared to
Tate&Lyle which means that it is utilizing the asset base more effectively for generating sales.
Thus, it can be said that the efficiency position of Booker is better as compared to Tate&Lyle but
it need to take effective steps for improving the ratio as it has depicted a decreasing trend.
3.1.4: Investors Analysis
EPS (Pence)
The ratio is calculated for assessing the amount of profit allocated to each share of
outstanding share and serve as an important indicator of company profitability (Davies and
Crawford, 2011). The formula used for its calculation is stated as follows:
EPS=Net Income/Number of shares outstanding
⊘ This is a preview!⊘
Do you want full access?
Subscribe today to unlock all pages.
Trusted by 1+ million students worldwide
1 out of 69
Related Documents


Your All-in-One AI-Powered Toolkit for Academic Success.
+13062052269
info@desklib.com
Available 24*7 on WhatsApp / Email
![[object Object]](/_next/static/media/star-bottom.7253800d.svg)
Unlock your academic potential
Copyright © 2020–2026 A2Z Services. All Rights Reserved. Developed and managed by ZUCOL.