Comparative Financial Analysis: Boral and Adelaide Brighton (2017)
VerifiedAdded on 2021/05/31
|21
|4291
|43
Report
AI Summary
This report provides a comparative financial analysis of Boral Limited and Adelaide Brighton Limited, two Australian companies operating in the cement sector, using financial ratios. The analysis focuses on the financial year 2017 and utilizes data extracted from financial reports and the ASX website. The report evaluates and compares the companies across five key areas: liquidity, efficiency, financial leverage, profitability, and market value ratios. Liquidity ratios, including current and quick ratios, assess short-term solvency. Financial leverage ratios, such as debt-to-equity and interest coverage ratios, evaluate long-term solvency. Efficiency ratios, including accounts receivable turnover, accounts payable turnover, and asset turnover ratios, measure asset and liability management. Profitability ratios, which were not fully detailed in the provided text, are also considered. Finally, market value ratios were used to compare the companies' performance. The report concludes with a summary of the findings and recommendations for potential investors, identifying which company demonstrates a stronger financial position based on the ratio analysis.
RUNNING HEAD: BUSINESS FINANCE
BUSINESS FINANCE
BUSINESS FINANCE
Paraphrase This Document
Need a fresh take? Get an instant paraphrase of this document with our AI Paraphraser
BUSINESS FINANCE 1
Contents
INTRODUCTION......................................................................................................................2
RATIO ANALYSIS...................................................................................................................4
Liquidity ratios.......................................................................................................................4
Financial leverage ratios.........................................................................................................6
Efficiency ratios......................................................................................................................8
Profitability ratios.................................................................................................................11
Market Value ratios..............................................................................................................14
CONCLUSION and RECOMMENDATION..........................................................................16
REFERENCES.........................................................................................................................17
BUSINESS FINANCE 2
INTRODUCTION
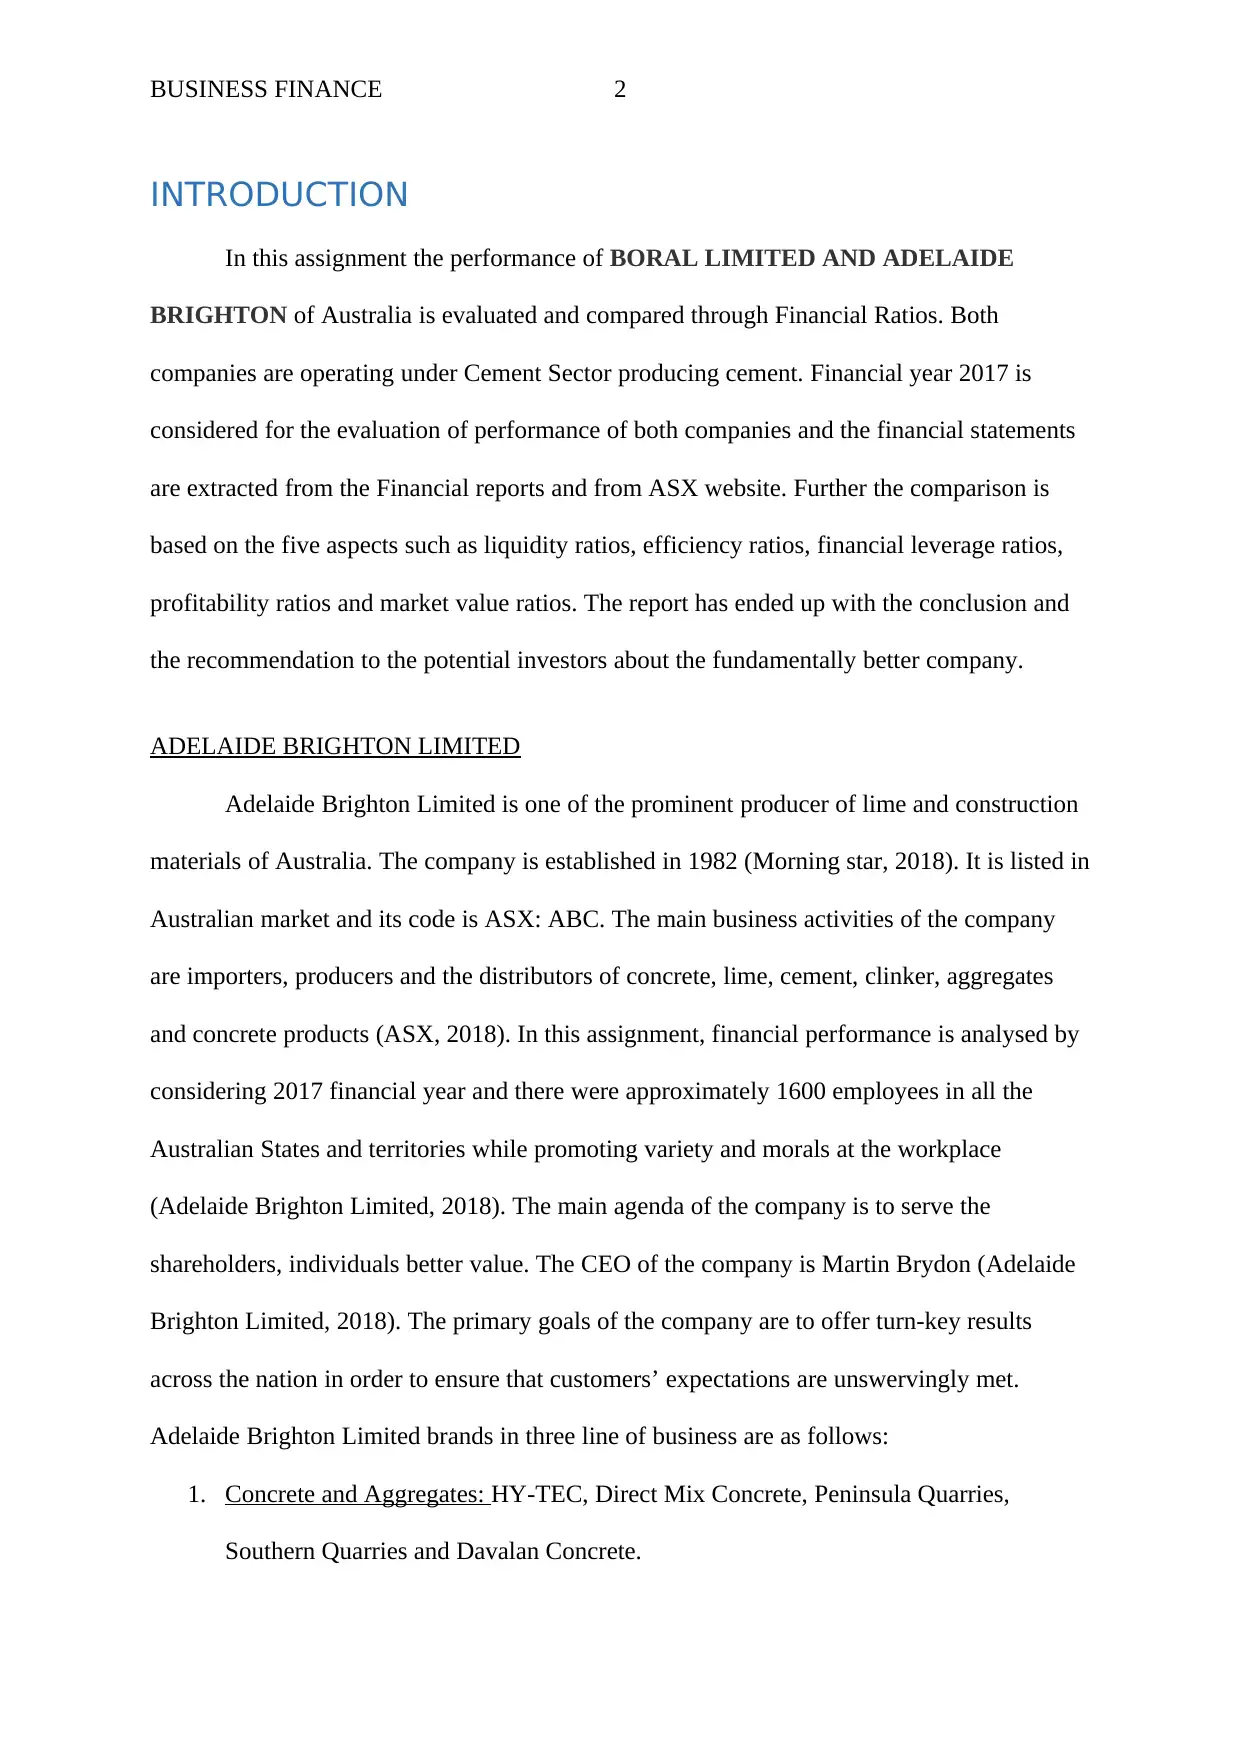
In this assignment the performance of BORAL LIMITED AND ADELAIDE
BRIGHTON of Australia is evaluated and compared through Financial Ratios. Both
companies are operating under Cement Sector producing cement. Financial year 2017 is
considered for the evaluation of performance of both companies and the financial statements
are extracted from the Financial reports and from ASX website. Further the comparison is
based on the five aspects such as liquidity ratios, efficiency ratios, financial leverage ratios,
profitability ratios and market value ratios. The report has ended up with the conclusion and
the recommendation to the potential investors about the fundamentally better company.
ADELAIDE BRIGHTON LIMITED
Adelaide Brighton Limited is one of the prominent producer of lime and construction
materials of Australia. The company is established in 1982 (Morning star, 2018). It is listed in
Australian market and its code is ASX: ABC. The main business activities of the company
are importers, producers and the distributors of concrete, lime, cement, clinker, aggregates
and concrete products (ASX, 2018). In this assignment, financial performance is analysed by
considering 2017 financial year and there were approximately 1600 employees in all the
Australian States and territories while promoting variety and morals at the workplace
(Adelaide Brighton Limited, 2018). The main agenda of the company is to serve the
shareholders, individuals better value. The CEO of the company is Martin Brydon (Adelaide
Brighton Limited, 2018). The primary goals of the company are to offer turn-key results
across the nation in order to ensure that customers’ expectations are unswervingly met.
Adelaide Brighton Limited brands in three line of business are as follows:
1. Concrete and Aggregates: HY-TEC, Direct Mix Concrete, Peninsula Quarries,
Southern Quarries and Davalan Concrete.
INTRODUCTION
In this assignment the performance of BORAL LIMITED AND ADELAIDE
BRIGHTON of Australia is evaluated and compared through Financial Ratios. Both
companies are operating under Cement Sector producing cement. Financial year 2017 is
considered for the evaluation of performance of both companies and the financial statements
are extracted from the Financial reports and from ASX website. Further the comparison is
based on the five aspects such as liquidity ratios, efficiency ratios, financial leverage ratios,
profitability ratios and market value ratios. The report has ended up with the conclusion and
the recommendation to the potential investors about the fundamentally better company.
ADELAIDE BRIGHTON LIMITED
Adelaide Brighton Limited is one of the prominent producer of lime and construction
materials of Australia. The company is established in 1982 (Morning star, 2018). It is listed in
Australian market and its code is ASX: ABC. The main business activities of the company
are importers, producers and the distributors of concrete, lime, cement, clinker, aggregates
and concrete products (ASX, 2018). In this assignment, financial performance is analysed by
considering 2017 financial year and there were approximately 1600 employees in all the
Australian States and territories while promoting variety and morals at the workplace
(Adelaide Brighton Limited, 2018). The main agenda of the company is to serve the
shareholders, individuals better value. The CEO of the company is Martin Brydon (Adelaide
Brighton Limited, 2018). The primary goals of the company are to offer turn-key results
across the nation in order to ensure that customers’ expectations are unswervingly met.
Adelaide Brighton Limited brands in three line of business are as follows:
1. Concrete and Aggregates: HY-TEC, Direct Mix Concrete, Peninsula Quarries,
Southern Quarries and Davalan Concrete.
⊘ This is a preview!⊘
Do you want full access?
Subscribe today to unlock all pages.
Trusted by 1+ million students worldwide

BUSINESS FINANCE 3
2. Cement and Lime: Swan Cement, Northern Cement, Adelaide Brighton Cement
Limited and Cockburn Cement.
3. Concrete Products: Adbri Masonry.
BORAL LIMITED
Boral Limited is one of the international producer of construction materials and
building products of Australia. It is listed in Australian market and its code is ASX: BLD
(ASX, 2018). The main purpose of the company is to build best class quality and innovative
building products and construction materials across international lands. The company is
operating in Asia, Australia, Middle East, North America (Boral, 2017). In this assignment,
financial performance is analysed by considering 2017 financial year and there were
approximately 11499 employees which includes around 18% women workforce while
promoting safe and rewarding place of work. The main agenda of the company is to serve the
shareholders, individuals better value that exceeds the cost of capital. The CEO is Mike Kane
whereas Dr Brian Clark is the chairman of the company (Boral, 2017).
Some of the key highlights of the company are as follows:
1. To combine brick business in North America, Boral limited had an agreement with
Forterra Brick for 50 percent joint venture.
2. Boral limited acquired Headwaters Inc. in May 2017 for US $ 2.6 billion which
supports Boral’s ability to deliver sound returns and also well affiliated with the
considered objectives (Boral, 2017).
3. In the year 2017, Boral limited had delivered 24.9% total shareholder return which is
more than approximately average return of 16.9% for 100 Australian listed companies
which is impressive.
Paraphrase This Document
Need a fresh take? Get an instant paraphrase of this document with our AI Paraphraser
BUSINESS FINANCE 4
RATIO ANALYSIS
Ratio analysis is the quantitative analysis where performance of both the companies
are assessed through financial ratios which determines the soundness of the company.
For conducting ratio analysis, the data is gathered from the annual report and the
comparison is performed between the companies. For this task, short term solvency ratios
(liquidity ratios), asset utilisation ratios (turnover or efficiency ratios), long term solvency
ratios (financial leverage ratios), profitability ratios and market value ratios are considered for
the comparison of both companies’ performance. Thus, Boral Limited and Adelaide Brighton
Limited are fundamentally analysed.
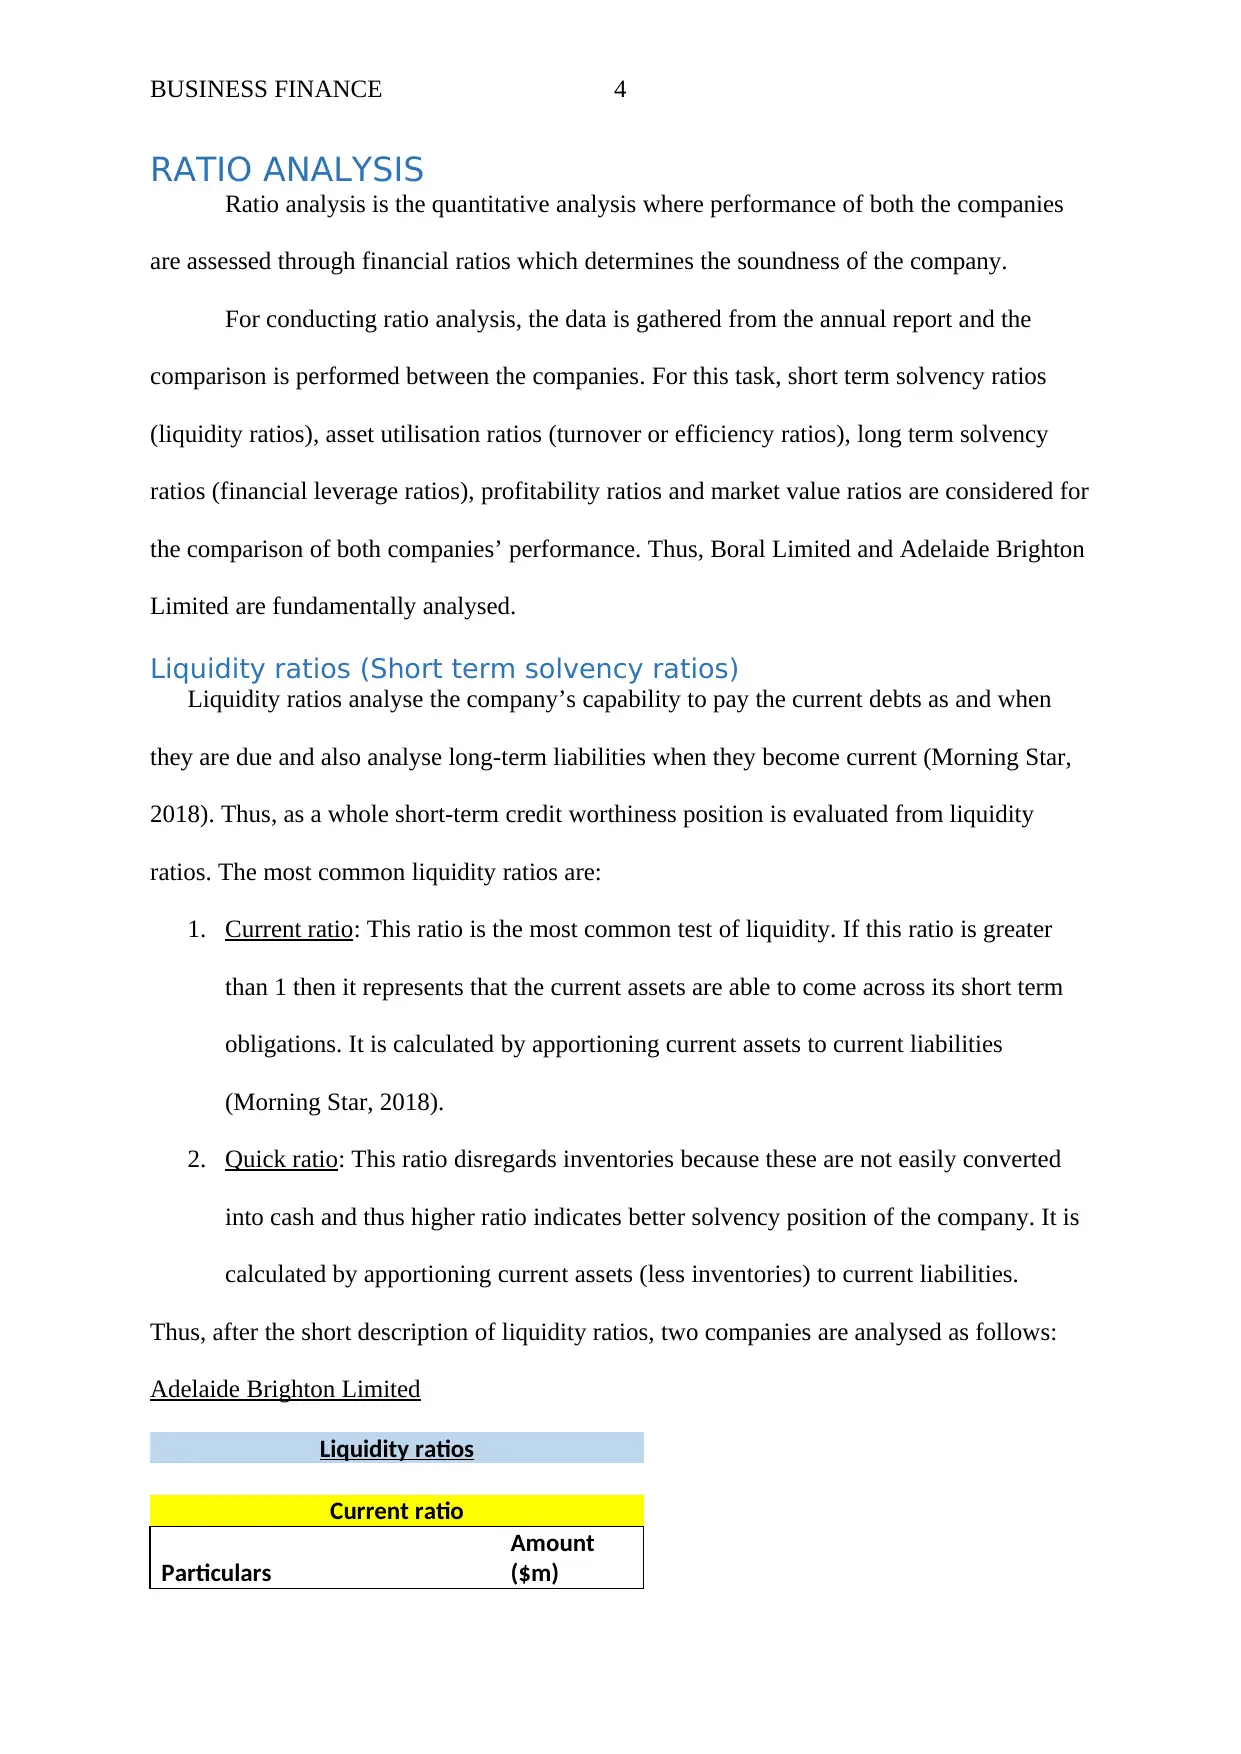
Liquidity ratios (Short term solvency ratios)
Liquidity ratios analyse the company’s capability to pay the current debts as and when
they are due and also analyse long-term liabilities when they become current (Morning Star,
2018). Thus, as a whole short-term credit worthiness position is evaluated from liquidity
ratios. The most common liquidity ratios are:
1. Current ratio: This ratio is the most common test of liquidity. If this ratio is greater
than 1 then it represents that the current assets are able to come across its short term
obligations. It is calculated by apportioning current assets to current liabilities
(Morning Star, 2018).
2. Quick ratio: This ratio disregards inventories because these are not easily converted
into cash and thus higher ratio indicates better solvency position of the company. It is
calculated by apportioning current assets (less inventories) to current liabilities.
Thus, after the short description of liquidity ratios, two companies are analysed as follows:
Adelaide Brighton Limited
Liquidity ratios
Current ratio
Particulars
Amount
($m)
RATIO ANALYSIS
Ratio analysis is the quantitative analysis where performance of both the companies
are assessed through financial ratios which determines the soundness of the company.
For conducting ratio analysis, the data is gathered from the annual report and the
comparison is performed between the companies. For this task, short term solvency ratios
(liquidity ratios), asset utilisation ratios (turnover or efficiency ratios), long term solvency
ratios (financial leverage ratios), profitability ratios and market value ratios are considered for
the comparison of both companies’ performance. Thus, Boral Limited and Adelaide Brighton
Limited are fundamentally analysed.
Liquidity ratios (Short term solvency ratios)
Liquidity ratios analyse the company’s capability to pay the current debts as and when
they are due and also analyse long-term liabilities when they become current (Morning Star,
2018). Thus, as a whole short-term credit worthiness position is evaluated from liquidity
ratios. The most common liquidity ratios are:
1. Current ratio: This ratio is the most common test of liquidity. If this ratio is greater
than 1 then it represents that the current assets are able to come across its short term
obligations. It is calculated by apportioning current assets to current liabilities
(Morning Star, 2018).
2. Quick ratio: This ratio disregards inventories because these are not easily converted
into cash and thus higher ratio indicates better solvency position of the company. It is
calculated by apportioning current assets (less inventories) to current liabilities.
Thus, after the short description of liquidity ratios, two companies are analysed as follows:
Adelaide Brighton Limited
Liquidity ratios
Current ratio
Particulars
Amount
($m)

BUSINESS FINANCE 5
Current Assets 474.8
Current Liabilities 204.8
Current ratio [CA/CL] 2.32
Quick ratio
Particulars
Amount
($m)
Current Assets 474.8
Inventories 174.3
Current Liabilities 204.8
Quick ratio
[(CA-inventories)/CL] 1.47
(Adelaide Brighton Limited, 2017).
Boral Limited
Liquidity ratios
Current ratio
Particulars
Amount
($m)
Current Assets 1763.7
Current Liabilities 1468.3
Current ratio [CA/CL] 1.20
Quick ratio
Particulars
Amount
($m)
Current Assets 1763.7
Inventories 606.6
Current Liabilities 1468.3
Quick ratio
[(CA-inventories)/CL] 0.79
(Boral, 2017).
Adelaide Brighton Limited and Boral Limited
Financial Year - 2017
Particulars Adelaide Brighton Limited Boral Limited
Current ratio 2.32 1.2
Quick ratio 1.47 0.79
(Refer: Excel Sheet)
Current Assets 474.8
Current Liabilities 204.8
Current ratio [CA/CL] 2.32
Quick ratio
Particulars
Amount
($m)
Current Assets 474.8
Inventories 174.3
Current Liabilities 204.8
Quick ratio
[(CA-inventories)/CL] 1.47
(Adelaide Brighton Limited, 2017).
Boral Limited
Liquidity ratios
Current ratio
Particulars
Amount
($m)
Current Assets 1763.7
Current Liabilities 1468.3
Current ratio [CA/CL] 1.20
Quick ratio
Particulars
Amount
($m)
Current Assets 1763.7
Inventories 606.6
Current Liabilities 1468.3
Quick ratio
[(CA-inventories)/CL] 0.79
(Boral, 2017).
Adelaide Brighton Limited and Boral Limited
Financial Year - 2017
Particulars Adelaide Brighton Limited Boral Limited
Current ratio 2.32 1.2
Quick ratio 1.47 0.79
(Refer: Excel Sheet)
⊘ This is a preview!⊘
Do you want full access?
Subscribe today to unlock all pages.
Trusted by 1+ million students worldwide
BUSINESS FINANCE 6
Performance comparison
From the above description of liquidity ratios, it has been observed that higher
the ratio, better is the short-term solvency position of the company. Thus, according to
the above table, it can be said that short-term solvency position of Adelaide Brighton
ltd is better in comparison to Boral Limited.
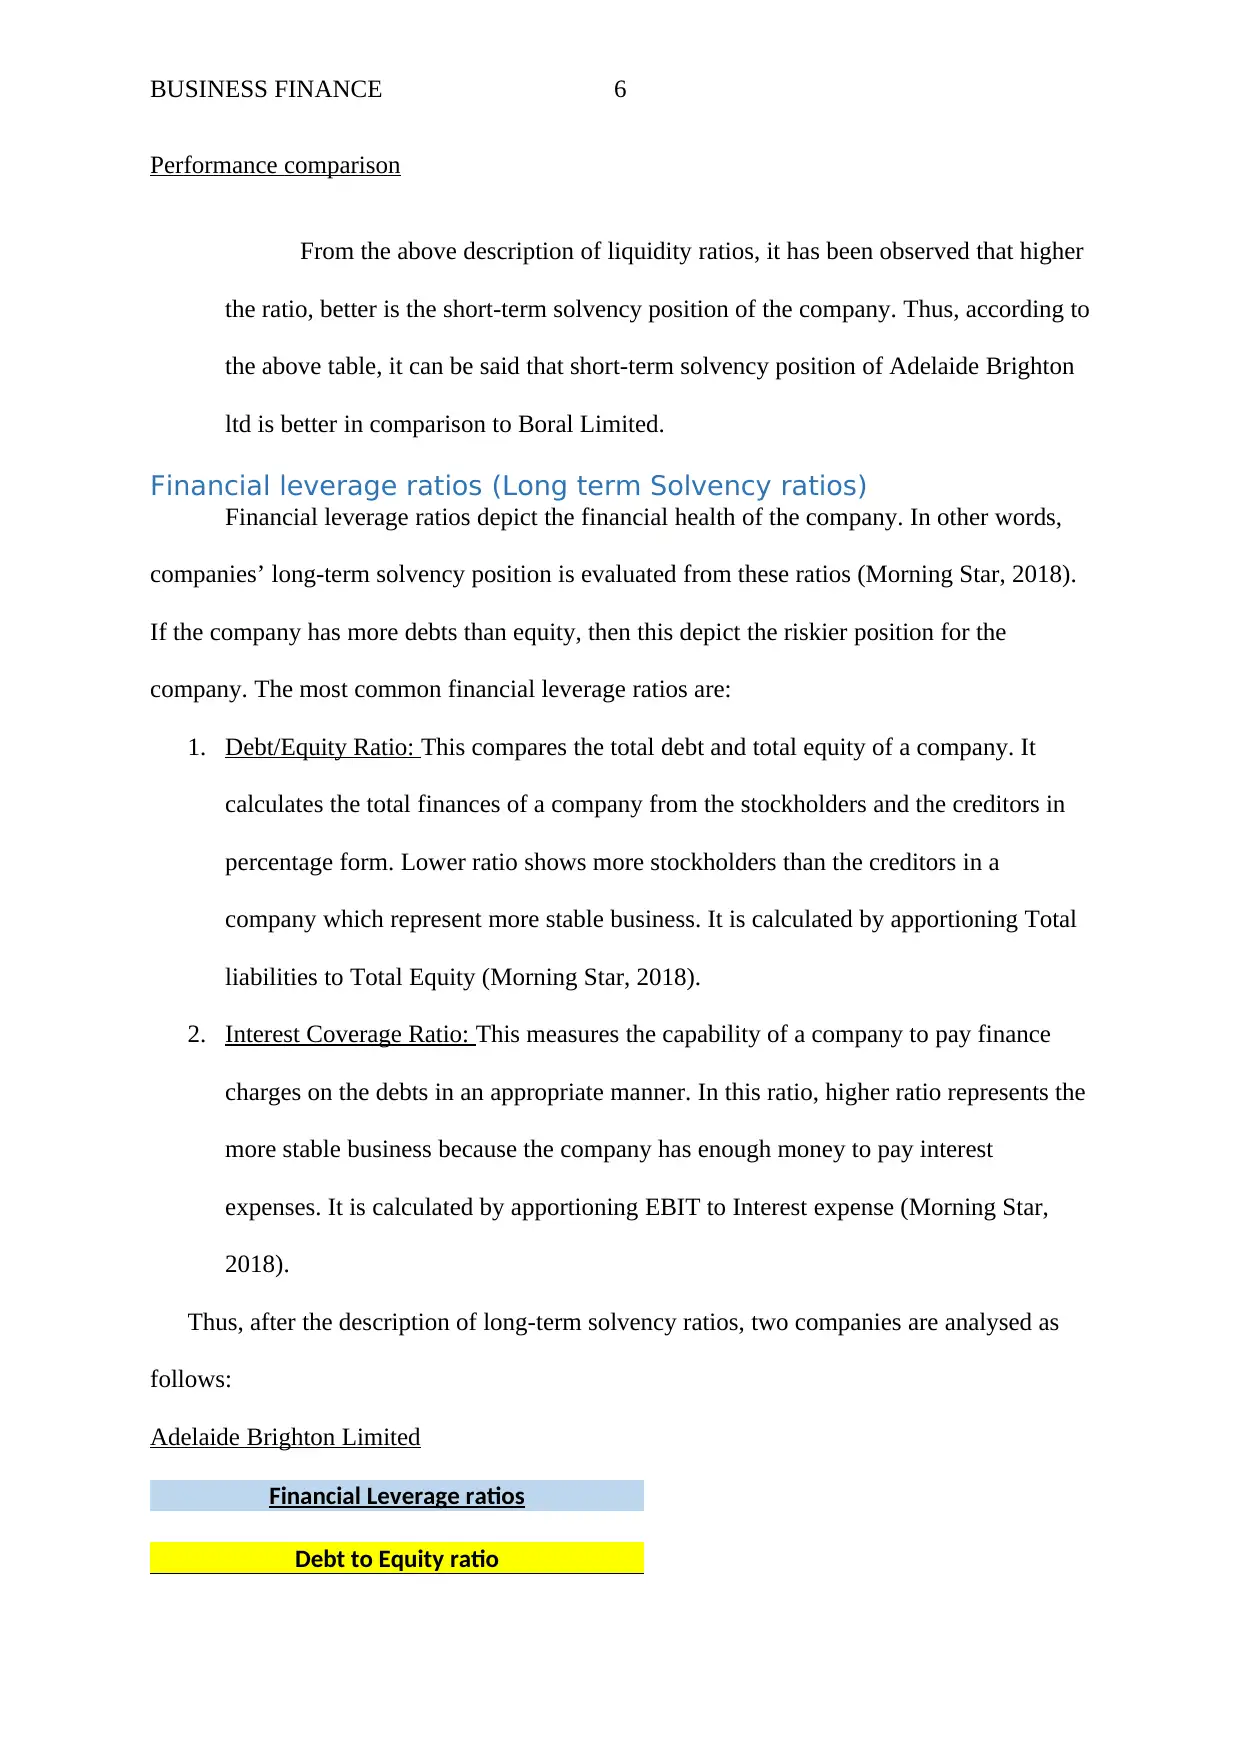
Financial leverage ratios (Long term Solvency ratios)
Financial leverage ratios depict the financial health of the company. In other words,
companies’ long-term solvency position is evaluated from these ratios (Morning Star, 2018).
If the company has more debts than equity, then this depict the riskier position for the
company. The most common financial leverage ratios are:
1. Debt/Equity Ratio: This compares the total debt and total equity of a company. It
calculates the total finances of a company from the stockholders and the creditors in
percentage form. Lower ratio shows more stockholders than the creditors in a
company which represent more stable business. It is calculated by apportioning Total
liabilities to Total Equity (Morning Star, 2018).
2. Interest Coverage Ratio: This measures the capability of a company to pay finance
charges on the debts in an appropriate manner. In this ratio, higher ratio represents the
more stable business because the company has enough money to pay interest
expenses. It is calculated by apportioning EBIT to Interest expense (Morning Star,
2018).
Thus, after the description of long-term solvency ratios, two companies are analysed as
follows:
Adelaide Brighton Limited
Financial Leverage ratios
Debt to Equity ratio
Performance comparison
From the above description of liquidity ratios, it has been observed that higher
the ratio, better is the short-term solvency position of the company. Thus, according to
the above table, it can be said that short-term solvency position of Adelaide Brighton
ltd is better in comparison to Boral Limited.
Financial leverage ratios (Long term Solvency ratios)
Financial leverage ratios depict the financial health of the company. In other words,
companies’ long-term solvency position is evaluated from these ratios (Morning Star, 2018).
If the company has more debts than equity, then this depict the riskier position for the
company. The most common financial leverage ratios are:
1. Debt/Equity Ratio: This compares the total debt and total equity of a company. It
calculates the total finances of a company from the stockholders and the creditors in
percentage form. Lower ratio shows more stockholders than the creditors in a
company which represent more stable business. It is calculated by apportioning Total
liabilities to Total Equity (Morning Star, 2018).
2. Interest Coverage Ratio: This measures the capability of a company to pay finance
charges on the debts in an appropriate manner. In this ratio, higher ratio represents the
more stable business because the company has enough money to pay interest
expenses. It is calculated by apportioning EBIT to Interest expense (Morning Star,
2018).
Thus, after the description of long-term solvency ratios, two companies are analysed as
follows:
Adelaide Brighton Limited
Financial Leverage ratios
Debt to Equity ratio
Paraphrase This Document
Need a fresh take? Get an instant paraphrase of this document with our AI Paraphraser
BUSINESS FINANCE 7
Particulars
Amount
($m)
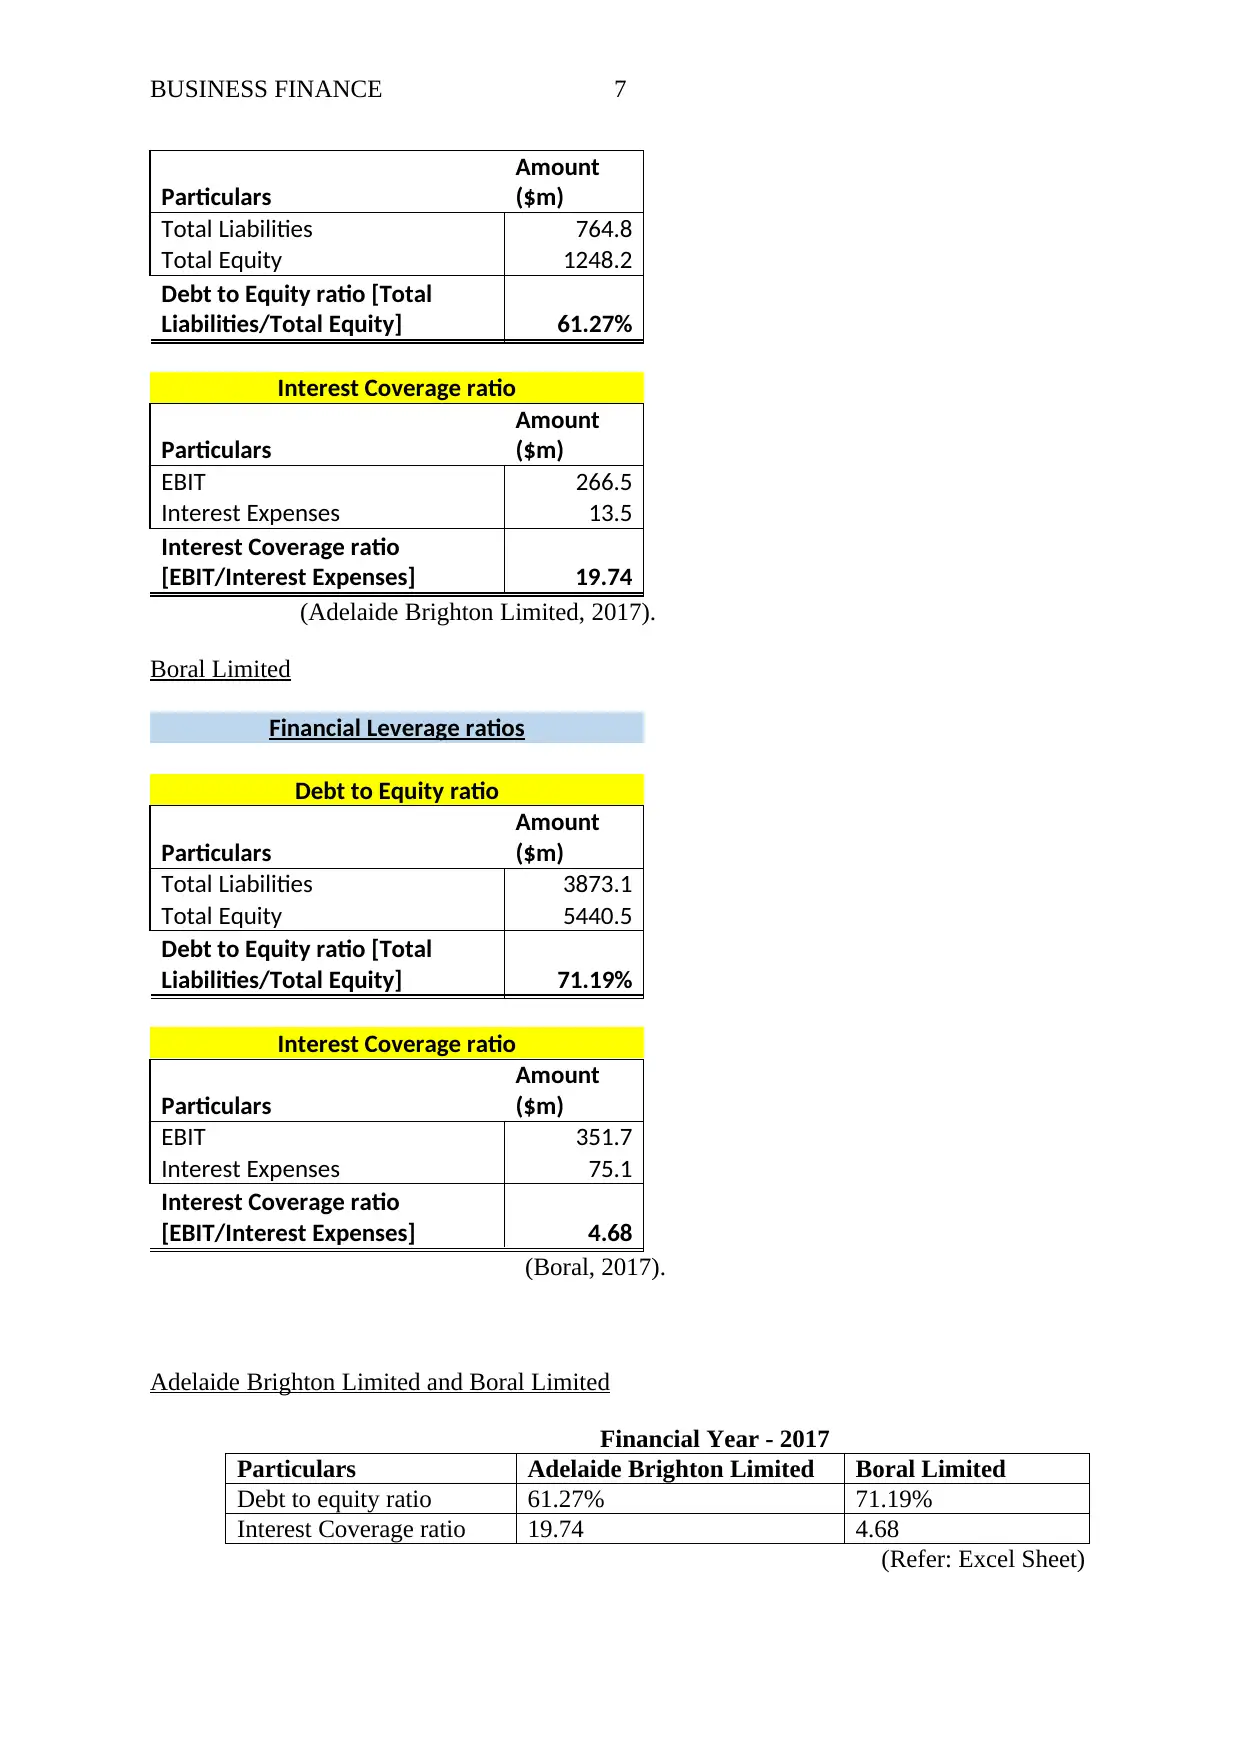
Total Liabilities 764.8
Total Equity 1248.2
Debt to Equity ratio [Total
Liabilities/Total Equity] 61.27%
Interest Coverage ratio
Particulars
Amount
($m)
EBIT 266.5
Interest Expenses 13.5
Interest Coverage ratio
[EBIT/Interest Expenses] 19.74
(Adelaide Brighton Limited, 2017).
Boral Limited
Financial Leverage ratios
Debt to Equity ratio
Particulars
Amount
($m)
Total Liabilities 3873.1
Total Equity 5440.5
Debt to Equity ratio [Total
Liabilities/Total Equity] 71.19%
Interest Coverage ratio
Particulars
Amount
($m)
EBIT 351.7
Interest Expenses 75.1
Interest Coverage ratio
[EBIT/Interest Expenses] 4.68
(Boral, 2017).
Adelaide Brighton Limited and Boral Limited
Financial Year - 2017
Particulars Adelaide Brighton Limited Boral Limited
Debt to equity ratio 61.27% 71.19%
Interest Coverage ratio 19.74 4.68
(Refer: Excel Sheet)
Particulars
Amount
($m)
Total Liabilities 764.8
Total Equity 1248.2
Debt to Equity ratio [Total
Liabilities/Total Equity] 61.27%
Interest Coverage ratio
Particulars
Amount
($m)
EBIT 266.5
Interest Expenses 13.5
Interest Coverage ratio
[EBIT/Interest Expenses] 19.74
(Adelaide Brighton Limited, 2017).
Boral Limited
Financial Leverage ratios
Debt to Equity ratio
Particulars
Amount
($m)
Total Liabilities 3873.1
Total Equity 5440.5
Debt to Equity ratio [Total
Liabilities/Total Equity] 71.19%
Interest Coverage ratio
Particulars
Amount
($m)
EBIT 351.7
Interest Expenses 75.1
Interest Coverage ratio
[EBIT/Interest Expenses] 4.68
(Boral, 2017).
Adelaide Brighton Limited and Boral Limited
Financial Year - 2017
Particulars Adelaide Brighton Limited Boral Limited
Debt to equity ratio 61.27% 71.19%
Interest Coverage ratio 19.74 4.68
(Refer: Excel Sheet)

BUSINESS FINANCE 8
Performance comparison
From the above depiction of financial leverage ratios, it has been observed that lower
ratio of debt to equity represent stable position of the company whereas higher ratio of
interest coverage represent that the company has enough money to pay interest expenses.
Thus, according to the above table, it can be said that long-term solvency position of
Adelaide Brighton ltd is better as compared to Boral Limited.
Efficiency ratios (Asset utilisation or turnover ratios)
These ratios signify the efficiency of the company in managing its assets and liabilities. It
measures the firm’s recent performance through computing the operations of a business.
Efficiency ratios are also termed as turnover ratios (Morning Star, 2018). Some of these
includes: Accounts payable turnover ratio and Accounts receivable turnover ratio.
1. Accounts Receivable turnover ratio: This ratio assesses the number of times
company’s ability to accumulate accounts receivables during the accounting period.
In other words, company’s liquidity position is also strong if they quickly convert the
receivables into cash (Morning Star, 2018). Thus, higher ratio makes sense. It is
calculated by apportioning Net revenue to average accounts receivable.
2. Accounts Payable turnover ratio: This ratio is opposite to accounts receivables
turnover ratio where this ratio assesses how many times the company’s capability to
pay off its dealers during the year. Thus, higher ratio is favourable because it shows
that the entity pays its payments on regular basis. It is calculated by apportioning Cost
of sales to average accounts payable (Morning Star, 2018).
3. Asset turnover ratio: This ratio is an asset utilisation ratio where revenue is generated
from the asset utilisation by the company. If the ratio is high, then it implies that the
company is effectively used its resources to produce the revenue. It is calculated by
apportioning Revenue to average total assets (Morning Star, 2018). Average total
⊘ This is a preview!⊘
Do you want full access?
Subscribe today to unlock all pages.
Trusted by 1+ million students worldwide
BUSINESS FINANCE 9
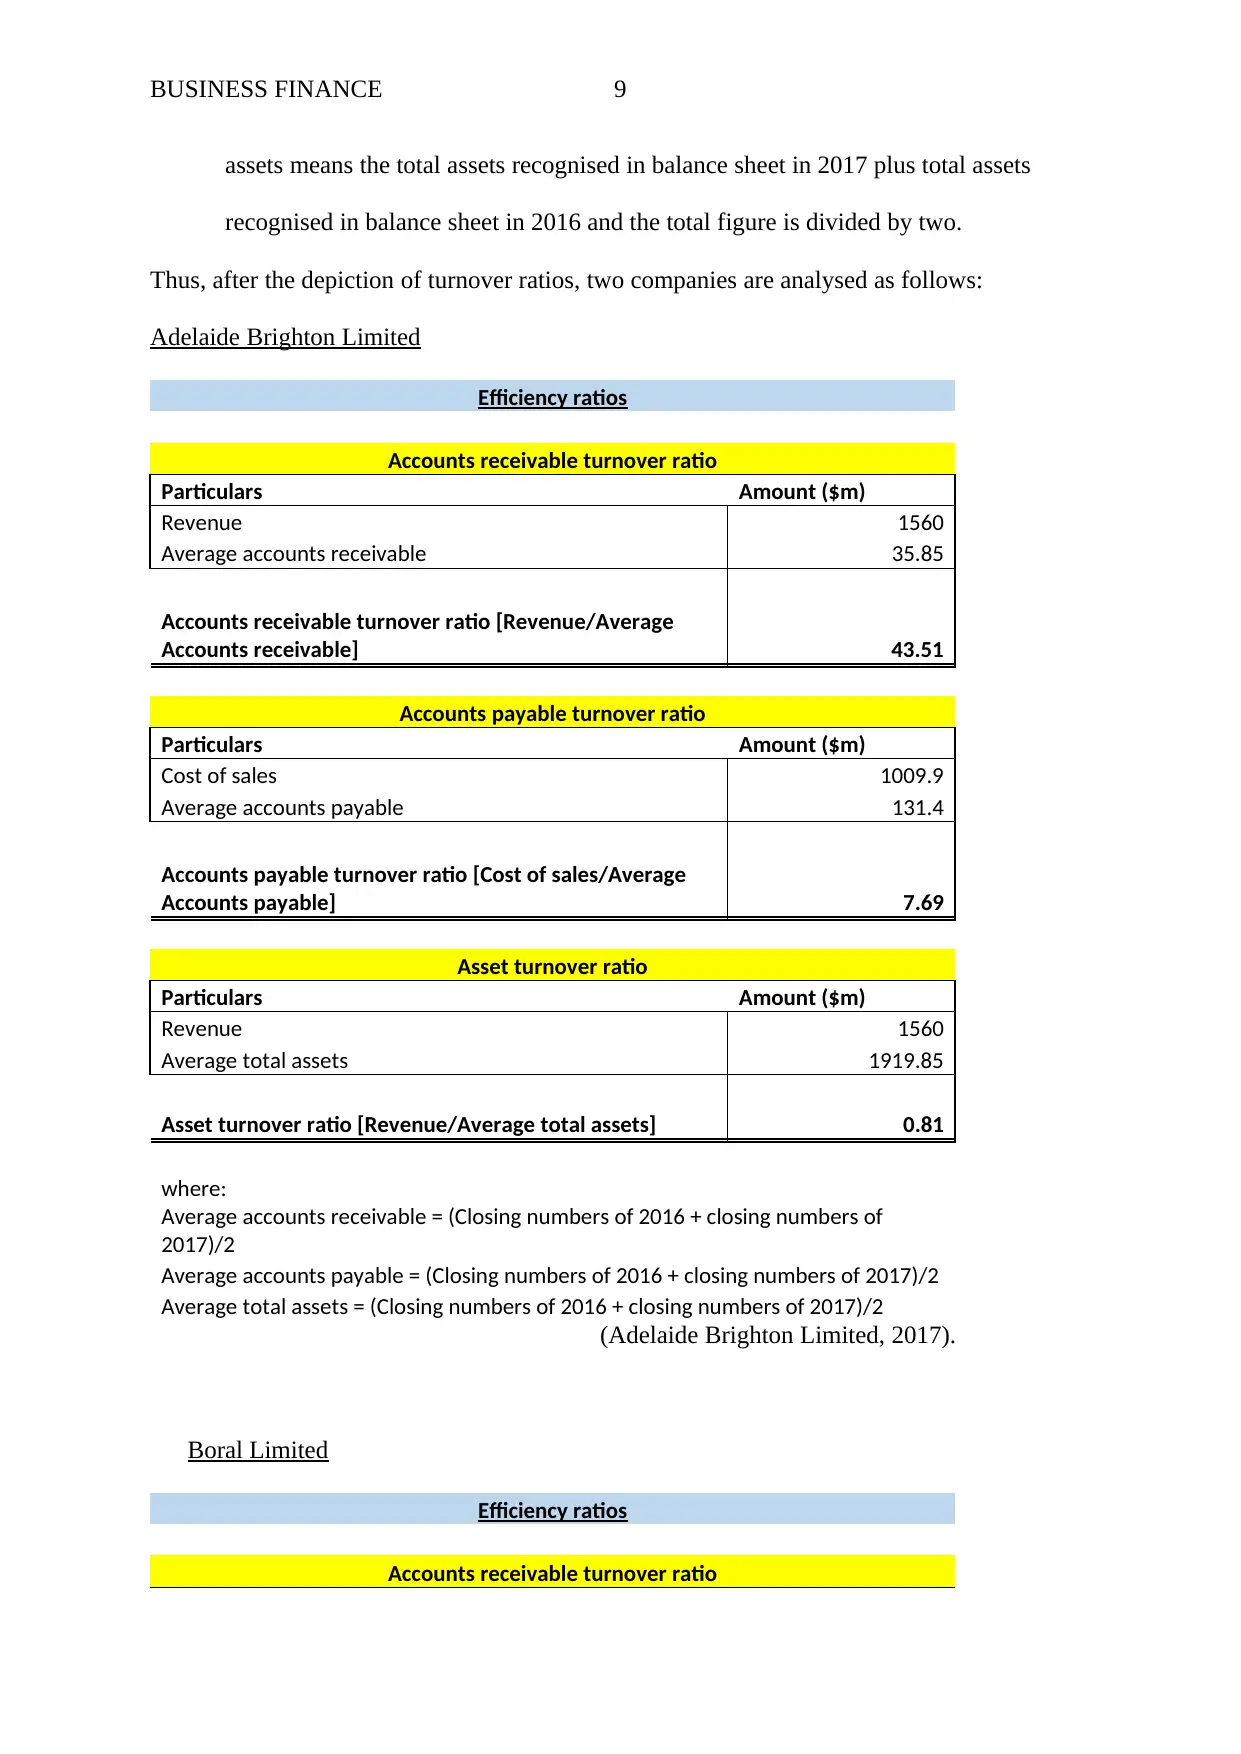
assets means the total assets recognised in balance sheet in 2017 plus total assets
recognised in balance sheet in 2016 and the total figure is divided by two.
Thus, after the depiction of turnover ratios, two companies are analysed as follows:
Adelaide Brighton Limited
Efficiency ratios
Accounts receivable turnover ratio
Particulars Amount ($m)
Revenue 1560
Average accounts receivable 35.85
Accounts receivable turnover ratio [Revenue/Average
Accounts receivable] 43.51
Accounts payable turnover ratio
Particulars Amount ($m)
Cost of sales 1009.9
Average accounts payable 131.4
Accounts payable turnover ratio [Cost of sales/Average
Accounts payable] 7.69
Asset turnover ratio
Particulars Amount ($m)
Revenue 1560
Average total assets 1919.85
Asset turnover ratio [Revenue/Average total assets] 0.81
where:
Average accounts receivable = (Closing numbers of 2016 + closing numbers of
2017)/2
Average accounts payable = (Closing numbers of 2016 + closing numbers of 2017)/2
Average total assets = (Closing numbers of 2016 + closing numbers of 2017)/2
(Adelaide Brighton Limited, 2017).
Boral Limited
Efficiency ratios
Accounts receivable turnover ratio
Paraphrase This Document
Need a fresh take? Get an instant paraphrase of this document with our AI Paraphraser
BUSINESS FINANCE 10
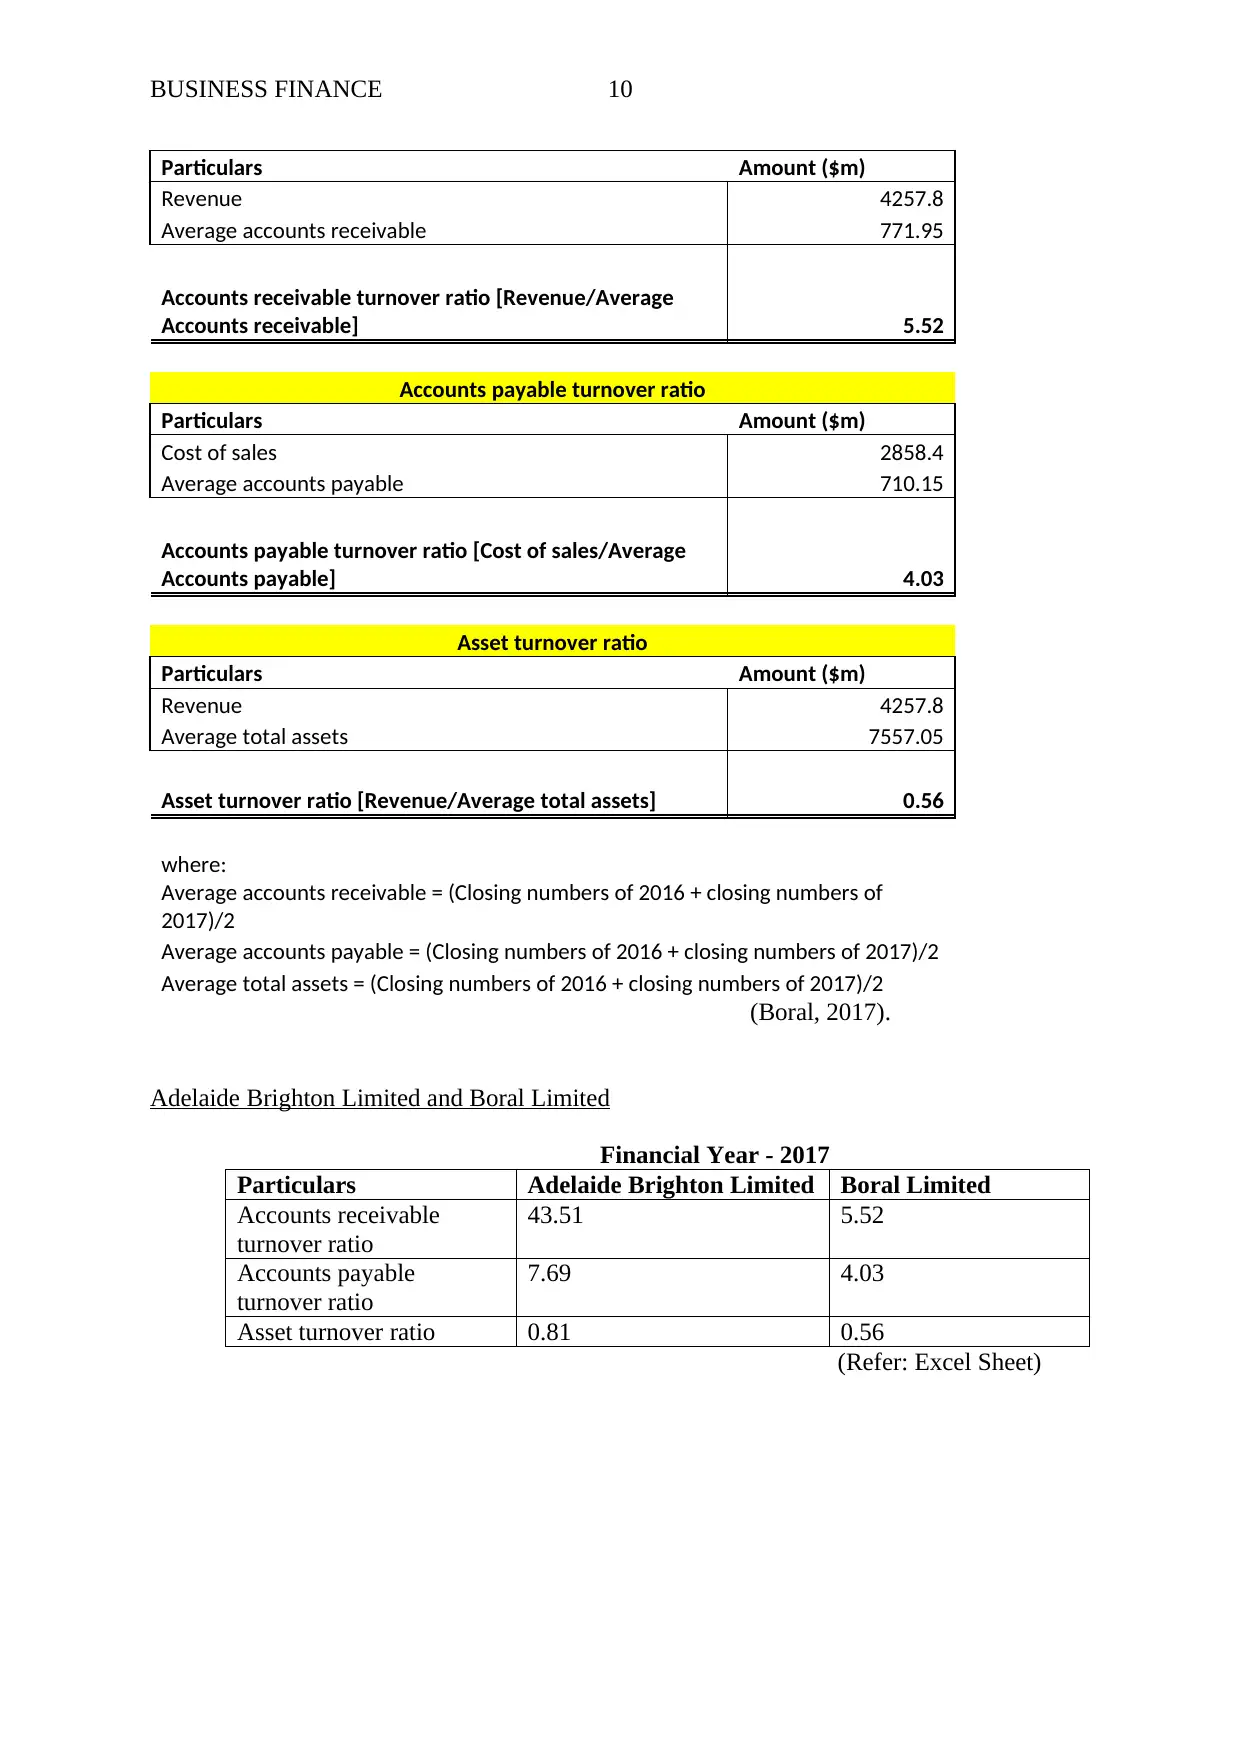
Particulars Amount ($m)
Revenue 4257.8
Average accounts receivable 771.95
Accounts receivable turnover ratio [Revenue/Average
Accounts receivable] 5.52
Accounts payable turnover ratio
Particulars Amount ($m)
Cost of sales 2858.4
Average accounts payable 710.15
Accounts payable turnover ratio [Cost of sales/Average
Accounts payable] 4.03
Asset turnover ratio
Particulars Amount ($m)
Revenue 4257.8
Average total assets 7557.05
Asset turnover ratio [Revenue/Average total assets] 0.56
where:
Average accounts receivable = (Closing numbers of 2016 + closing numbers of
2017)/2
Average accounts payable = (Closing numbers of 2016 + closing numbers of 2017)/2
Average total assets = (Closing numbers of 2016 + closing numbers of 2017)/2
(Boral, 2017).
Adelaide Brighton Limited and Boral Limited
Financial Year - 2017
Particulars Adelaide Brighton Limited Boral Limited
Accounts receivable
turnover ratio
43.51 5.52
Accounts payable
turnover ratio
7.69 4.03
Asset turnover ratio 0.81 0.56
(Refer: Excel Sheet)
Particulars Amount ($m)
Revenue 4257.8
Average accounts receivable 771.95
Accounts receivable turnover ratio [Revenue/Average
Accounts receivable] 5.52
Accounts payable turnover ratio
Particulars Amount ($m)
Cost of sales 2858.4
Average accounts payable 710.15
Accounts payable turnover ratio [Cost of sales/Average
Accounts payable] 4.03
Asset turnover ratio
Particulars Amount ($m)
Revenue 4257.8
Average total assets 7557.05
Asset turnover ratio [Revenue/Average total assets] 0.56
where:
Average accounts receivable = (Closing numbers of 2016 + closing numbers of
2017)/2
Average accounts payable = (Closing numbers of 2016 + closing numbers of 2017)/2
Average total assets = (Closing numbers of 2016 + closing numbers of 2017)/2
(Boral, 2017).
Adelaide Brighton Limited and Boral Limited
Financial Year - 2017
Particulars Adelaide Brighton Limited Boral Limited
Accounts receivable
turnover ratio
43.51 5.52
Accounts payable
turnover ratio
7.69 4.03
Asset turnover ratio 0.81 0.56
(Refer: Excel Sheet)
BUSINESS FINANCE 11
Performance comparison
From the above depiction of efficiency ratios, it has been observed that higher ratio of
accounts receivable turnover ratio, accounts payable turnover ratio and asset turnover ratio
represent solid position of the company. Thus, according to the above table, it can be said that
Adelaide Brighton limited collects its receivables about 43.51 times in an accounting period
as compared to 5.52 times in case of Boral Limited. Further, Adelaide Brighton limited pays
about 7.69 times to the vendors in an accounting period whereas Boral Limited pays only
4.03 times to the vendors in the year. Adelaide Brighton limited and Boral limited has asset
turnover ratio of 0.81 and 0.56 respectively. As a result of overall analysis it is summarised
that Adelaide Brighton limited is better than Boral Limited.
Profitability ratios
Profitability ratios are very important criteria for the assessment of company’s
profitability position during the accounting period. Stakeholders of the company is very
concerned about the profit margins earned by the company for future transactions (Morning
Star, 2018). Higher ratio is always better in evaluating productivity. These include Return on
equity and net profit margin.
1. Net Profit Margin: This ratio implies return earned by the company from per amount
of revenue. Higher ratio is always favourable because it gauges how proficiently the
company turns more sales into profits. It is computed by apportioning Net profit to
total revenue (Morning Star, 2018).
2. Return on Equity: This ratio implies the return earned by the company from the
stockholders invested money. This is very important for the prospective investors to
gauge how much funds are effectively used by the company to earn returns from their
⊘ This is a preview!⊘
Do you want full access?
Subscribe today to unlock all pages.
Trusted by 1+ million students worldwide
1 out of 21
Related Documents


Your All-in-One AI-Powered Toolkit for Academic Success.
+13062052269
info@desklib.com
Available 24*7 on WhatsApp / Email
![[object Object]](/_next/static/media/star-bottom.7253800d.svg)
Unlock your academic potential
Copyright © 2020–2026 A2Z Services. All Rights Reserved. Developed and managed by ZUCOL.