Financial Performance Evaluation of Boral Ltd: A Detailed Analysis
VerifiedAdded on 2021/05/31
|19
|4359
|349
Report
AI Summary
This report presents a comprehensive financial analysis of Boral Ltd, evaluating its performance based on various financial ratios, including short-term and long-term solvency, asset utilization, profitability, and market value. The analysis includes the ownership and governance structure, identifying key shareholders and their influence. The report examines the movement of Boral Ltd's share price against the all ordinary index, identifying significant factors impacting share price. Furthermore, it employs the Capital Asset Pricing Model (CAPM) to determine the required rate of return and assesses the weighted average cost of capital (WACC). The debt and dividend policies are also reviewed to understand the company's capital structure and financial strategy. The report concludes with investment recommendations.
Running head: FINANCE FOR BUSINESS
Finance for Business
Name of the Student
Name of the University
Authors Note
Course ID
Finance for Business
Name of the Student
Name of the University
Authors Note
Course ID
Paraphrase This Document
Need a fresh take? Get an instant paraphrase of this document with our AI Paraphraser
1FINANCE FOR BUSINESS
Table of Contents
Introduction:...............................................................................................................................3
Description of the company:......................................................................................................4
Ownership-Governance Structure of Boral Ltd:........................................................................4
Main substantial Shareholders:..............................................................................................4
Main People involved in Governance:...................................................................................5
Calculations of the Fundamental Ratios:...................................................................................6
Short-Term Solvency Ratios:.................................................................................................6
Long Term Solvency Ratios:.................................................................................................6
Asset Utilization Ratios:........................................................................................................7
Profitability Ratios:................................................................................................................7
Market Value Ratios:.............................................................................................................7
Graphical Description of Share Price Results:...........................................................................8
Monthly share price movement analysis:...............................................................................8
Significant factors influencing the share price movement:......................................................10
Calculations of the Beta values and the anticipated Rates of Return using CAPM:................11
Calculated beta of the company:..........................................................................................11
Computation of required rate of return for the company shares:.........................................11
Conservative for Investment:...............................................................................................12
Weighted Average Cost of Capital:.........................................................................................13
Computed WACC:...............................................................................................................13
2FINANCE FOR BUSINESS
Implications of higher weighted average cost of capitals from management perspective:..13
Debt Ratio:...............................................................................................................................13
Dividend Policy:.......................................................................................................................14
Letter of Recommendations.....................................................................................................14
Conclusion:..............................................................................................................................15
References................................................................................................................................16
⊘ This is a preview!⊘
Do you want full access?
Subscribe today to unlock all pages.
Trusted by 1+ million students worldwide
3FINANCE FOR BUSINESS
Introduction:
The current report is based on understanding the financial performance of the Boral
Ltd and investigating into the possibility of making investment in the company. The study
would be opening up with brief description of the company by outlining the core activities of
the organizations the market in which the company operates and the factors that contributes
to the history of the company. The report would be taking into the consideration the
ownership governance structure of the company and the main substantial shareholders that
are involved in the business. Based on the proportion of the shareholdings of the company an
argument would be presented to distinguish between the family and the non-family
indulgence on the firm’s governance.
To better understand the financial position of the company a computation of the
financial ratios would be performed that would be assessing the areas of short term and long
term financial standings of the company. Additionally the report would be considering the
efficiency, profitability and market value ratios to better gain an understanding of the firm’s
financial position.
A comparative analysis of the share price movement against the all ordinary index
would be performed to understand whether the share price are above or below volatility
range. The report would be considering the major factors that contributes to the share price
movement of the organization. The tools of capital asset pricing model will be employed to
understand the require rate of return for the company along with the conservative nature of
making an investment in Boral Ltd. The debt structure and the dividend structure would be
also gauged to understand whether the company is appropriately maintained the capital
structure. A letter of recommendations would be accompanied with valuable
recommendations relating to the possibility of making investment in the company.
Paraphrase This Document
Need a fresh take? Get an instant paraphrase of this document with our AI Paraphraser
4FINANCE FOR BUSINESS
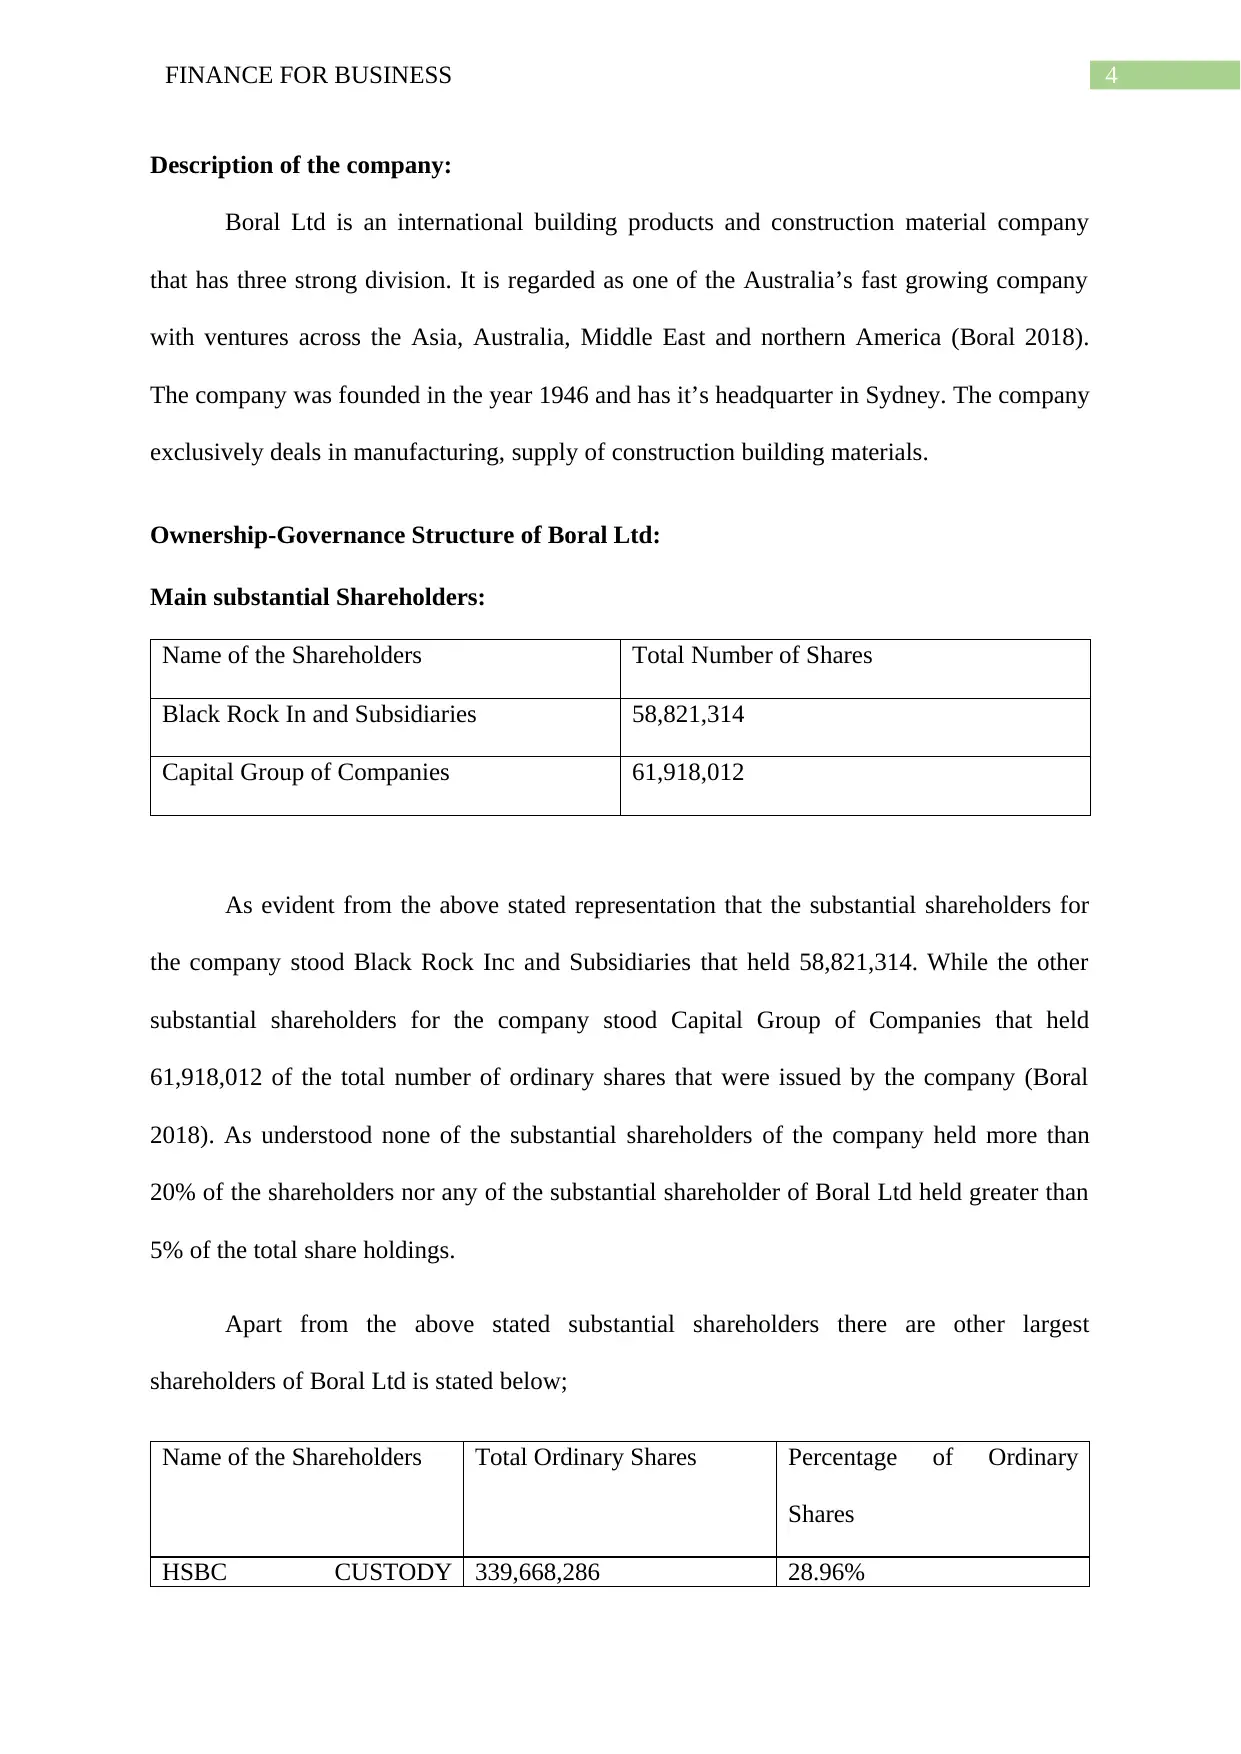
Description of the company:
Boral Ltd is an international building products and construction material company
that has three strong division. It is regarded as one of the Australia’s fast growing company
with ventures across the Asia, Australia, Middle East and northern America (Boral 2018).
The company was founded in the year 1946 and has it’s headquarter in Sydney. The company
exclusively deals in manufacturing, supply of construction building materials.
Ownership-Governance Structure of Boral Ltd:
Main substantial Shareholders:
Name of the Shareholders Total Number of Shares
Black Rock In and Subsidiaries 58,821,314
Capital Group of Companies 61,918,012
As evident from the above stated representation that the substantial shareholders for
the company stood Black Rock Inc and Subsidiaries that held 58,821,314. While the other
substantial shareholders for the company stood Capital Group of Companies that held
61,918,012 of the total number of ordinary shares that were issued by the company (Boral
2018). As understood none of the substantial shareholders of the company held more than
20% of the shareholders nor any of the substantial shareholder of Boral Ltd held greater than
5% of the total share holdings.
Apart from the above stated substantial shareholders there are other largest
shareholders of Boral Ltd is stated below;
Name of the Shareholders Total Ordinary Shares Percentage of Ordinary
Shares
HSBC CUSTODY 339,668,286 28.96%
5FINANCE FOR BUSINESS
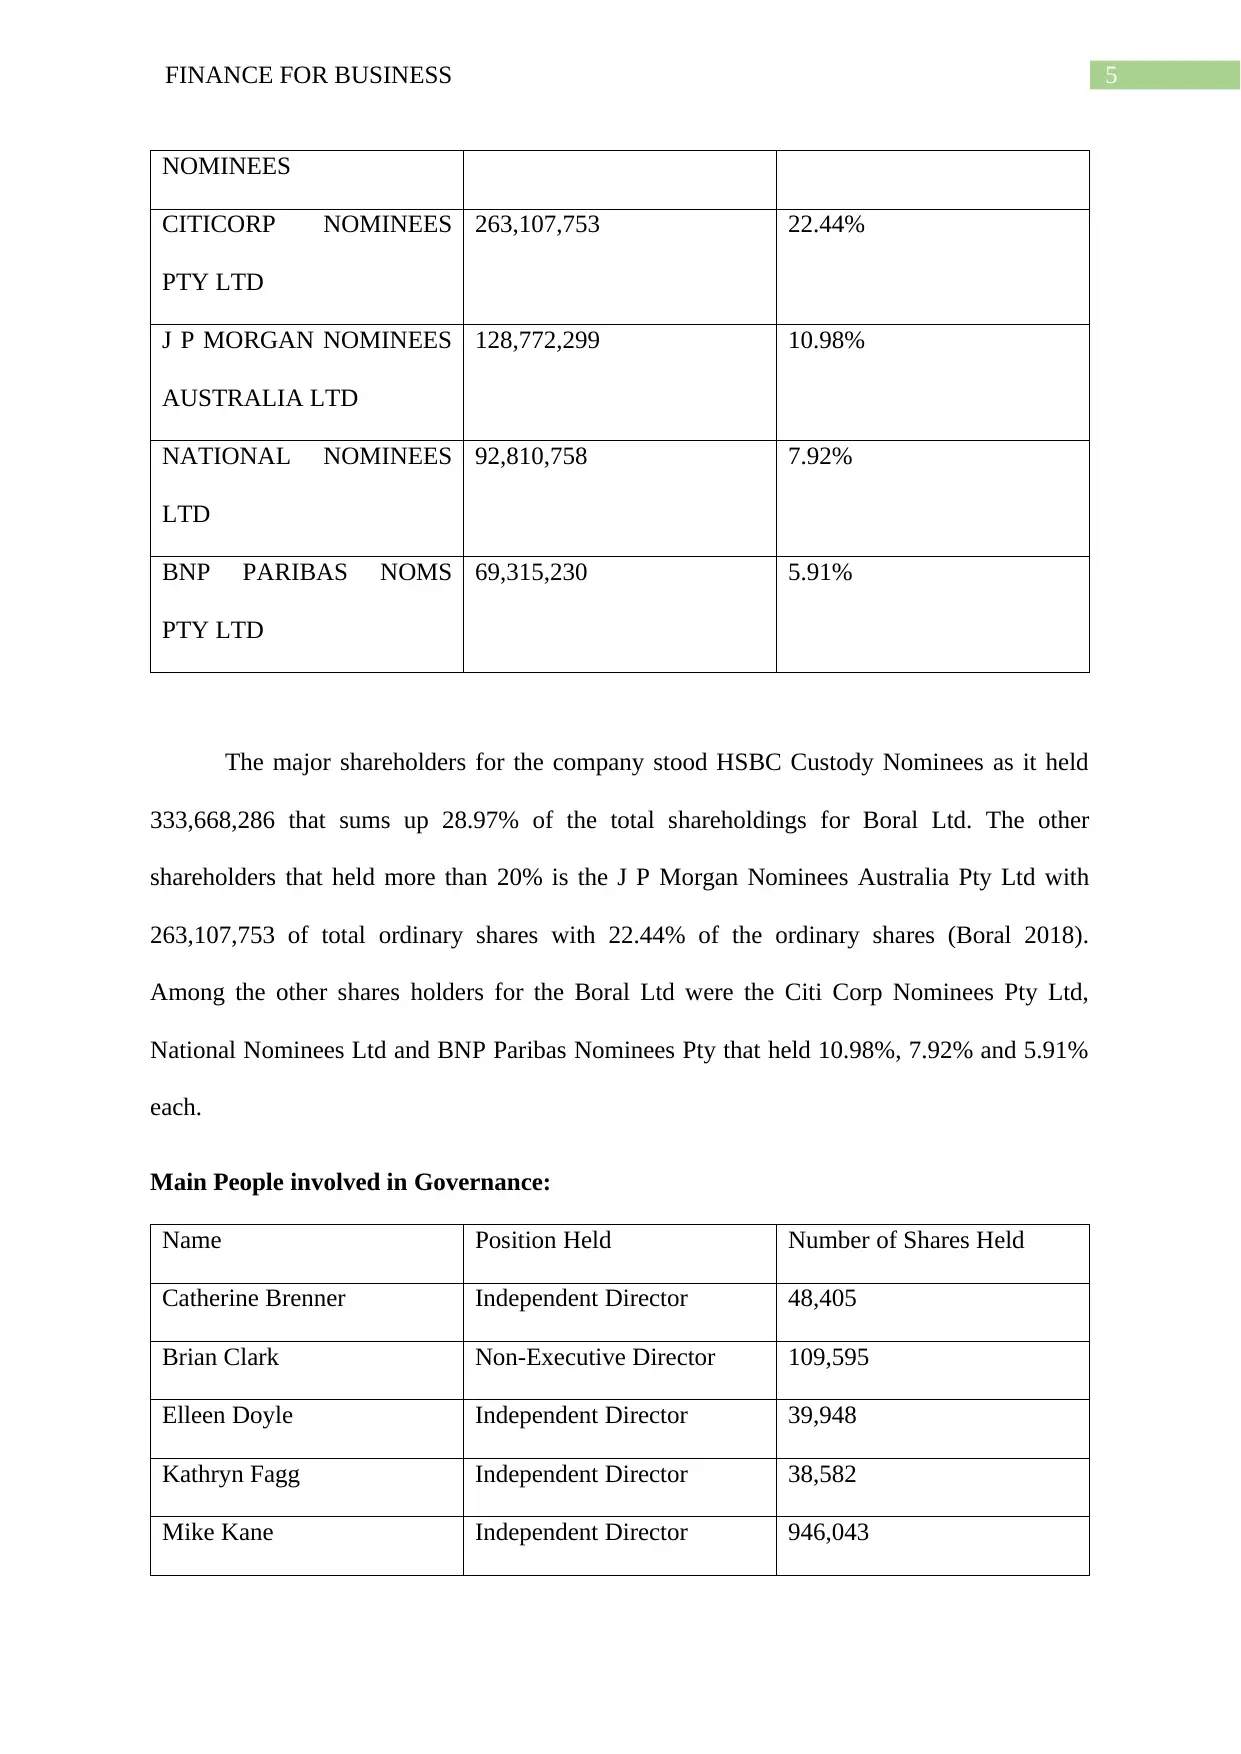
NOMINEES
CITICORP NOMINEES
PTY LTD
263,107,753 22.44%
J P MORGAN NOMINEES
AUSTRALIA LTD
128,772,299 10.98%
NATIONAL NOMINEES
LTD
92,810,758 7.92%
BNP PARIBAS NOMS
PTY LTD
69,315,230 5.91%
The major shareholders for the company stood HSBC Custody Nominees as it held
333,668,286 that sums up 28.97% of the total shareholdings for Boral Ltd. The other
shareholders that held more than 20% is the J P Morgan Nominees Australia Pty Ltd with
263,107,753 of total ordinary shares with 22.44% of the ordinary shares (Boral 2018).
Among the other shares holders for the Boral Ltd were the Citi Corp Nominees Pty Ltd,
National Nominees Ltd and BNP Paribas Nominees Pty that held 10.98%, 7.92% and 5.91%
each.
Main People involved in Governance:
Name Position Held Number of Shares Held
Catherine Brenner Independent Director 48,405
Brian Clark Non-Executive Director 109,595
Elleen Doyle Independent Director 39,948
Kathryn Fagg Independent Director 38,582
Mike Kane Independent Director 946,043
⊘ This is a preview!⊘
Do you want full access?
Subscribe today to unlock all pages.
Trusted by 1+ million students worldwide
6FINANCE FOR BUSINESS
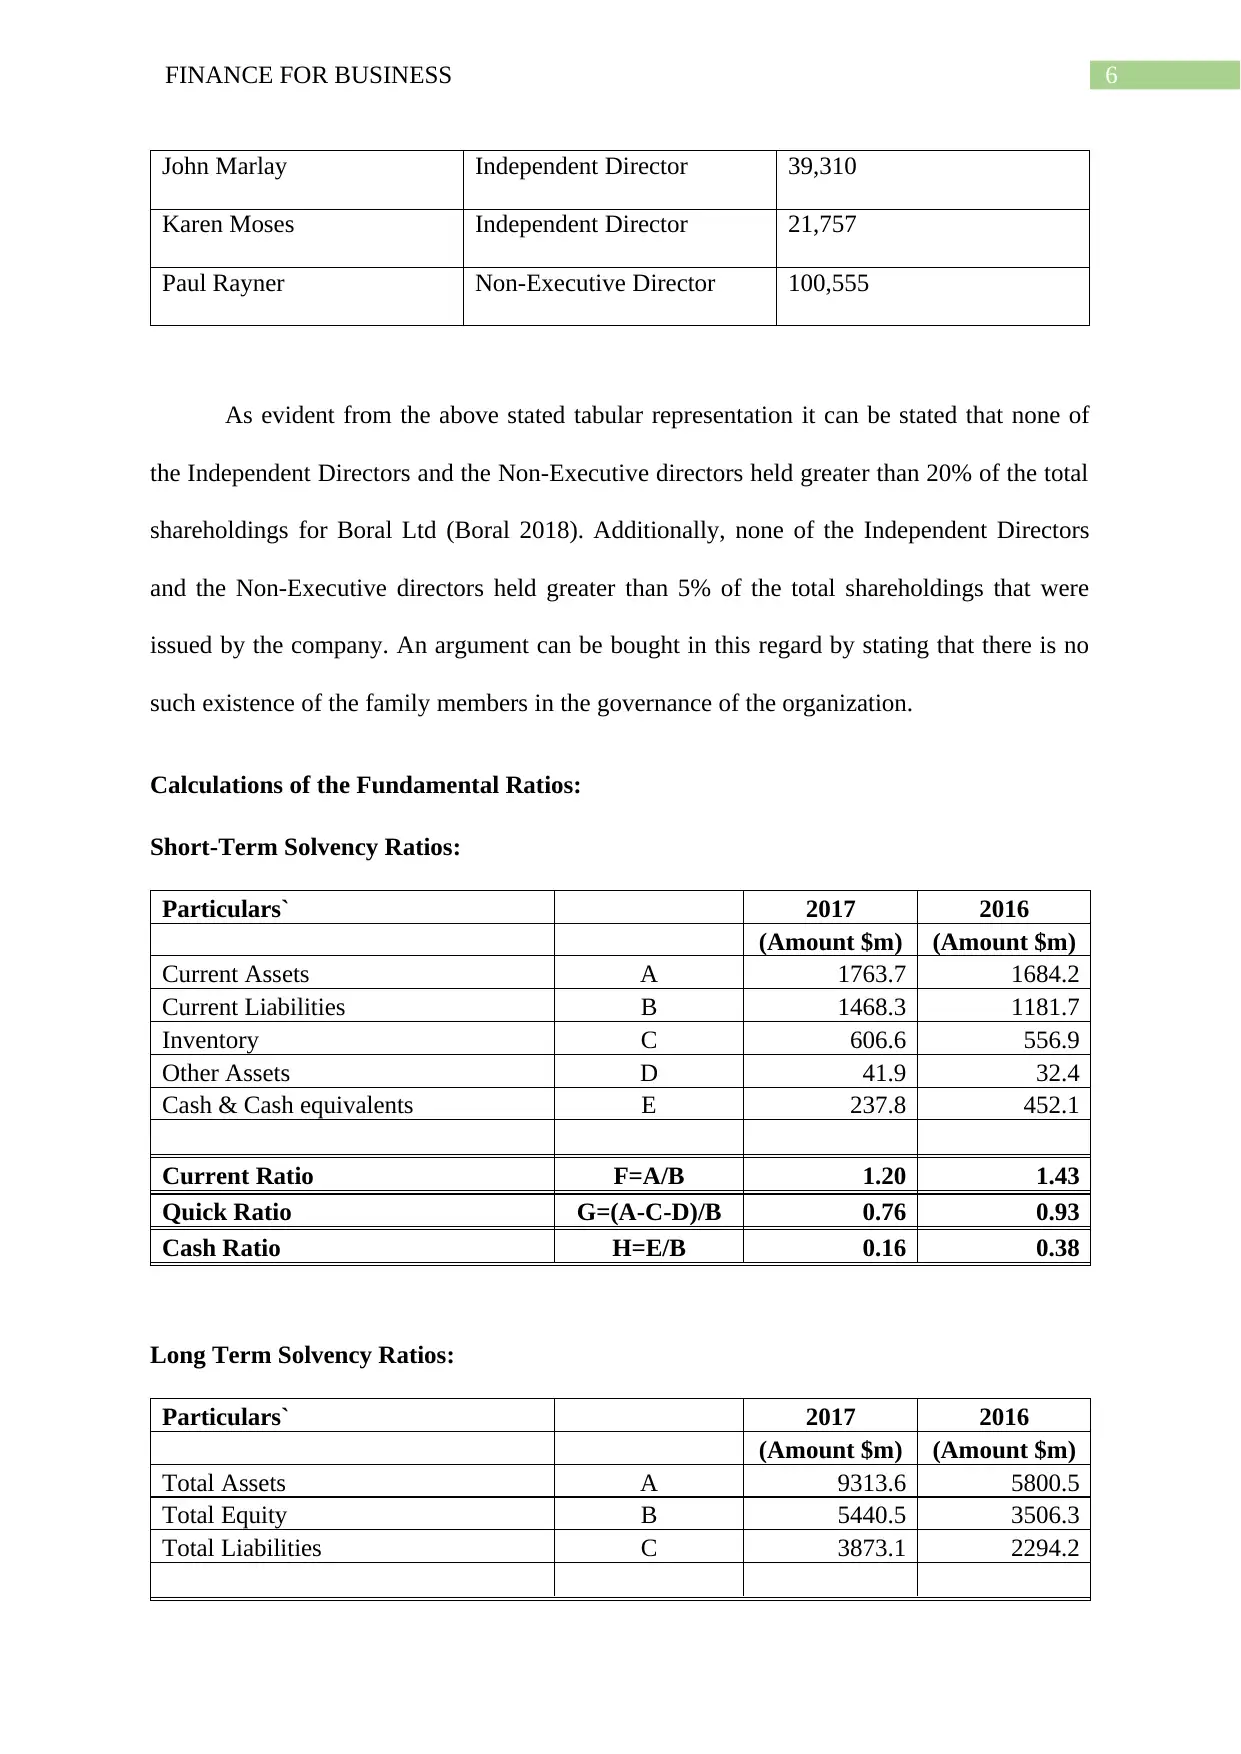
John Marlay Independent Director 39,310
Karen Moses Independent Director 21,757
Paul Rayner Non-Executive Director 100,555
As evident from the above stated tabular representation it can be stated that none of
the Independent Directors and the Non-Executive directors held greater than 20% of the total
shareholdings for Boral Ltd (Boral 2018). Additionally, none of the Independent Directors
and the Non-Executive directors held greater than 5% of the total shareholdings that were
issued by the company. An argument can be bought in this regard by stating that there is no
such existence of the family members in the governance of the organization.
Calculations of the Fundamental Ratios:
Short-Term Solvency Ratios:
Particulars` 2017 2016
(Amount $m) (Amount $m)
Current Assets A 1763.7 1684.2
Current Liabilities B 1468.3 1181.7
Inventory C 606.6 556.9
Other Assets D 41.9 32.4
Cash & Cash equivalents E 237.8 452.1
Current Ratio F=A/B 1.20 1.43
Quick Ratio G=(A-C-D)/B 0.76 0.93
Cash Ratio H=E/B 0.16 0.38
Long Term Solvency Ratios:
Particulars` 2017 2016
(Amount $m) (Amount $m)
Total Assets A 9313.6 5800.5
Total Equity B 5440.5 3506.3
Total Liabilities C 3873.1 2294.2
Paraphrase This Document
Need a fresh take? Get an instant paraphrase of this document with our AI Paraphraser
7FINANCE FOR BUSINESS
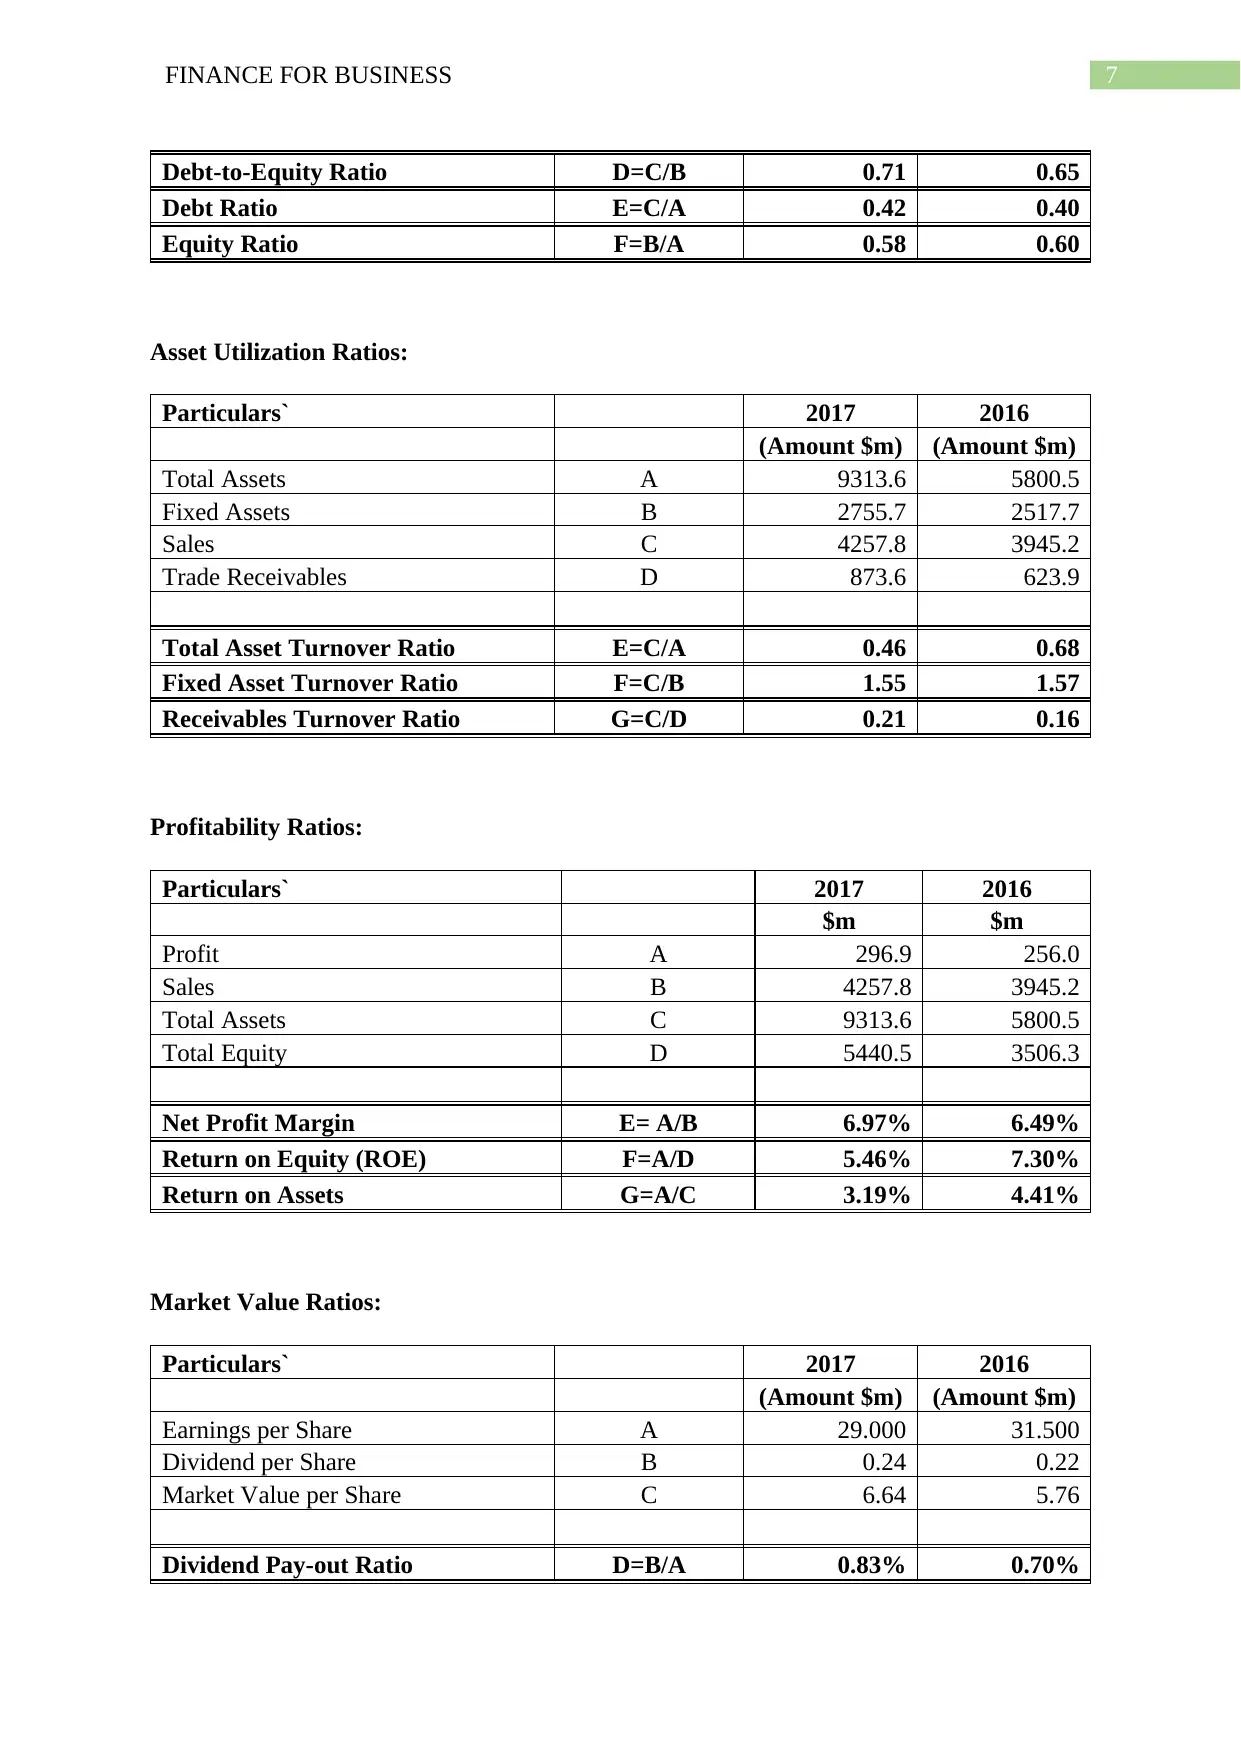
Debt-to-Equity Ratio D=C/B 0.71 0.65
Debt Ratio E=C/A 0.42 0.40
Equity Ratio F=B/A 0.58 0.60
Asset Utilization Ratios:
Particulars` 2017 2016
(Amount $m) (Amount $m)
Total Assets A 9313.6 5800.5
Fixed Assets B 2755.7 2517.7
Sales C 4257.8 3945.2
Trade Receivables D 873.6 623.9
Total Asset Turnover Ratio E=C/A 0.46 0.68
Fixed Asset Turnover Ratio F=C/B 1.55 1.57
Receivables Turnover Ratio G=C/D 0.21 0.16
Profitability Ratios:
Particulars` 2017 2016
$m $m
Profit A 296.9 256.0
Sales B 4257.8 3945.2
Total Assets C 9313.6 5800.5
Total Equity D 5440.5 3506.3
Net Profit Margin E= A/B 6.97% 6.49%
Return on Equity (ROE) F=A/D 5.46% 7.30%
Return on Assets G=A/C 3.19% 4.41%
Market Value Ratios:
Particulars` 2017 2016
(Amount $m) (Amount $m)
Earnings per Share A 29.000 31.500
Dividend per Share B 0.24 0.22
Market Value per Share C 6.64 5.76
Dividend Pay-out Ratio D=B/A 0.83% 0.70%
8FINANCE FOR BUSINESS
Dividend Yield Rate E=B/C 3.61% 3.82%
Price-to-Earnings Ratio F=C/A 0.23 0.18
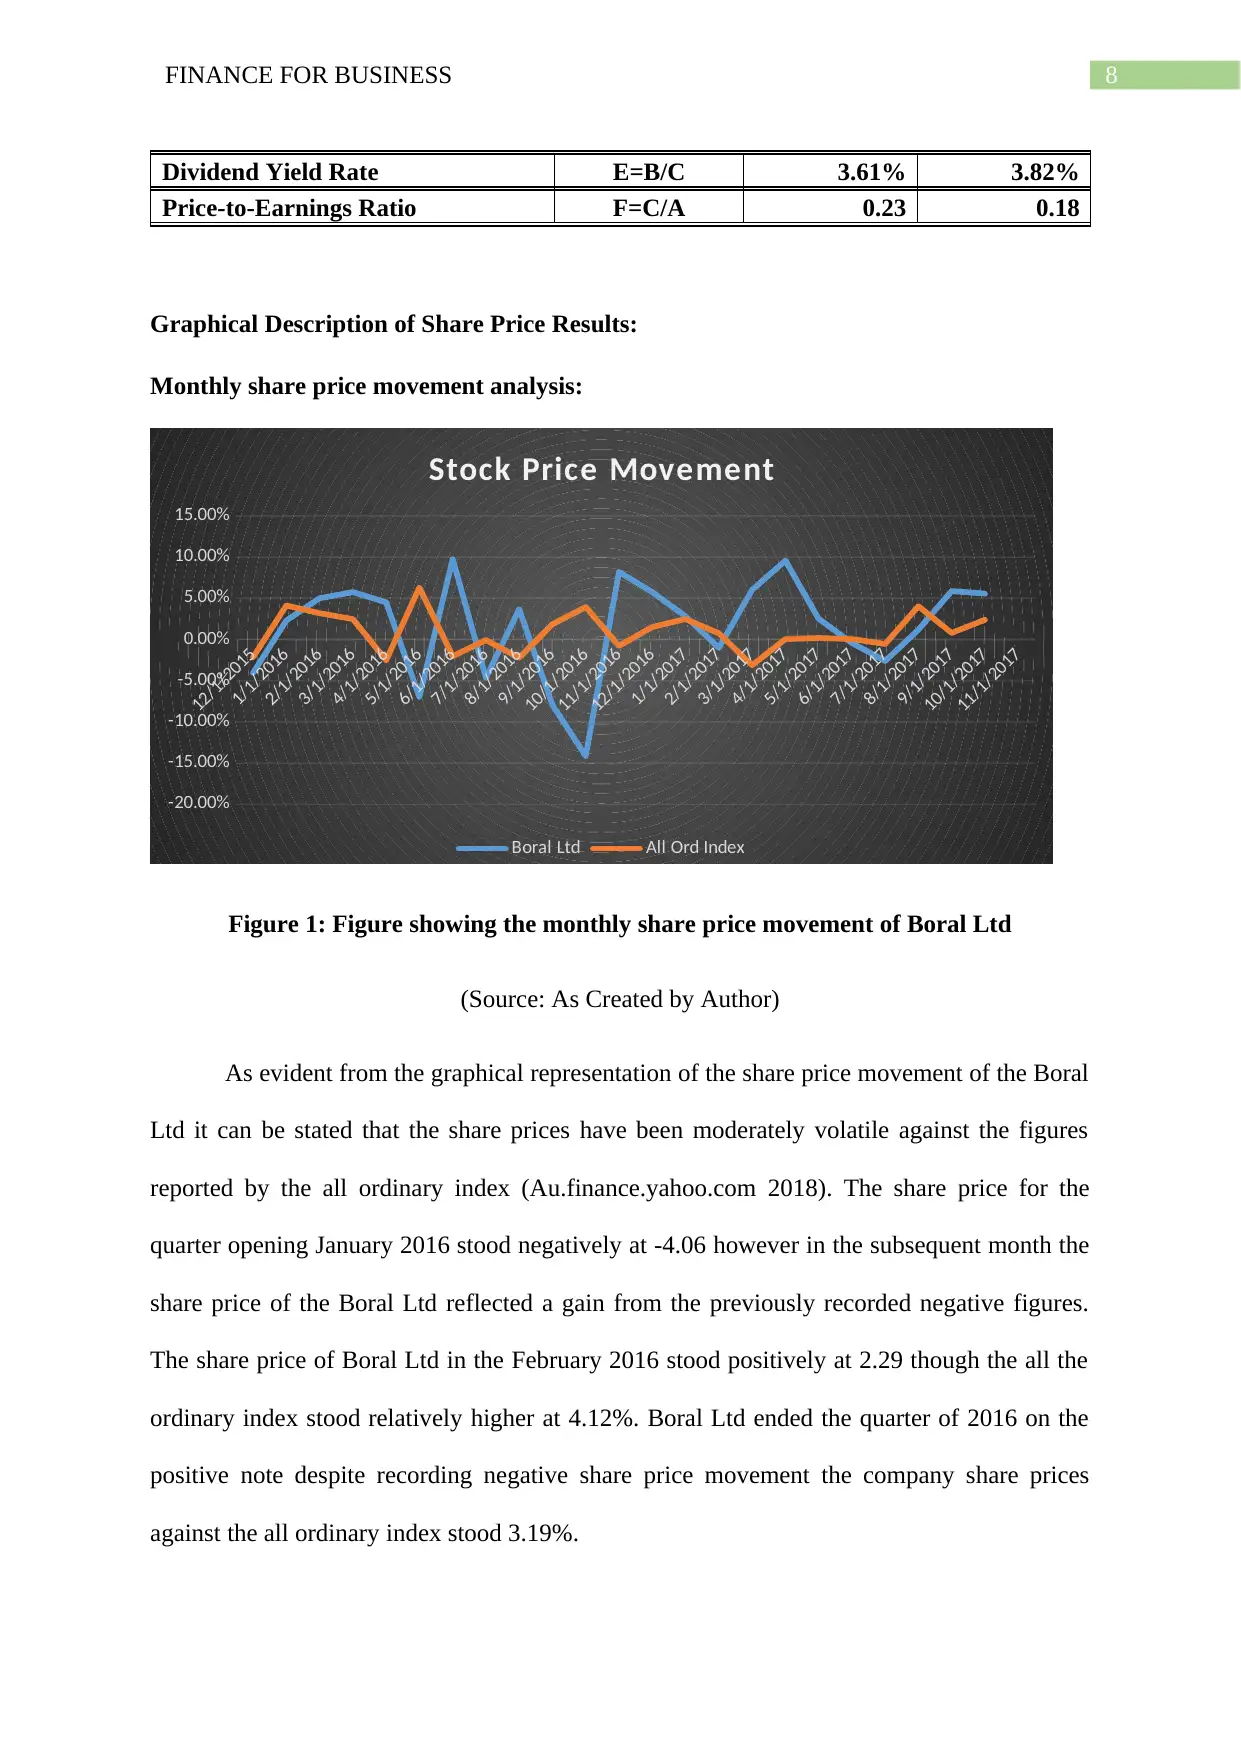
Graphical Description of Share Price Results:
Monthly share price movement analysis:
12/1/2015
1/1/2016
2/1/2016
3/1/2016
4/1/2016
5/1/2016
6/1/2016
7/1/2016
8/1/2016
9/1/2016
10/1/2016
11/1/2016
12/1/2016
1/1/2017
2/1/2017
3/1/2017
4/1/2017
5/1/2017
6/1/2017
7/1/2017
8/1/2017
9/1/2017
10/1/2017
11/1/2017
-20.00%
-15.00%
-10.00%
-5.00%
0.00%
5.00%
10.00%
15.00%
Stock Price Movement
Boral Ltd All Ord Index
Figure 1: Figure showing the monthly share price movement of Boral Ltd
(Source: As Created by Author)
As evident from the graphical representation of the share price movement of the Boral
Ltd it can be stated that the share prices have been moderately volatile against the figures
reported by the all ordinary index (Au.finance.yahoo.com 2018). The share price for the
quarter opening January 2016 stood negatively at -4.06 however in the subsequent month the
share price of the Boral Ltd reflected a gain from the previously recorded negative figures.
The share price of Boral Ltd in the February 2016 stood positively at 2.29 though the all the
ordinary index stood relatively higher at 4.12%. Boral Ltd ended the quarter of 2016 on the
positive note despite recording negative share price movement the company share prices
against the all ordinary index stood 3.19%.
Dividend Yield Rate E=B/C 3.61% 3.82%
Price-to-Earnings Ratio F=C/A 0.23 0.18
Graphical Description of Share Price Results:
Monthly share price movement analysis:
12/1/2015
1/1/2016
2/1/2016
3/1/2016
4/1/2016
5/1/2016
6/1/2016
7/1/2016
8/1/2016
9/1/2016
10/1/2016
11/1/2016
12/1/2016
1/1/2017
2/1/2017
3/1/2017
4/1/2017
5/1/2017
6/1/2017
7/1/2017
8/1/2017
9/1/2017
10/1/2017
11/1/2017
-20.00%
-15.00%
-10.00%
-5.00%
0.00%
5.00%
10.00%
15.00%
Stock Price Movement
Boral Ltd All Ord Index
Figure 1: Figure showing the monthly share price movement of Boral Ltd
(Source: As Created by Author)
As evident from the graphical representation of the share price movement of the Boral
Ltd it can be stated that the share prices have been moderately volatile against the figures
reported by the all ordinary index (Au.finance.yahoo.com 2018). The share price for the
quarter opening January 2016 stood negatively at -4.06 however in the subsequent month the
share price of the Boral Ltd reflected a gain from the previously recorded negative figures.
The share price of Boral Ltd in the February 2016 stood positively at 2.29 though the all the
ordinary index stood relatively higher at 4.12%. Boral Ltd ended the quarter of 2016 on the
positive note despite recording negative share price movement the company share prices
against the all ordinary index stood 3.19%.
⊘ This is a preview!⊘
Do you want full access?
Subscribe today to unlock all pages.
Trusted by 1+ million students worldwide
9FINANCE FOR BUSINESS
The subsequent quarter though started on the positive note as unlike the previous
quarter the share prices of Boral Ltd opened positively at 5.75% against the lowly all ordinary
index of 2.48% (Chadha 2018). In the subsequent month of May, the second quarter of 2016
reported a lower share prices but stood positively against the negatively standing all ordinary
index of -2.52. The quarter ending month of June recorded a much volatile share price
movement as the shares of Boral Ltd stood negatively at 6.98% against the positive all
ordinary index of 6.28%. The third quarter of 2016 stood relatively tentative with share price
of Boral Ltd climbing a mountain high of 9.74% highest then the any previous month against
negatively standing all ordinary index of -2.03 while in the subsequent month of August
reported a negatively standing share prices of 4.66%. Gauging into the share price movement
of Boral Ltd it can be stated that there are certain accusations where the share prices have
reflected volatility.
Greater amount of volatility was recorded during the final quarter of 2016 where the
share prices of Boral Ltd dipped as low as -14.15% against the positively standing all
ordinary index of 3.94% (Editorial 2018). However the company reported a positive share
price movement in the final quarter ending of December 2016 where the share prices of Boral
Ltd stood second highest of 8.20% after recording a previous highest of 9.74% in the opening
third quarter of July.
Moving fast forward to the following year of 2017 the share prices of Boral Ltd stood
relatively less volatile except on certain occasion’s primary due to the market forces
(Finance.yahoo.com 2018). The share price of Boral Ltd for the opening month of January
2017 stood positively at 5.73% against the lowly standing all ordinary index of 1.52%.
Though first quarter of 2017 began strongly but the share prices of Boral Ltd dipped to stand
negatively at -1.02 against the lowly standing all ordinary index of 0.74% (Squartini et al.
Paraphrase This Document
Need a fresh take? Get an instant paraphrase of this document with our AI Paraphraser
10FINANCE FOR BUSINESS
2017). The company reported a strong second quarter of 2017 as the share prices represented
a strong trend in growth.
During the opening second quarter of April 2017 the share prices of Boral Ltd stood
strong at 6.01% against the negatively standing all ordinary index of -3.13%. The share prices
increased too strongly in the following month to stand at 9.53% which was the highest over
the span of 12 months (Newberry 2018). Though an instances of negative growth was
witnessed in the penultimate quarter of 2017 where the share price dipped to a low of -2.61
however in the final quarter of 2017 the share prices gained to close positively at 5.56%
against the low all ordinary index of 2.39%. Based on the above stated analysis it can be
stated the share price of Boral Ltd is moderately volatile.
Significant factors influencing the share price movement:
One of the significant that impacted the share price movement of the price is the
“change in the management focus” of acquisition of the US buildings products for an
amount of US $2.6. This resulted the shareholders to dump the shares based on the
uncertainty surrounding the acquisition (Simply Wall St 2018). An acquisition of such kind
results in creation of uncertainty among the shareholders that explains the probable reason for
influencing the share price of Boral Ltd.
Another factor that creates an influence on the share price movement of the Boral Ltd
is the “Management earnings forecast” the company recently announced the good news to
the shareholders with an increase in the half-yearly profits (Deegan 2013). This provides the
possible reason for a certain rise in the share price of Boral Ltd and might be forecasted
increase in the profits of the company in future may result in significant reaction among the
shareholders (McKay and Haque 2016).
11FINANCE FOR BUSINESS
The “macroeconomic factors” that contributed to the share price movement is the
slowing housing market (Zabarankin, Pavlikov and Uryasev 2014). With slowing amount of
housing market the share price declined on certain occasions however the infrastructure boom
in the US markets have steadied the ship but the share prices of Boral Ltd continue to
underperform against the other market players.
The “changes in the analyst forecast” is another factor that contributed to the share
price movement of the Boral Ltd (Scott 2015). In the report published analyst suggested
Boral as the crème of the large building and construction stocks with forecast share price of
$7.20 in the upcoming twelve months and earnings growth of 31% in the year 2017-18.
The factors suggest that Boral Ltd is a high growth stocks but the lower closing stock
price may some investors wondering whether to make investment in the shares of Boral Ltd
(Schaltegger and Burritt 2017). The investors may be attracted to the high growth potential in
the upcoming future that could be considered as one the viable reason for making an
investment in the shares of Boral Ltd.
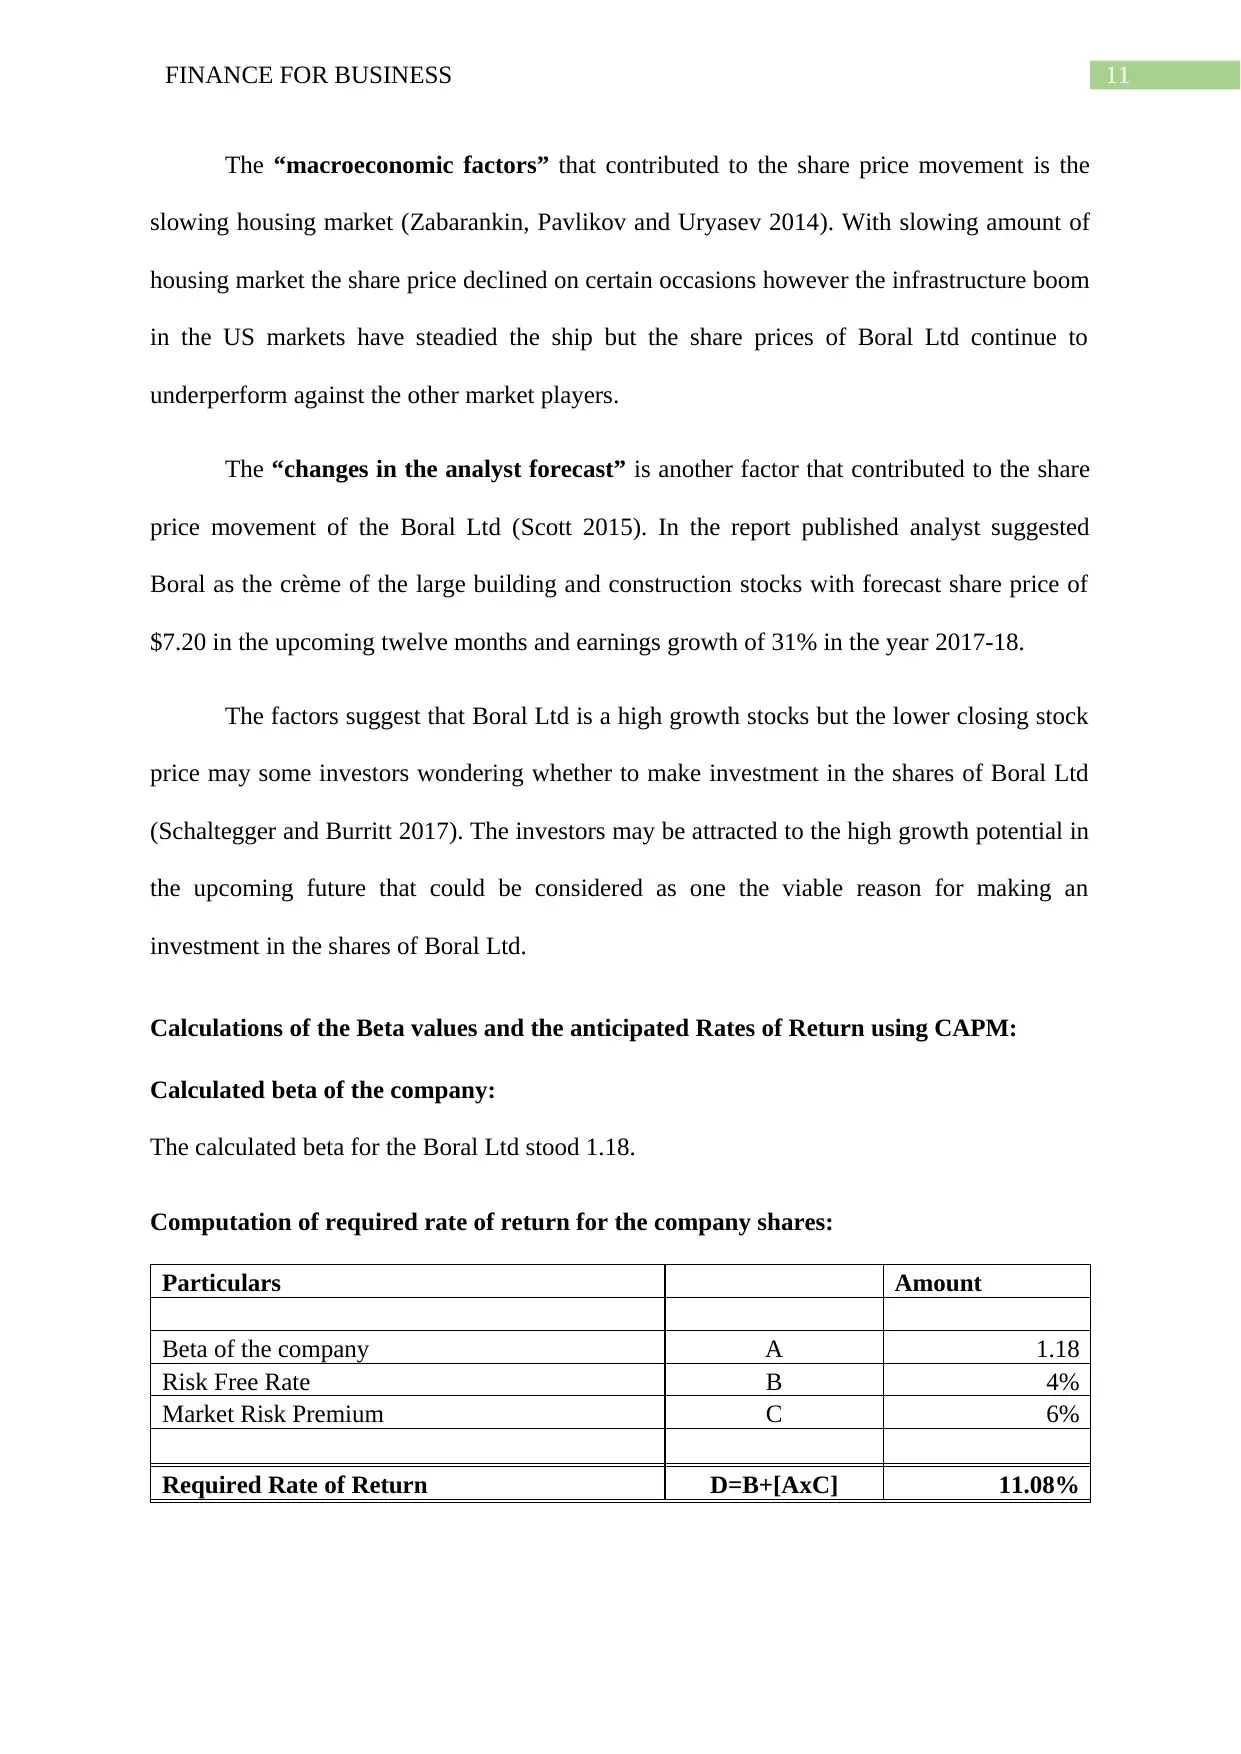
Calculations of the Beta values and the anticipated Rates of Return using CAPM:
Calculated beta of the company:
The calculated beta for the Boral Ltd stood 1.18.
Computation of required rate of return for the company shares:
Particulars Amount
Beta of the company A 1.18
Risk Free Rate B 4%
Market Risk Premium C 6%
Required Rate of Return D=B+[AxC] 11.08%
The “macroeconomic factors” that contributed to the share price movement is the
slowing housing market (Zabarankin, Pavlikov and Uryasev 2014). With slowing amount of
housing market the share price declined on certain occasions however the infrastructure boom
in the US markets have steadied the ship but the share prices of Boral Ltd continue to
underperform against the other market players.
The “changes in the analyst forecast” is another factor that contributed to the share
price movement of the Boral Ltd (Scott 2015). In the report published analyst suggested
Boral as the crème of the large building and construction stocks with forecast share price of
$7.20 in the upcoming twelve months and earnings growth of 31% in the year 2017-18.
The factors suggest that Boral Ltd is a high growth stocks but the lower closing stock
price may some investors wondering whether to make investment in the shares of Boral Ltd
(Schaltegger and Burritt 2017). The investors may be attracted to the high growth potential in
the upcoming future that could be considered as one the viable reason for making an
investment in the shares of Boral Ltd.
Calculations of the Beta values and the anticipated Rates of Return using CAPM:
Calculated beta of the company:
The calculated beta for the Boral Ltd stood 1.18.
Computation of required rate of return for the company shares:
Particulars Amount
Beta of the company A 1.18
Risk Free Rate B 4%
Market Risk Premium C 6%
Required Rate of Return D=B+[AxC] 11.08%
⊘ This is a preview!⊘
Do you want full access?
Subscribe today to unlock all pages.
Trusted by 1+ million students worldwide
1 out of 19
Related Documents


Your All-in-One AI-Powered Toolkit for Academic Success.
+13062052269
info@desklib.com
Available 24*7 on WhatsApp / Email
![[object Object]](/_next/static/media/star-bottom.7253800d.svg)
Unlock your academic potential
Copyright © 2020–2026 A2Z Services. All Rights Reserved. Developed and managed by ZUCOL.