Financial Statement Analysis Report: BONIA Corp vs PADINI Holdings
VerifiedAdded on 2021/04/17
|22
|3667
|190
Report
AI Summary
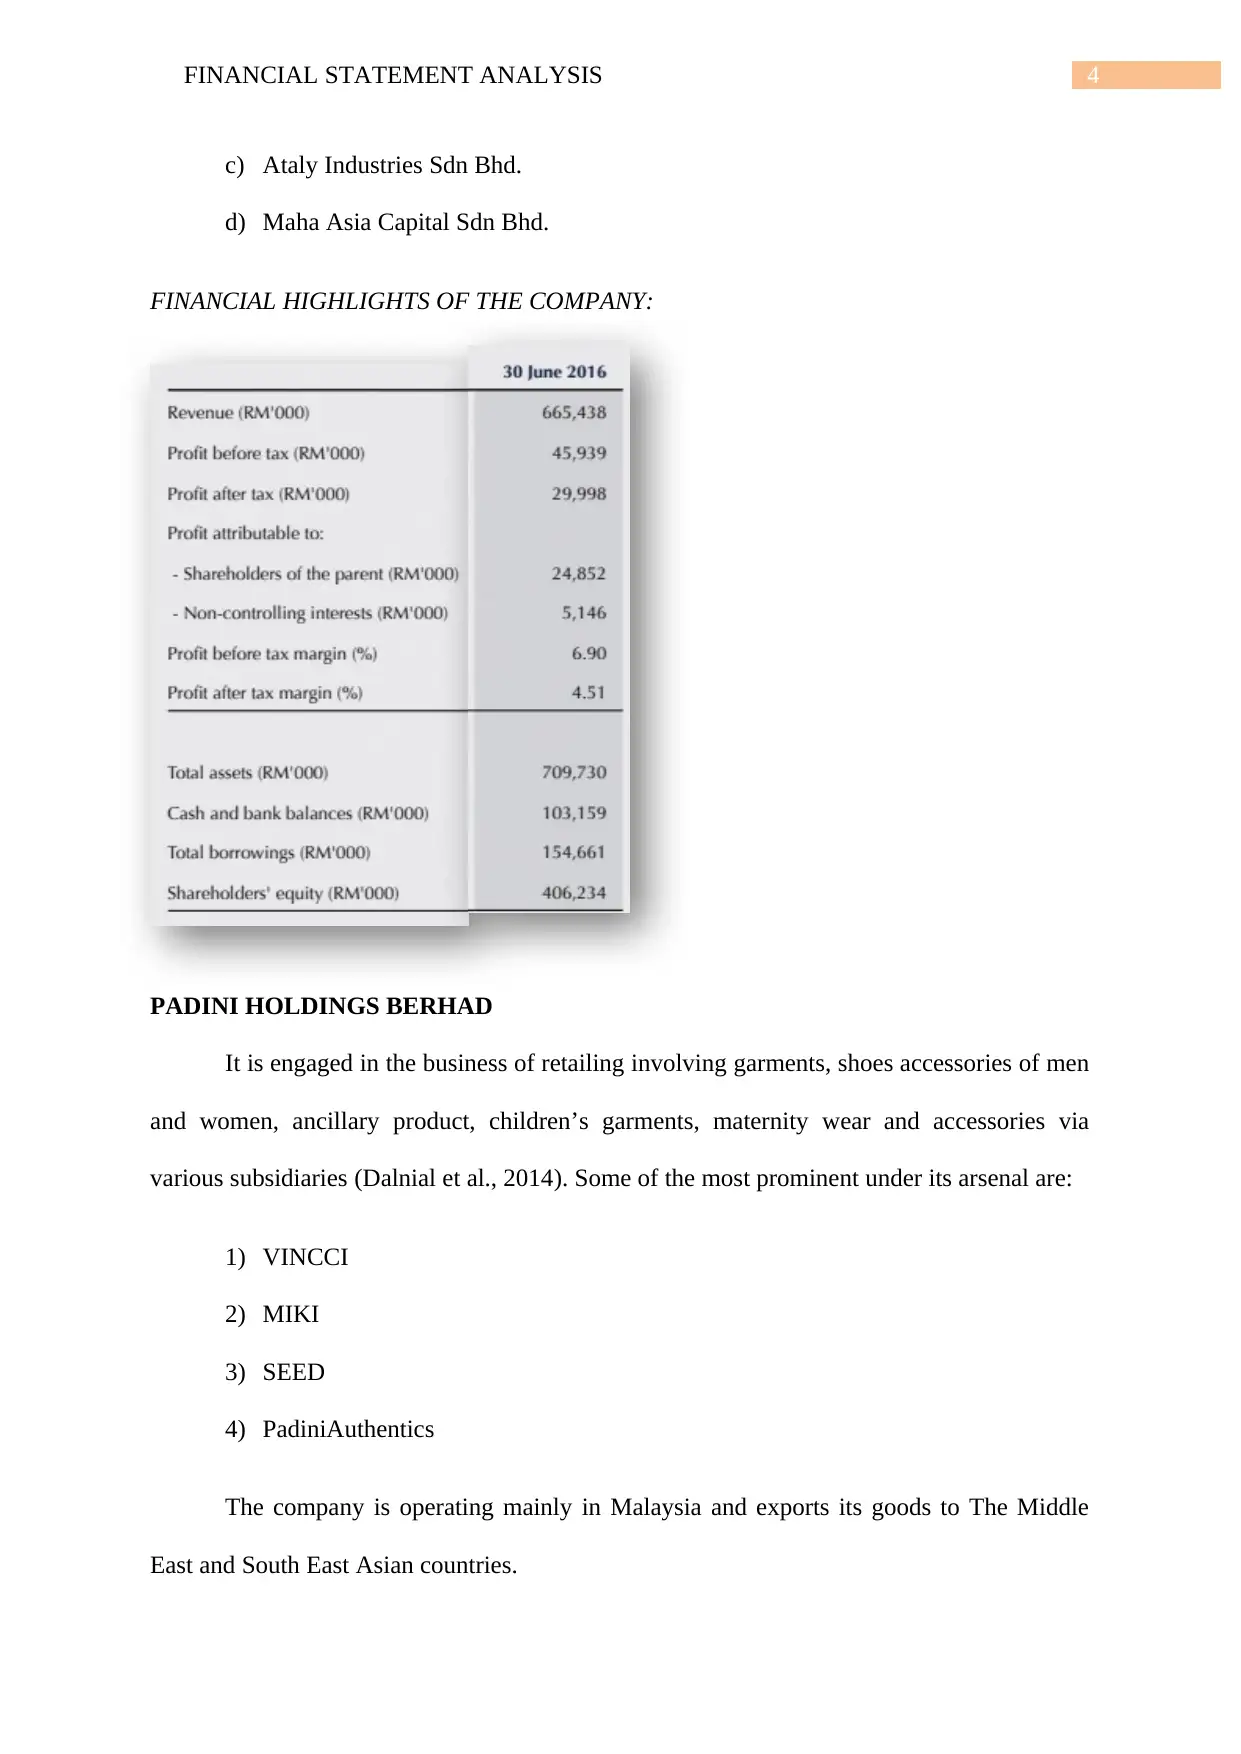
This report provides a comprehensive financial statement analysis of BONIA Corporation Berhad and PADINI Holdings Berhad. It begins with an introduction to both companies, outlining their business activities and corporate structures. The analysis then delves into the companies' operating liabilities, examining components such as trade payables, other payables, and income tax liabilities. Next, the report explores financing liabilities, categorizing them into secured and unsecured, as well as conventional and Islamic financing sources. The analysis covers hire purchase, term loans, and various types of financing. The report also assesses equity financing, including share capital, share premium, treasury shares, and retained earnings. Finally, it compares the financing activities of the two companies, highlighting key differences and similarities in their financial strategies. The report uses financial highlights and extracts from annual reports to support the analysis, providing a detailed overview of the companies' financial positions and performance.
Contribute Materials
Your contribution can guide someone’s learning journey. Share your
documents today.

Running head: FINANCIAL STATEMENT ANALYSIS
Financial Statement Analysis
Name of the Student:
Name of the university:
Authors Note:
Financial Statement Analysis
Name of the Student:
Name of the university:
Authors Note:
Secure Best Marks with AI Grader
Need help grading? Try our AI Grader for instant feedback on your assignments.

2FINANCIAL STATEMENT ANALYSIS
Table of Contents
Part 1..........................................................................................................................................2
Introduction................................................................................................................................2
BONIA CORPORATION BERHAD:...................................................................................2
PADINI HOLDINGS BERHAD...........................................................................................4
PART 2:.....................................................................................................................................5
Description and analysis of operating liabilities........................................................................5
BONIA CORPORATION BERHAD:...................................................................................5
PADINI HOLDINGS BERHAD:..........................................................................................7
PART 3:.....................................................................................................................................9
Description and analysis of financing liabilities........................................................................9
BONIA CORPORATION BERHAD:...................................................................................9
PADINI HOLDINGS BERHAD:........................................................................................11
PART 4:...................................................................................................................................12
Description and analysis of equity financing:..........................................................................12
BONIA CORPORATION BERHAD:.................................................................................12
PADINI HOLDINGS BERHAD:........................................................................................14
PART 5:...................................................................................................................................16
Comparison of the financing activities of the companies:.......................................................16
PART 6:...................................................................................................................................17
SUMMARY:............................................................................................................................17
Reference..................................................................................................................................19

3FINANCIAL STATEMENT ANALYSIS
Part 1
Introduction
BONIA CORPORATION BERHAD:
The company is engaged in the manufacture, wholesale, marketing, promotion,
distribution and retail of luxury leatherwear, apparel, footwear, accessories and eyewear for
both men and women under its own in-house brands as well as international brands. The
group is also involved in management, development and rental of commercial properties and
management of food and beverages services (Abdullah, 2016). The company is the owner of
more than 1200 sales outlet and also operates more than 185 sales boutiques internationally
including countries like Singapore, China, and Dubai, Indonesia etc.
The corporate structure of the company can be summarised as follows:
It has 100% holding in
a) SBG Holdings Son Bhd. This includes the following:
b) Scarpa Marketing SdnBhd
c) Vista Assets SdnBhd
d) Active World Pte Ltd.
It has 705 holding in Jeco (Pte) Ltd.In terms of manufacturing it holds Long Bow
Manufacturing Sdn Bhd. In terms of property development it holds BCB properties Sdn Bhd.
In addition, MakabumiSdn Bhd.
In terms of Property Investment it holds:
a) CB Holdings Sdn Bhd.
b) Luxury Parade Sdn Bhd.

4FINANCIAL STATEMENT ANALYSIS
c) Ataly Industries Sdn Bhd.
d) Maha Asia Capital Sdn Bhd.
FINANCIAL HIGHLIGHTS OF THE COMPANY:
PADINI HOLDINGS BERHAD
It is engaged in the business of retailing involving garments, shoes accessories of men
and women, ancillary product, children’s garments, maternity wear and accessories via
various subsidiaries (Dalnial et al., 2014). Some of the most prominent under its arsenal are:
1) VINCCI
2) MIKI
3) SEED
4) PadiniAuthentics
The company is operating mainly in Malaysia and exports its goods to The Middle
East and South East Asian countries.
Secure Best Marks with AI Grader
Need help grading? Try our AI Grader for instant feedback on your assignments.

5FINANCIAL STATEMENT ANALYSIS
The corporate structure of the company is as follows:
It has 100% holding in the following subsidiaries:
a) MIKIHOUSE CHIKDREN’S WEAR SDN BHD.
b) PADINI CORPORATION SDN BHD.
c) SEED CORPORATION SDN BHD.
d) YEE FONG HUNG SDN BHD.
e) PADINI DOT COM SDN BHD.
f) VINCCI HOLDINGS SDN BHD
g) VICCI LADIES SPECIALTIES SDN BHD
h) THE NEW WORLD GARMENT MANUFACTURERS SDN BHD.
i) PADINI INTERNATIONAL LTD.
The financial highlights of the company are as follows:

6FINANCIAL STATEMENT ANALYSIS
PART 2:
Description and analysis of operating liabilities
BONIA CORPORATION BERHAD:
The components of the operating liabilities of the company are as follows:
a) Trade payables
b) Amount owing to subsidiaries
c) Other payables
d) Contingent consideration for business combination
e) Deposits
f) Accruals
g) Malaysian income tax

7FINANCIAL STATEMENT ANALYSIS
h) Foreign income tax
Trade payables represent the amount which is due in respect of normal trade credits
and doesn’t bear any interest element along with it. It can be clearly inferred from the picture
that the trade payables of the group has reduced from the year 2015 to 2016. The company
had no balance in respect of the trade payable (Mohanram et al., 2017).
The amount owing to the subsidiaries represent the amount which have been paid in
advance, behalf and are payable on demand in the form of cash and cash equivalents. It can
be seen that in respect of the company the amount has increased substantially.
It is clearly evident that both in case of group and the company the amount
corresponding to other payables has increased substantially from the year 2015 to 2016. The
contingent consideration for business combination represents the amount that has been paid
for the purpose of acquisition of the business of IBB (Grimm & Blazovich, 2016). It can be
seen that in respect of the group the amount has substantially increased from the year 2015 to
2016 whereas the company had no balance in this respect.
It can be noted that the deposit with the group has increased from the year 2015 to
2016 whereas the accruals with the company has reduced from the year 2015. The accrual in
case of the company has also reduced from the year 2015 to 2016.
It can be seen that the group’s income tax liability both in respect of Malaysian
Income tax and Foreign Income tax has reduced from the year 2015 and similarly in case of
the company the income tax liability of in respect of Malaysian Income tax has reduced from
the year 2015 to 2016.
Paraphrase This Document
Need a fresh take? Get an instant paraphrase of this document with our AI Paraphraser

8FINANCIAL STATEMENT ANALYSIS
PADINI HOLDINGS BERHAD:
The components of the operating liabilities of the company are as follows:
a) Third parties under the head trade payables.
b) Other payables
c) Accruals
d) Deferred revenue from customer royalty points
e) Malaysian tax expense
f) Foreign tax expense
The ‘third parties’ represent the amount payable as part of normal trade credit and
doesn’t bear any interest with it. It generally ranges from 30-90 days. It is clearly evident

9FINANCIAL STATEMENT ANALYSIS
from the figure that the amount in respect of the group has increased from the year 2015 to
2016. Whereas in case of the company it had no balance as on, that date.
Other payables includes a sum which represents an amount owing to the bank in
respect of bank acting as a settlement and paying agent on behalf of the group before the
expiry of the period granted by the trade payables under a trade related financial agreement
entered between the group and the bank (Grant, 2016). It can be seen that both in the case of
the group and the company the amount pertaining to the other payables has increased.
Accruals represent the amount of outstanding expenses of the company. It can be
clearly seen that both in case of the group and the company the amount has increased.
Deferred revenue from customer loyalty points represents the amount of
unredeemed rebate vouchers by the customer.it can be clearly seen that the corresponding
amount has increased in case of the group from the year 2015 to 2016 (Safdar, 2016).

10FINANCIAL STATEMENT ANALYSIS
PART 3:
Description and analysis of financing liabilities
BONIA CORPORATION BERHAD:
As it can be seen from the figure above that, the components of the financial liabilities
of the company are as follows:
The financial liabilities of the group and the company can be broadly categorised as
secured and unsecured and can be further sub- categorised as conventional sources of
finance and Islamic financing liabilities:
The components of secured and conventional sources of financial liabilities are as follows:
a) Hire purchase and lease creditors:
Secure Best Marks with AI Grader
Need help grading? Try our AI Grader for instant feedback on your assignments.

11FINANCIAL STATEMENT ANALYSIS
It should be noted that the hire purchase liability of the group has reduced in respect
of the previous year 2015. Similarly, the company has also been bled to eradicate the
hire purchase liability from its balances outright in the year 2016 (Maheshwari, 2017).
b) Term loans:
The term loans of the group in the year 2016 has increased in respect of the term loans
balance in the year 2015 whereas the balances of term loans of the company has
decreased in the year 2016 from that of the year 2015 (Gong, 2017).
The components of the secured Islamic financial liabilities are as follows:
Tier financing-i:
As per the extract of the annual report above the tier, financing balances both in the
respect of the group and the company has increased from the year 2015 to the year 2016.
The components of the unsecured conventional sources of finance comprise of only of
term loans. It can be observed from the extract that in case of the group the balance of the
term loan has reduced and the in case of the company it didn’t have any balance of term loan
in the past and has not taken any term loan this year too (Demmer et al., 2016).
PADINI HOLDINGS BERHAD:

12FINANCIAL STATEMENT ANALYSIS
As it can be observed from the extract of the annual report that the components of the
financial liabilities of the company are as follows:
a) Hire purchase
b) Term loans
The detailed description of the liabilities is given here under:
a) Hire purchase-
It can be deciphered from the extract that the hire purchase balance has reduced in case of
the entire group from the year 2015 to 2016 whereas the company has not taken any hire
purchase in the year 2016 too thus keeping the balance at zero (Drake et al., 2017).
b) Term loans:
The term loans balance in both the cases of the company and of the group has
reduced. This suggest that the company and the group are following the same trend
and have focussed to reduce the balance of their term loan (Omar et al., 2014).

13FINANCIAL STATEMENT ANALYSIS
PART 4:
Description and analysis of equity financing:
BONIA CORPORATION BERHAD:
From the above picture, it is clear that the following are the components of equity:
a) Share capital
b) Share premium
c) Treasury shares
d) Retained earnings
Detailed analysis and description of the components are given hereunder:
a) Share capital-
This figure reflects the face value of the issued and subscribed equity share capital
until date. It can be noted that the company has issued bonus shares to its shareholders
in the year 2015 in the ratio 1:1. This has doubled the share capital of the company.
Paraphrase This Document
Need a fresh take? Get an instant paraphrase of this document with our AI Paraphraser

14FINANCIAL STATEMENT ANALYSIS
Thereafter there has been no transaction of equity share capital by the company (Ball
et al., 2015).
b) Share premium-
It is comprised of the amount of premium charged by the company from its
shareholders above the face value of the shares issued to them. It can be sent that the
share premium account is reduced by the amount of premium that is given to the
shareholders by way of bonus shares (Devi, 2018). It has also increased by an amount
of 1006 in respect of the premium charged by the shareholders by resale of the
treasury shares.
c) Treasury shares-
This figure reflects the amount of shares that the company has acquired back from its
shareholders and it shows a debit balance in the statement. In the year 2015, the
company resold the treasury shares to its shareholders at a premium. Thus, there is no
opening balance of treasury shares in the year 2016 (Kim et al., 2016).
d) Retained earnings-
It is the amount, which reflects the profit accumulated by the company over the years.
It increases by the amount of profit earned by a company in the respective financial
year and reduces by the amount of losses incurred by it. It can be seen that the
company had issued bonus shares in the ratio of 1:1 in the year 2015 and thus the
balance of the retained earnings has reduced drastically (Petersen et al., 2017). The
balance in the retained earnings had further reduced by the amount of dividend paid in
the year 2015.

15FINANCIAL STATEMENT ANALYSIS
PADINI HOLDINGS BERHAD:
It can be seen from the above figure that the components of equity of the company are
as follows:
a) Share capital
b) Share premium
c) Retained earnings
PADINI HOLDINGS BERHAD:
It can be seen from the above figure that the components of equity of the company are
as follows:
a) Share capital
b) Share premium
c) Retained earnings

16FINANCIAL STATEMENT ANALYSIS
The detailed description and analysis of the components are listed below:
a) The share capital of the company reflects the face value of the equity shares issued
and subscribed by the shareholders. The company has not issued any shares in the last
two financial years thereby keeping the balance constant.
b) Share premium-
It is the amount charged by the company from the shareholders in excess of the face
value of the equity shares. As the company has issued no shares in the last two years,
hence the balance of the premium account has remained constant (Malik, 2017).
c) Retained earnings-
It is the amount of profit that is accumulated by the company over the years from the
profit earned by it through its operations. It can be seen that the retained earning so of
the company has been reduced by the amount of dividend given out by the company
to the shareholders. It increases with the amount of profit earned by the company in
the financial year (Hasan, 2015).
PART 5:
Comparison of the financing activities of the companies:
1) The first difference between the two companies is that the BONIA CORPORATIONS
BERHAD is using two sources of finance that is it uses finances from both the
conventional sources of finance and the Islamic finance liabilities. Whereas PADINI
HOLDINGS BERHAD is using only the conventional sources of finance. This
implies that the portfolio of BONIA CORPORATIONS BERHAD is far more than
that of the PADINI HOLDINGS BERHAD. It also gives indications that BONIA
CORPORATIONS BERHAD has been able to satisfy all the conditions of the Islamic
fiancé bodies, which provides such kind of loans, as without fulfilment of those it
Secure Best Marks with AI Grader
Need help grading? Try our AI Grader for instant feedback on your assignments.

17FINANCIAL STATEMENT ANALYSIS
would not have been possible for the company to raise the same (Weygandt et al.,
2015).
2) The second difference between the financial liabilities of the two companies is that
BONIA CORPORATIONS BERHAD is using both secured as well as unsecured
sources of finance whereas the PADINI HOLDINGS BERHAD is using only secured
sources of finance (Warren & Jones, 2018). This suggests that the lenders are relying
heavily on the repayment capability of the BONIA CORPORATIONS BERHAD.
Whereas in the case of PADINI HOLDINGS BERHAD the lenders are not able to
trust the loan repayment capacity of the company. That is why the company has
access to only secured sources of finance.
3) The third difference that exists between the financial liabilities of the companies is
that in case of BONIA CORPORATIONS BERHAD the balance of the term loan of
the group has increased while the balance of the term loan of the company has
decreased from the year 2015 to year 2016. Whereas in the case of PADINI
HOLDINGS BERHAD the terms loan’s balances both in the case of the company and
the group has reduced from the year 2015 to 2016. This shows that one entity ahs
similar trend of term loans for the company and the group whereas the other entity has
different trend of term loan for the company and the group (Bahri et al., 2017).
4) The fourth difference between the financing liabilities of the two companies is that in
case of the BONIA CORPORATION BERHAD the total balances of the financial
liabilities of the company has increased from the year 2015 to 2016 whereas the total
balance of the PAIDINI HOLDINGS BERHAD has reduced from the year 2015 to
2016 (Lisowsky et al., 2017). This shows that the former is in more needs of the funds
whereas the latter is in excess of funds and thus is repaying back its financial
liabilities.

18FINANCIAL STATEMENT ANALYSIS
PART 6:
SUMMARY:
The entire analysis can be summarised as follows:
1) The BONIA CORPORATIONS BERHAD is increasing the participation of the
shareholders in its capital structure. The phenomenon is reflected by the fact that
the share capital of the company increased because of the bonus issued by the
company. Whereas there has been no such effort made by the PADINI
HOLDINGS BERHAD which has not changed the balance o fits share capital
neither by way of fresh issue nor by issuing any kind of bonus share.
2) The BONIA CORPORATION BERHAD is most likely expanding its business
because it is using more financial liabilities in order to increase its cash
availability. Whereas the PADINI HOLDINS BERHAD is in excess of funds,
which is reflected by the fact, that it has been paying of its term loans.
3) It is observed that there is more synergy in the operations of the group and the
company in case of PADINI HOLDINGS BERHAD whereas there is a difference
in the trends followed by the company and the group in case of BONIA
CORPORATIONS BERHAD. This is reflected by the trend in the terms loans of
of the two companies.
4) If the operations of the two companies are compared the BONIA
CORPORATIONS BERHAD has more wide range of operations as compared to
the PADINI HOLDINGS BERHAD. This is because PADINI HOLDINGS
BERHAD is involved in only the retailing of the products whereas the BONIA
CORPORATIONS BERHAD is engaged in multitude of operations like
manufacturing, wholesale, retail and marketing under its own brand and other

19FINANCIAL STATEMENT ANALYSIS
multitude of international recognised brands. Hence, it requires and utilises more
funds than that of PADINI HLDING BERHAD.
multitude of international recognised brands. Hence, it requires and utilises more
funds than that of PADINI HLDING BERHAD.
Paraphrase This Document
Need a fresh take? Get an instant paraphrase of this document with our AI Paraphraser

20FINANCIAL STATEMENT ANALYSIS
Reference
Abdullah, A. A. (2016). Financial Statement Analysis for Kier Group PLC. Global Journal of
Management And Business Research.
Bahri, M., St-Pierre, J., & Sakka, O. (2017). Performance measurement and management for
manufacturing SMEs: a financial statement-based system. Measuring Business
Excellence, 21(1), 17-36.
Ball, R., Li, X., & Shivakumar, L. (2015). Contractibility and transparency of financial
statement information prepared under IFRS: Evidence from debt contracts around
IFRS adoption. Journal of Accounting Research, 53(5), 915-963.
Dalnial, H., Kamaluddin, A., Sanusi, Z. M., & Khairuddin, K. S. (2014). Detecting fraudulent
financial reporting through financial statement analysis. Journal of Advanced
Management Science, 2(1).
Demmer, M., Pronobis, P., & Yohn, T. (2016). Financial Statement-Based Forecasts and
Analyst Forecasts of Profitability: The Effect of Mandatory IFRS Adoption.
Devi, P. C. (2018). AN ANALYSIS ON THE FACTORS WHICH INFLUENCE
FINANCIAL STATEMENT QUALITY OF SKPD (REGIONAL WORK UNIT) AT
THE BINJAI MUNICIPAL ADMINISTRATION WITH ORGANIZATIONAL
COMMITMENT AS MODERATING VARIABLE. International Journal of Public
Budgeting, Accounting and Finance, 1(1).
Drake, M. S., Quinn, P. J., & Thornock, J. R. (2017). Who Uses Financial Statements? A
Demographic Analysis of Financial Statement Downloads from EDGAR. Accounting
Horizons, 31(3), 55-68.

21FINANCIAL STATEMENT ANALYSIS
Gong, Z. (2017). Comparing the development of two communication technology companies
using financial statement analysis.
Grant, R. M. (2016). Contemporary strategy analysis: Text and cases edition. John Wiley &
Sons.
Grimm, S. D., & Blazovich, J. L. (2016). Developing student competencies: An integrated
approach to a financial statement analysis project. Journal of Accounting
Education, 35, 69-101.
Hasan, M. (2015). Financial statement analysis and performance evaluation of Farr Ceramics
Limited.
Kim, J. B., Li, L., Lu, L. Y., & Yu, Y. (2016). Financial statement comparability and
expected crash risk. Journal of Accounting and Economics, 61(2-3), 294-312.
Lisowsky, P., Minnis, M., & Sutherland, A. (2017). Economic growth and financial statement
verification. Journal of Accounting Research, 55(4), 745-794.
Maheshwari, S. (2017). Financial Statement Analysis & Project Work.
Malik, M. S. (2017). Financial statement analysis, internal controls, and audit readiness:
Best practices for Pakistan Army financial management officers (Doctoral
dissertation, Monterey, California: Naval Postgraduate School).
Mohanram, P., Saiy, S., & Vyas, D. (2017). Fundamental analysis of banks: the use of
financial statement information to screen winners from losers. Review of Accounting
Studies, 1-34.

22FINANCIAL STATEMENT ANALYSIS
Omar, N., Koya, R. K., Sanusi, Z. M., & Shafie, N. A. (2014). Financial statement fraud: A
case examination using Beneish Model and ratio analysis. International Journal of
Trade, Economics and Finance, 5(2), 184.
Petersen, C. V., Plenborg, T., & Kinserdal, F. (2017). Financial Statement Analysis:
Valuation-Credit Analysis-Performance Evaluation. Fagbokforlaget Vigmostad og
Bjørke.
Safdar, I. (2016). Dissecting Stock Price Momentum Using Financial Statement Analysis.
Warren, C. S., & Jones, J. (2018). Corporate financial accounting. Cengage Learning.
Weygandt, J. J., Kimmel, P. D., & Kieso, D. E. (2015). Financial & managerial accounting.
John Wiley & Sons.
1 out of 22
Related Documents

Your All-in-One AI-Powered Toolkit for Academic Success.
+13062052269
info@desklib.com
Available 24*7 on WhatsApp / Email
Unlock your academic potential
© 2024 | Zucol Services PVT LTD | All rights reserved.