Comparative Financial Analysis of Bristol Myers Squibb & Eli Lilly
VerifiedAdded on  2023/06/11
|6
|777
|363
Report
AI Summary
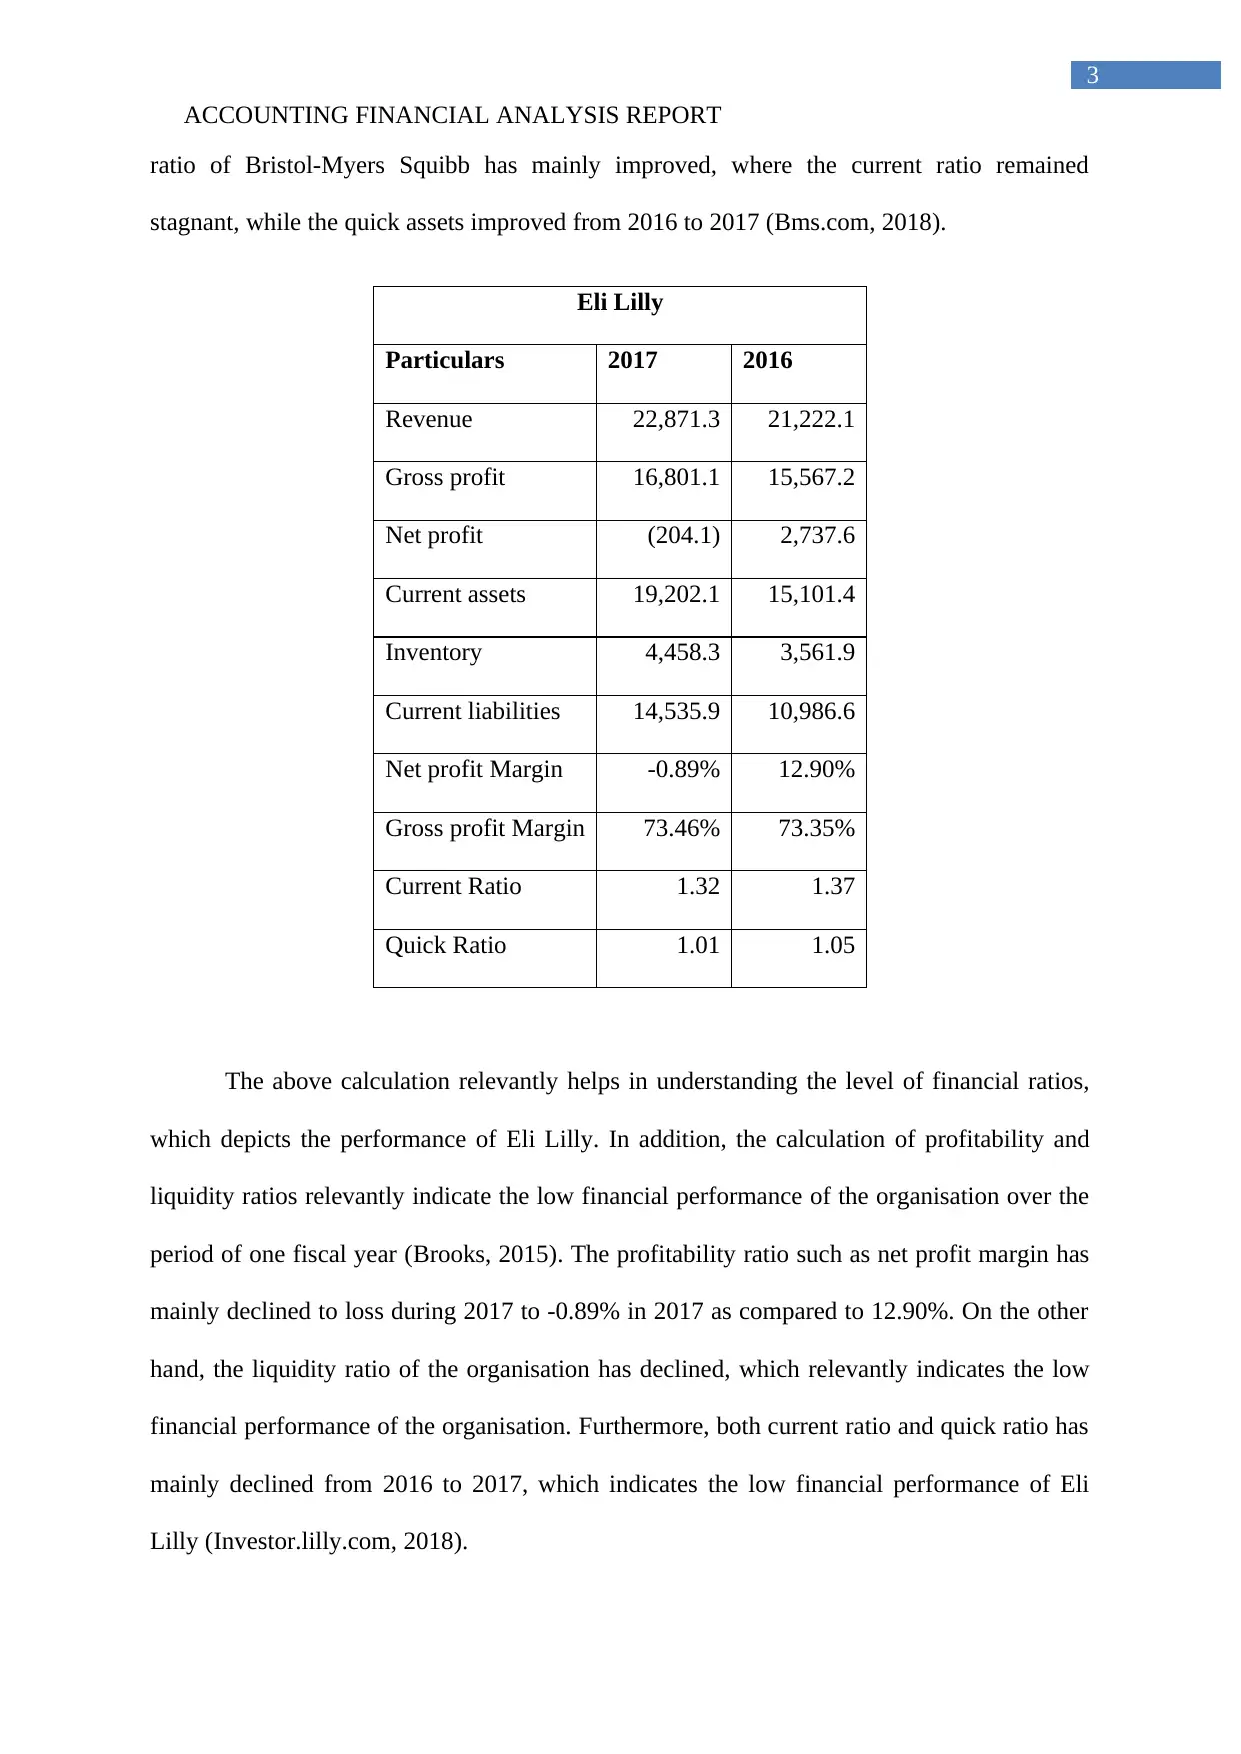
This report presents a financial analysis of Bristol Myers Squibb and Eli Lilly, evaluating their financial performance based on data from 2016 and 2017. Key metrics such as revenue, gross profit, net profit, current assets, inventory, and current liabilities are analyzed to determine profitability and liquidity ratios. The report highlights the decline in net profit margin and gross profit margin for Bristol-Myers Squibb, and a significant drop in net profit for Eli Lilly, even resulting in a loss in 2017. Liquidity ratios are also examined, revealing a mixed performance. Based on the analysis, the report recommends investing in Bristol Myers Squibb due to its comparatively better financial performance. Desklib offers a wealth of similar documents and study tools for students.

Running head: ACCOUNTING FINANCIAL ANALYSIS REPORT
Accounting Financial Analysis Report
Name of the Student:
Name of the University:
Authors Note:
Accounting Financial Analysis Report
Name of the Student:
Name of the University:
Authors Note:
Paraphrase This Document
Need a fresh take? Get an instant paraphrase of this document with our AI Paraphraser

ACCOUNTING FINANCIAL ANALYSIS REPORT
1
Table of Contents
Financial performance of Bristol Myers Squibb and Eli Lilly:..................................................2
Recommendation for investing in Bristol Myers Squibb and Eli Lilly:....................................4
Conclusion:................................................................................................................................4
References:.................................................................................................................................5

ACCOUNTING FINANCIAL ANALYSIS REPORT
2
Financial performance of Bristol Myers Squibb and Eli Lilly:
Bristol-Myers Squibb
Particulars 2017 2016
Revenue 20,776 19,427
Gross profit 14,710 14,481
Net profit 1,007 4,457
Current assets 14,854 13,704
Inventory 1,166 1,241
Current liabilities 9,563 8,841
Net profit Margin 4.85% 22.94%
Gross profit Margin 70.80% 74.54%
Current Ratio 1.55 1.55
Quick Ratio 1.43 1.41
From the overall evaluation of the above table the financial performance of Bristol-
Myers Squibb could be identified, which help investors in making adequate investment
decisions. In addition, the profitability and liquidity ratio has mainly helped in understanding
the level of financial performance, which could help in detecting investment opportunity for
the investors (Atoom, Malkawi & Al Share, 2017). The net profit margin of Bristol-Myers
Squibb has mainly declined from 22.94% in 2016 to 4.85% in 2017, which relevantly
indicates the low financial capability of the organisation. Furthermore, the gross profit margin
of the organisation has also declined from the level of 74.54% in 2016 to 70.80% in 2017,
which indicates the relevant decline in profits of the organisation. In addition, the liquidity
⊘ This is a preview!⊘
Do you want full access?
Subscribe today to unlock all pages.

Trusted by 1+ million students worldwide

ACCOUNTING FINANCIAL ANALYSIS REPORT
3
ratio of Bristol-Myers Squibb has mainly improved, where the current ratio remained
stagnant, while the quick assets improved from 2016 to 2017 (Bms.com, 2018).
Eli Lilly
Particulars 2017 2016
Revenue 22,871.3 21,222.1
Gross profit 16,801.1 15,567.2
Net profit (204.1) 2,737.6
Current assets 19,202.1 15,101.4
Inventory 4,458.3 3,561.9
Current liabilities 14,535.9 10,986.6
Net profit Margin -0.89% 12.90%
Gross profit Margin 73.46% 73.35%
Current Ratio 1.32 1.37
Quick Ratio 1.01 1.05
The above calculation relevantly helps in understanding the level of financial ratios,
which depicts the performance of Eli Lilly. In addition, the calculation of profitability and
liquidity ratios relevantly indicate the low financial performance of the organisation over the
period of one fiscal year (Brooks, 2015). The profitability ratio such as net profit margin has
mainly declined to loss during 2017 to -0.89% in 2017 as compared to 12.90%. On the other
hand, the liquidity ratio of the organisation has declined, which relevantly indicates the low
financial performance of the organisation. Furthermore, both current ratio and quick ratio has
mainly declined from 2016 to 2017, which indicates the low financial performance of Eli
Lilly (Investor.lilly.com, 2018).
Paraphrase This Document
Need a fresh take? Get an instant paraphrase of this document with our AI Paraphraser

ACCOUNTING FINANCIAL ANALYSIS REPORT
4
Recommendation for investing in Bristol Myers Squibb and Eli Lilly:
From the overall evaluation of financial performance of Bristol Myers Squibb and Eli
Lilly it could be identified that Bristol Myers Squibb has higher financial performance in
comparison to Eli Lilly. Therefore, it could be identified that the investment in Bristol Myers
Squibb could eventually help in improving the level of returns, which could have generated
from investment. Hence, seeing the relevant improvement in financial performance of Bristol
Myers Squibb has mainly helped in understanding the future returns that could be conducted
from investment.
Conclusion:
After evaluating the financial performance of both the organisation the overall
investment option could be identified. The financial performance of Bristol Myers Squibb has
mainly improved in comparison to Eli Lilly, which present an adequate investment
opportunity for investor to improve the level of returns from investment. Hence, investment
in Bristol Myers Squibb could help the friend to improve the relevant returns from
investment.

ACCOUNTING FINANCIAL ANALYSIS REPORT
5
References:
Atoom, R., Malkawi, E., & Al Share, B. (2017). Utilizing Australian Shareholders'
Association (ASA): Fifteen Top Financial Ratios to Evaluate Jordanian Banks'
Performance. Journal of Applied Finance and Banking, 7(1), 119.
Bms.com. (2018). Bms.com. Retrieved 28 June 2018, from
https://www.bms.com/investors/financial-reporting/annual-reports.html
Brooks, R. (2015). Financial management: core concepts. Pearson.
Investor.lilly.com. (2018). Eli Lilly and Company. Retrieved 28 June 2018, from
https://investor.lilly.com/financial-information/annual-reports
⊘ This is a preview!⊘
Do you want full access?
Subscribe today to unlock all pages.

Trusted by 1+ million students worldwide
1 out of 6
Related Documents

Your All-in-One AI-Powered Toolkit for Academic Success.
 +13062052269
info@desklib.com
Available 24*7 on WhatsApp / Email
Unlock your academic potential
Copyright © 2020–2025 A2Z Services. All Rights Reserved. Developed and managed by ZUCOL.