Financial Reporting Analysis of Burberry Company - AC5001 Module
VerifiedAdded on 2022/08/24
|24
|5659
|25
Report
AI Summary
This report provides a detailed financial analysis of Burberry Company, examining its financial performance and position. The analysis includes an overview of the company's background and operations, followed by an in-depth evaluation of its financial performance using profitability, liquidity, management efficiency, and solvency ratios. The report also delves into investor ratios, share price movements, and cash flow analysis to provide a comprehensive understanding of Burberry's financial health. The analysis is based on the company's annual reports and financial statements, offering insights into key financial indicators and trends. The report concludes with an interpretation of the financial performance and position, which can aid investors and stakeholders in making informed decisions. Various financial statement analysis tools and techniques are employed to present a comprehensive view of Burberry's financial standing.
Running head: FINANCIAL REPORTING
Financial Reporting
Name of the Student:
Name of the University:
Author’s Note:
Financial Reporting
Name of the Student:
Name of the University:
Author’s Note:
Paraphrase This Document
Need a fresh take? Get an instant paraphrase of this document with our AI Paraphraser
1FINANCIAL REPORTING
Abstract:
This report is prepared to understand the importance and application of financial reporting
with the practical example of Burberry Company. Financial reporting is the means of
communicating financial information of a company to its stakeholders. It is the final outcome
of the whole of the accounting and reporting process. Analysis an interpretation of the
financial reports are important for understanding the financial performance and financial
position of the company, based on which various important business decisions can be taken
by the stakeholders. In this report, the financial performance and financial position of the
Burberry Company have been analysed and presented based on the information available in
their annual reports.
2FINANCIAL REPORTING
Table of Contents
Introduction:...............................................................................................................................3
Background to the company:.....................................................................................................3
Financial performance analysis:.................................................................................................4
Profitability analysis:.............................................................................................................4
Liquidity analysis:..................................................................................................................6
Management efficiency analysis:...........................................................................................7
Solvency analysis:..................................................................................................................8
Investor ratios.............................................................................................................................8
Analysis of the share price movement:......................................................................................9
Cash flow analysis:..................................................................................................................10
Analysis of the financial reports:.............................................................................................12
Conclusion:..............................................................................................................................13
References and bibliography:...................................................................................................14
Appendices:..............................................................................................................................17
⊘ This is a preview!⊘
Do you want full access?
Subscribe today to unlock all pages.
Trusted by 1+ million students worldwide
3FINANCIAL REPORTING
Introduction:
Financial reporting is the process of communicating all the information relating to the
financial performance and financial position of a company for a particular period of time. It is
the final outcome of the financial accounting process. The main objective of the financial
reporting is to provide meaningful information about the financial performance and financial
position of the company to its stakeholders. It may not be easy for an individual to interpret
and understand the information conveyed through the financial reports and financial
statements so that an important decision relating to the company could be made. Therefore,
analysis and interpretation of the financial statements and financial reports are important. In
this report, financial statements and financial reports of the Burberry Company has been
analysed with the help of various financial statement analysis tools and techniques. Based on
such analysis, the financial performance and financial position of the company has been
interpreted so that it can help the investors and various other stakeholders in their decision
making process (PLC 2020).
Background to the company:
Burberry Company PLC is well known global fashion and luxury brand. The
company is operating globally based on their headquarter in London. The main operation of
the company is to retail luxurious fashion products through their shopping retail outlets. They
also introduced the online retailing in recent years to gain wide reach out to the customers
and to capture a wide market share. The company was established in the year 1856 by
Thomas Burberry with the aim of development and retailing of outdoor fashion wears.
Through the innovation in their products and attractive designs they have successfully
become a well-known global fashion brand within a few years of their establishment. The
product line of the company includes, outdoor fashion wears, fashion accessories, sunglasses,
Paraphrase This Document
Need a fresh take? Get an instant paraphrase of this document with our AI Paraphraser
4FINANCIAL REPORTING
fragrances and cosmetics. Having a global presence and high end quality on their products,
the company have been performing financially and operationally very well for the last few
years. In the following parts of this report, various financial statement analysis tools and
techniques have been applied to analyse their annual reports and to interpret their financial
performance and financial position (PLC 2020).
Financial performance analysis:
Every company is established with the objective of earning revenue through its
operating activities and to have a significant profitability towards achieving the objective of
the shareholders wealth maximisation. As a modern and customer oriented company, the
company has always focused on the quality of their products and building customer
relationship. Financial performance of a company can be measured by the profitability and its
management efficiency in utilising the resources of the company. From the annual report of
the company various profitability and efficiency ratios have been computed for understanding
and interpreting the financial performance of the company as below (PLC 2020).
Profitability analysis:
Profitability is the earning capacity of the company. From the annual report and
financial statement of the company the profitability of the company can be understood and
analysed. Various ratios such as net profit margin, EBITDA margin, operating margin and so
on, the profitability of the company and its trend for the last few years can be analysed as
follows (Wang 2014).
5FINANCIAL REPORTING
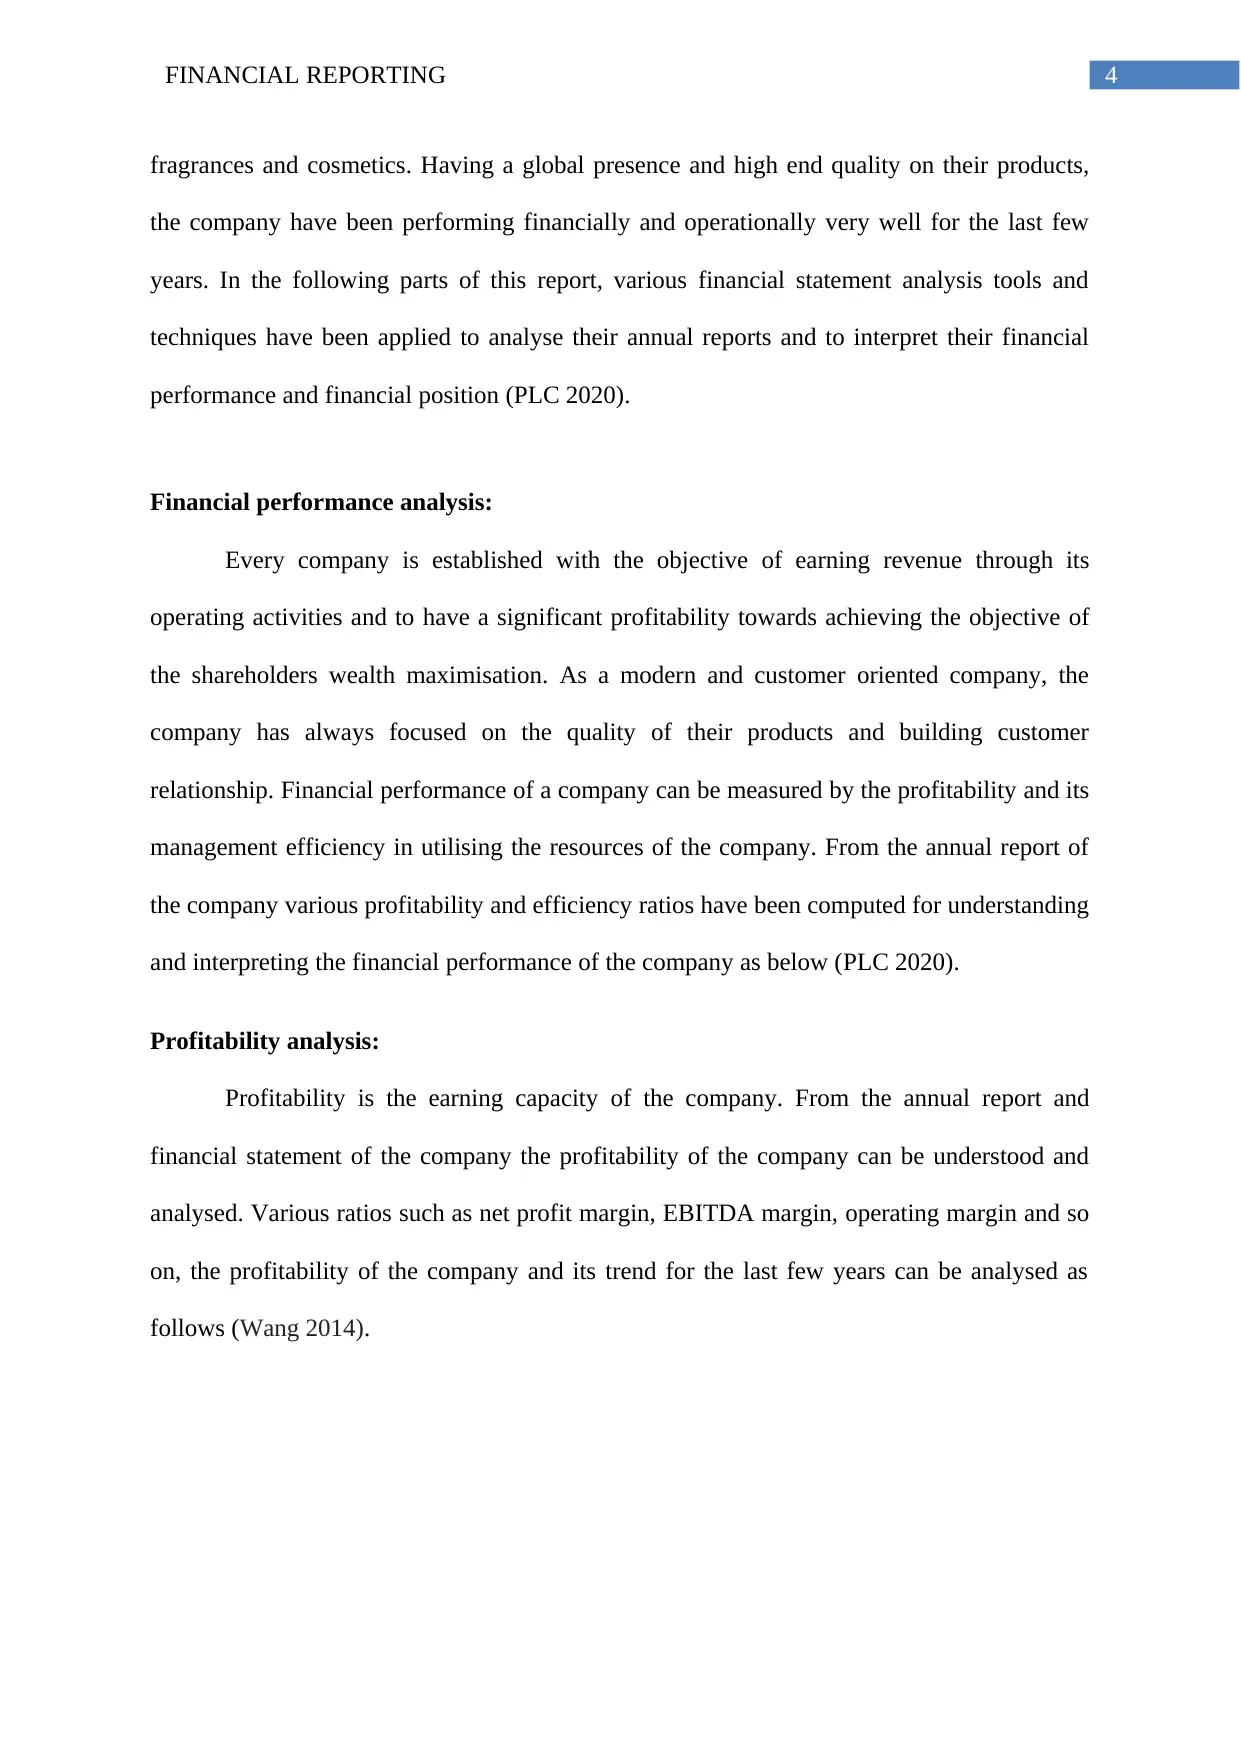
It can be observed from the above analysis that the company is having a significant
gross profit margin and there is a sustainability in the gross profit margin. It can be observed
from the above ratio analysis that, the gross profit margin of the company has been remained
same in around 68% to 69% for the last three years (finance.yahoo.com 2020).
Operating profit margin is the measure of profitability based on the operating profit as
compared to the turnover of the company. It can be observed that the operating profit margin
has been increasing since the year 2017. It was 14.26% in the year 2017 and it became
15.01% in the year 2018 and finally it reached to 16.07% in the year 2018. Hence, there is a
good increasing trend in the operating margin, which implies better management and better
operating efficiency of the company (Wang 2014).
Return on capital employed is another measure of profitability compared to the capital
employed of the company. It can be observed that the Burberry Company was having a return
on capital employed of 21.33% in the year 2017 and it reached to 25.84% in the year 2019.
Hence, a clear increasing trend in the return on capital employed margin can be observed. It
implies the company is efficient in utilising their capital and finances to earn a significant
amount of profit and to achieve the objective of the business.
Return on equity can also be used for understanding and interpreting the financial
performance of the company. It can be observed from the above ratio analysis, that the
Burberry Company was having a return on equity of 23.22% in the year 2017 and it has been
⊘ This is a preview!⊘
Do you want full access?
Subscribe today to unlock all pages.
Trusted by 1+ million students worldwide
6FINANCIAL REPORTING
increased to 29.95% in the year 2019. Therefore, an increase in return on equity implies that
the company is well enough to utilise their financial resources and to achieve the objective of
shareholders wealth maximisation.
Net profit margin is the ultimate measure of the profitability of a company. It can be
observed that there is a steady and sustainable growth in the net profit margin of the Burberry
Company. The net profit margin of the company was 10.40% in the year 2017 and it reached
to 12.45% in the year 2019. Hence, the net profit margin also implies that the company is
having a good profitability and a sustainable growth in their profitability (finance.yahoo.com
2020).
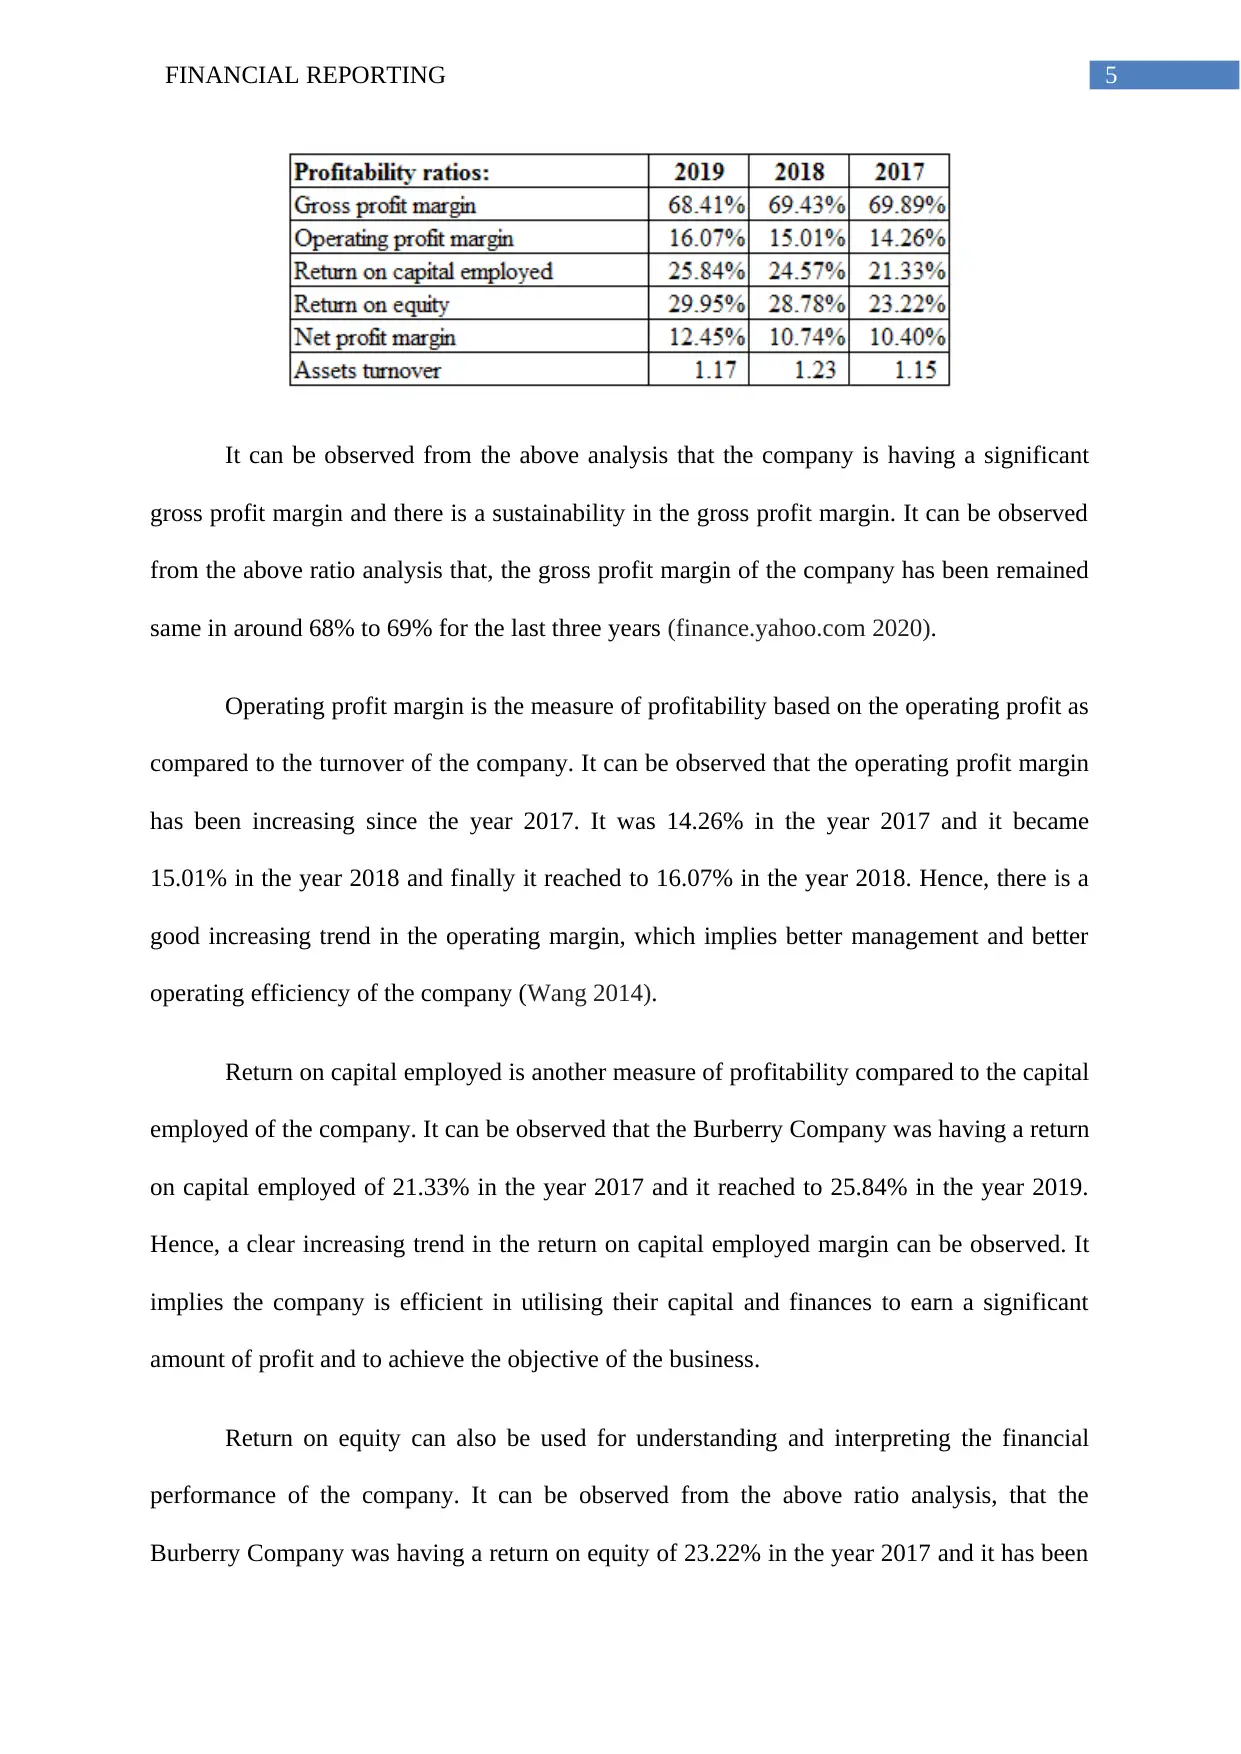
Assets turnover measures the efficiency in utilisation of current and noncurrent assets
of the company to earn revenue. It can be observed that the company was having an assets
turnover of 1.15 in the year 2017 and it has been increased to 1.17 in the year 2019. Hence, in
assets turnover also the Burberry Company PLC showed a marginal increasing trend.
Following bar chart can be used for better comparison of the profitability year wise for the
Burberry Company PLC (Wang 2014).
Gross profit
margin Operating profit
margin Return on capital
employed Return on equity Net profit
margin Assets turnover
0.00%
20.00%
40.00%
60.00%
80.00%
100.00%
120.00%
140.00%
Profitability
2019 2018 2017
increased to 29.95% in the year 2019. Therefore, an increase in return on equity implies that
the company is well enough to utilise their financial resources and to achieve the objective of
shareholders wealth maximisation.
Net profit margin is the ultimate measure of the profitability of a company. It can be
observed that there is a steady and sustainable growth in the net profit margin of the Burberry
Company. The net profit margin of the company was 10.40% in the year 2017 and it reached
to 12.45% in the year 2019. Hence, the net profit margin also implies that the company is
having a good profitability and a sustainable growth in their profitability (finance.yahoo.com
2020).
Assets turnover measures the efficiency in utilisation of current and noncurrent assets
of the company to earn revenue. It can be observed that the company was having an assets
turnover of 1.15 in the year 2017 and it has been increased to 1.17 in the year 2019. Hence, in
assets turnover also the Burberry Company PLC showed a marginal increasing trend.
Following bar chart can be used for better comparison of the profitability year wise for the
Burberry Company PLC (Wang 2014).
Gross profit
margin Operating profit
margin Return on capital
employed Return on equity Net profit
margin Assets turnover
0.00%
20.00%
40.00%
60.00%
80.00%
100.00%
120.00%
140.00%
Profitability
2019 2018 2017
Paraphrase This Document
Need a fresh take? Get an instant paraphrase of this document with our AI Paraphraser
7FINANCIAL REPORTING
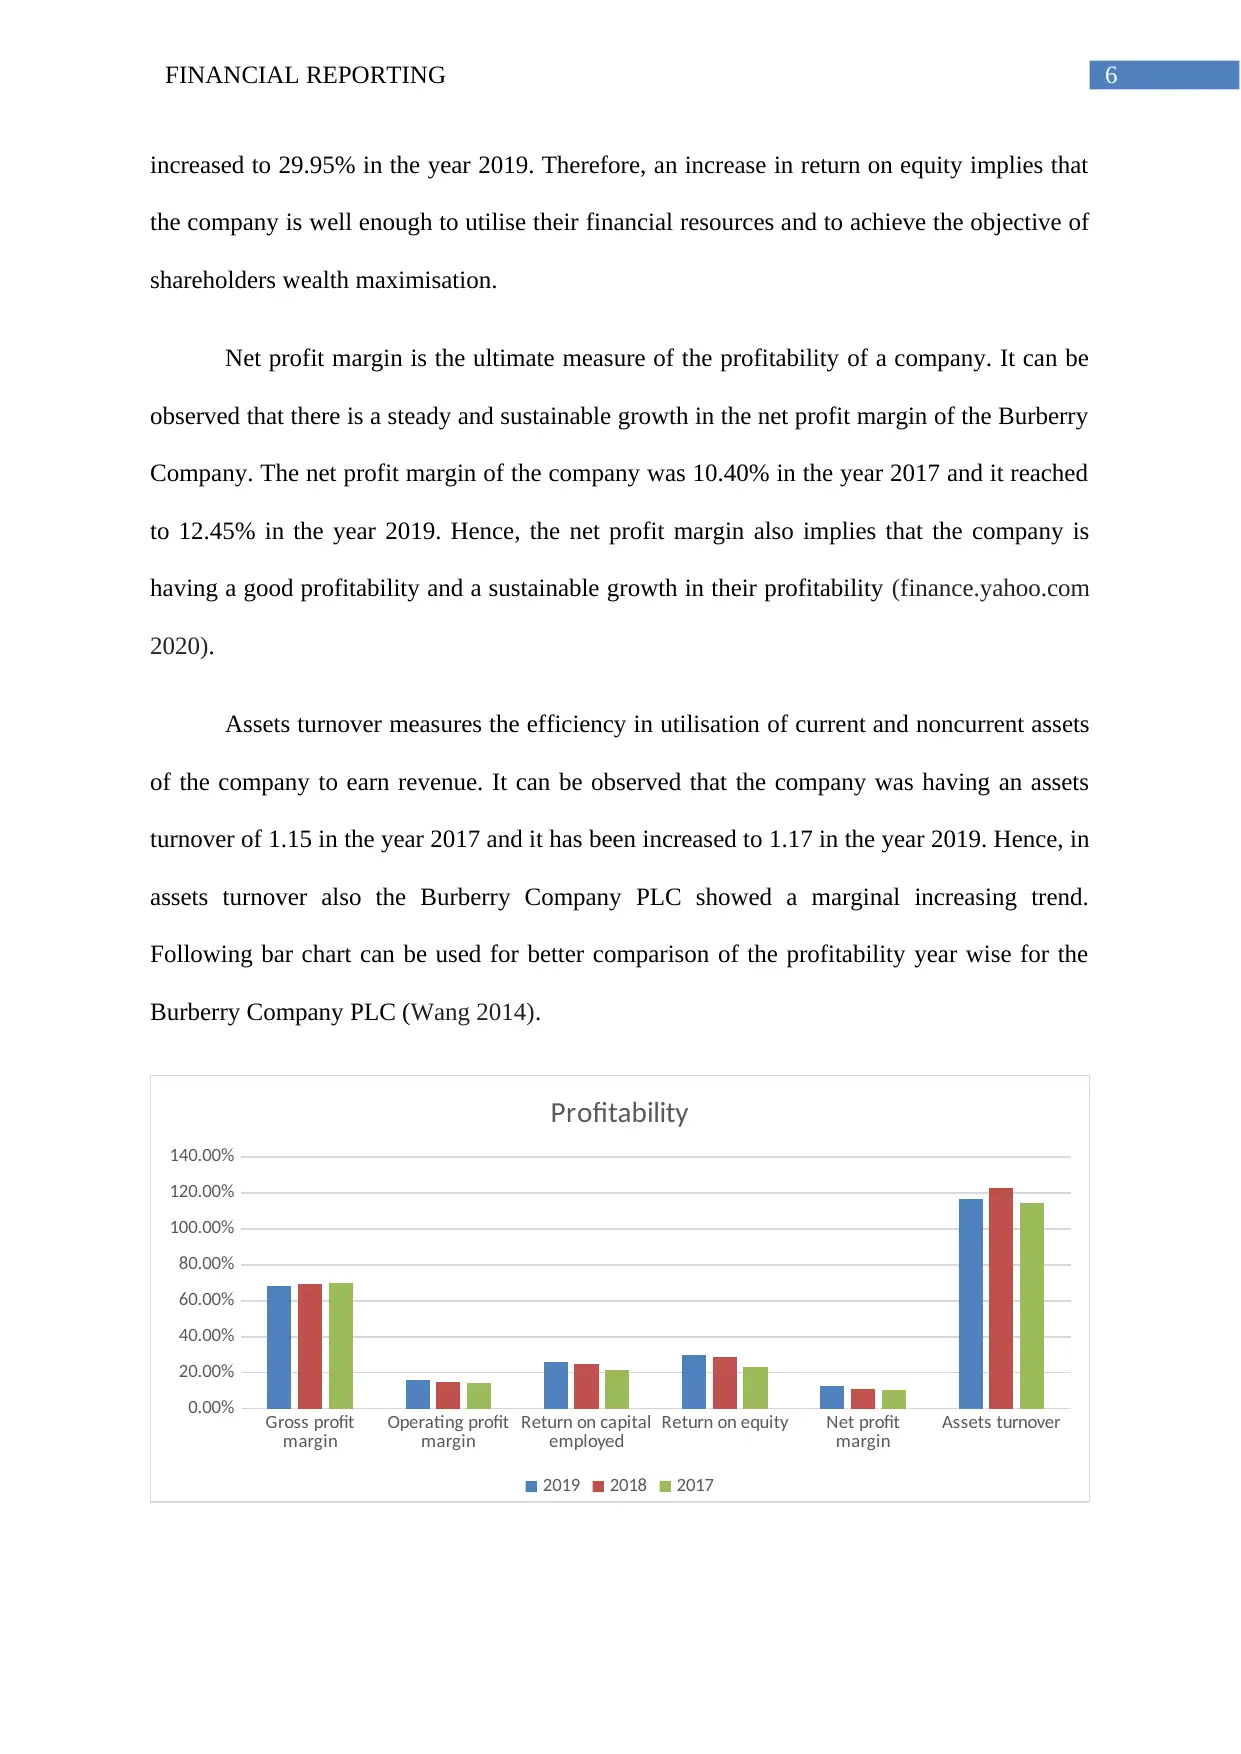
Liquidity analysis:
Liquidity is the capacity of a company to pay off the liabilities using its current assets.
It can be said that the liquidity is the measure of short term solvency. Following rations can
be used for the analysis of the liquidity of the Burberry Company.
It can be observed that the company is having a current ratio of 2.90:1 in the year
2017 and it has been decreased to 2.51:1 in the year 2019. The standard current ratio is 2:1.
Hence, the company is having a good liquidity in terms of current ratio. In terms of quick
ratio also the company is having a good mark as they have a quick ratio of more than the
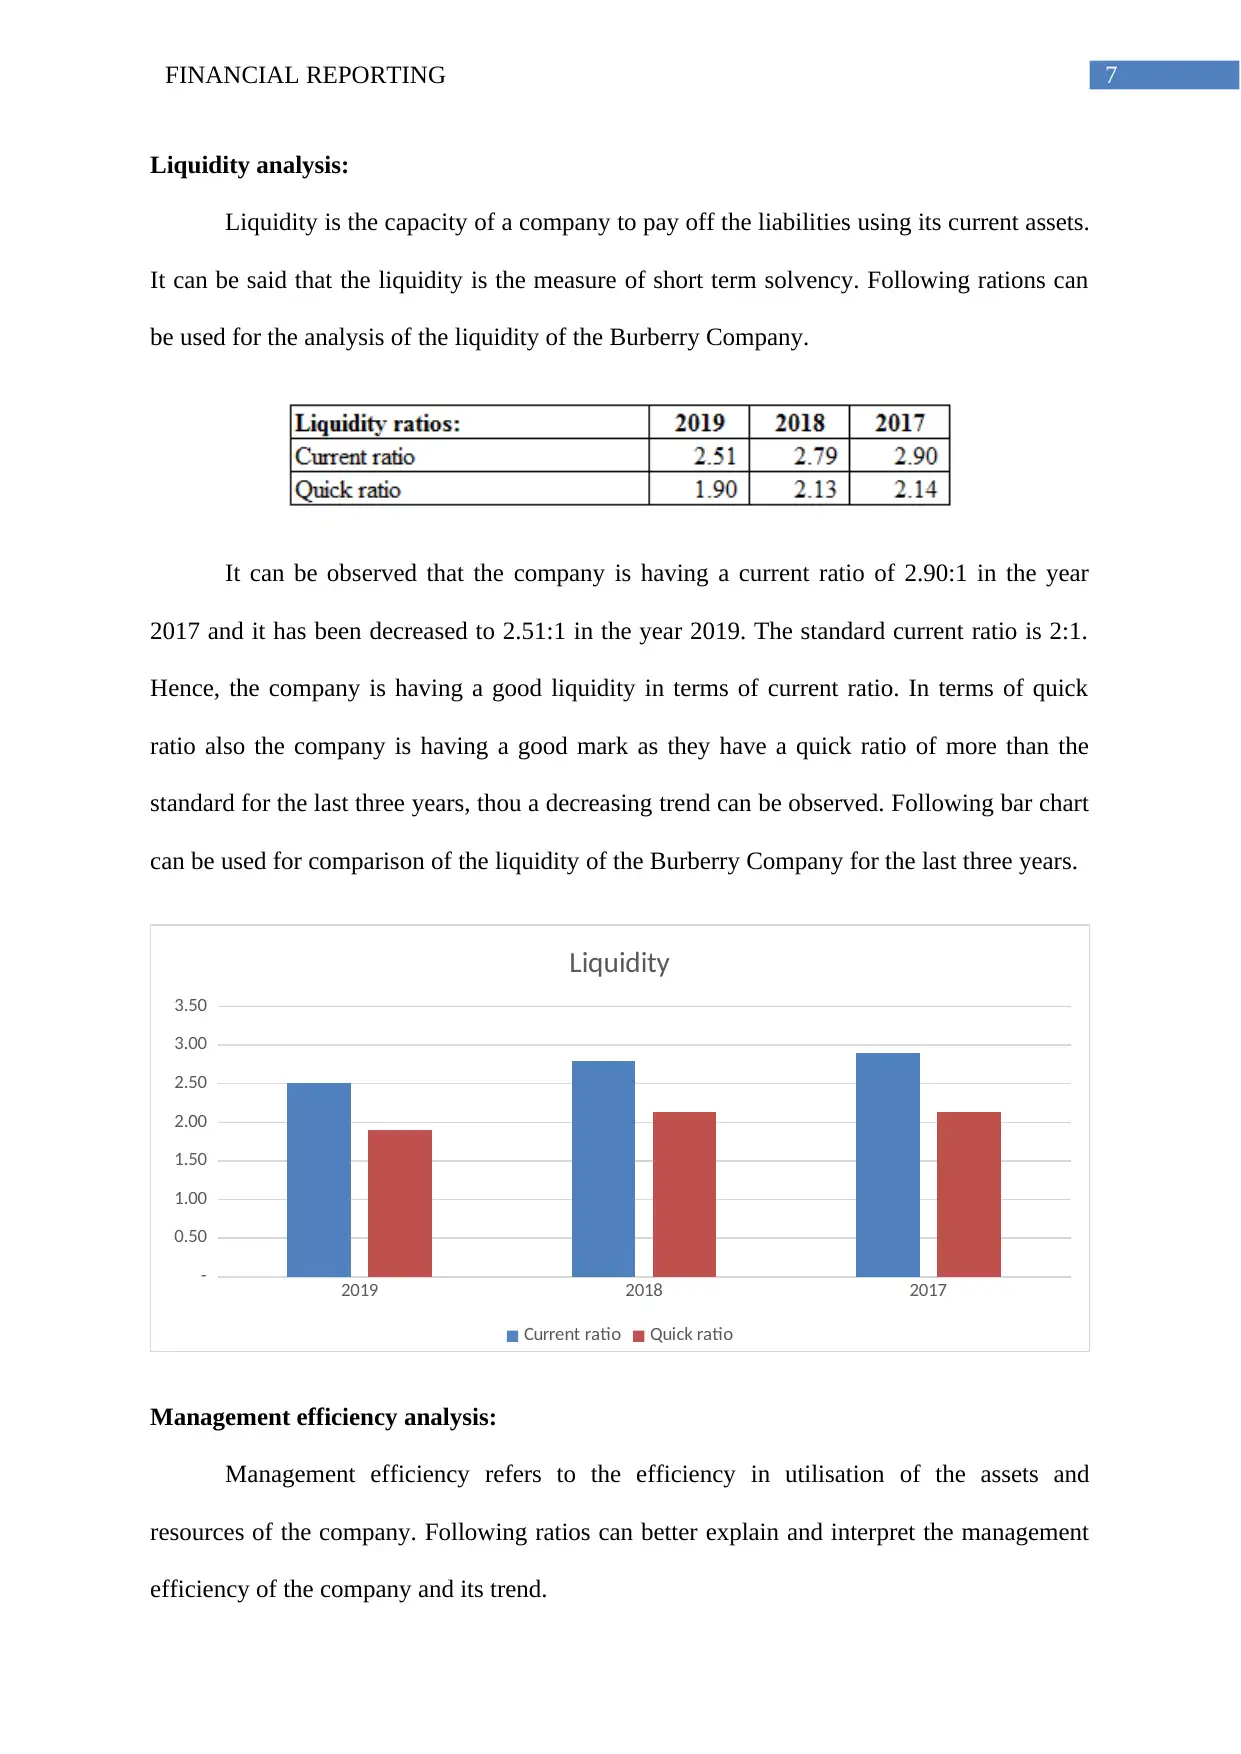
standard for the last three years, thou a decreasing trend can be observed. Following bar chart
can be used for comparison of the liquidity of the Burberry Company for the last three years.
2019 2018 2017
-
0.50
1.00
1.50
2.00
2.50
3.00
3.50
Liquidity
Current ratio Quick ratio
Management efficiency analysis:
Management efficiency refers to the efficiency in utilisation of the assets and
resources of the company. Following ratios can better explain and interpret the management
efficiency of the company and its trend.
Liquidity analysis:
Liquidity is the capacity of a company to pay off the liabilities using its current assets.
It can be said that the liquidity is the measure of short term solvency. Following rations can
be used for the analysis of the liquidity of the Burberry Company.
It can be observed that the company is having a current ratio of 2.90:1 in the year
2017 and it has been decreased to 2.51:1 in the year 2019. The standard current ratio is 2:1.
Hence, the company is having a good liquidity in terms of current ratio. In terms of quick
ratio also the company is having a good mark as they have a quick ratio of more than the
standard for the last three years, thou a decreasing trend can be observed. Following bar chart
can be used for comparison of the liquidity of the Burberry Company for the last three years.
2019 2018 2017
-
0.50
1.00
1.50
2.00
2.50
3.00
3.50
Liquidity
Current ratio Quick ratio
Management efficiency analysis:
Management efficiency refers to the efficiency in utilisation of the assets and
resources of the company. Following ratios can better explain and interpret the management
efficiency of the company and its trend.
8FINANCIAL REPORTING
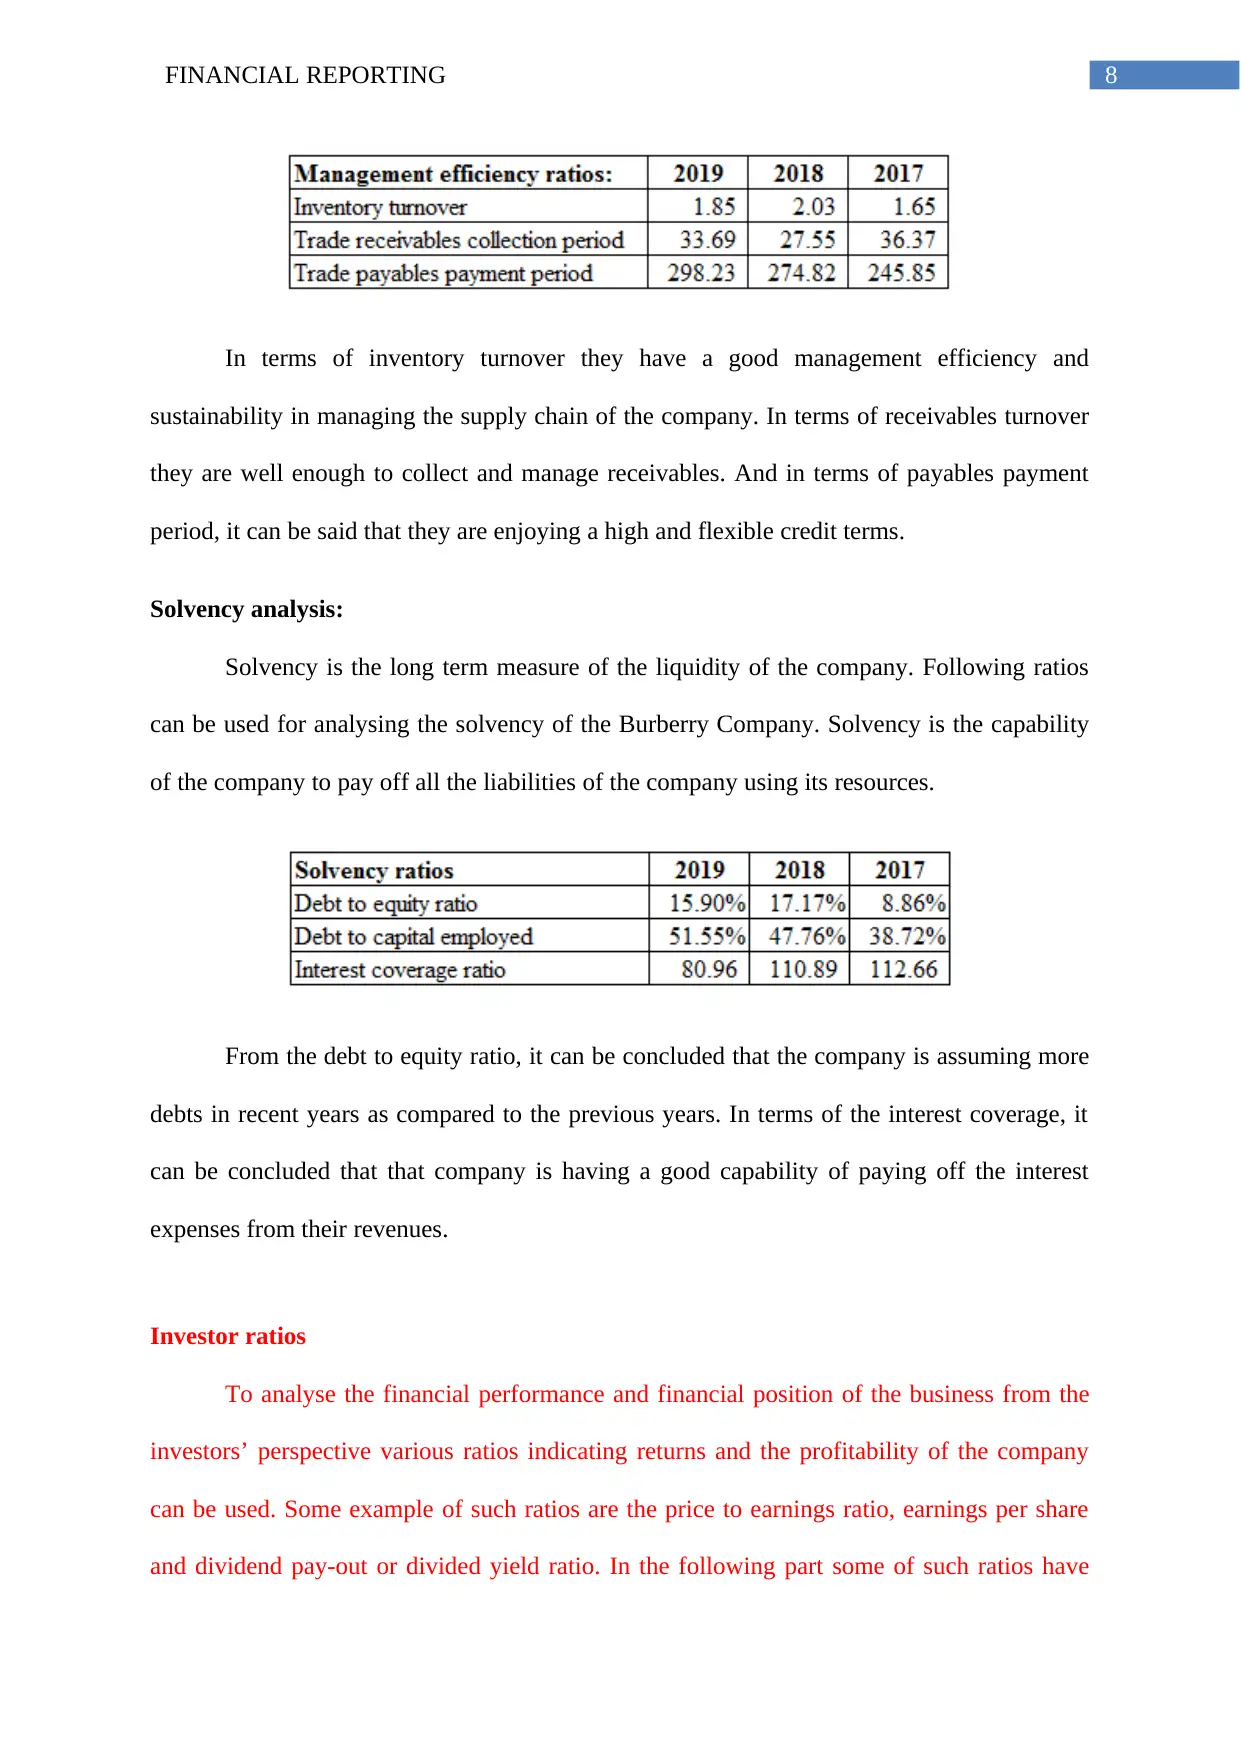
In terms of inventory turnover they have a good management efficiency and
sustainability in managing the supply chain of the company. In terms of receivables turnover
they are well enough to collect and manage receivables. And in terms of payables payment
period, it can be said that they are enjoying a high and flexible credit terms.
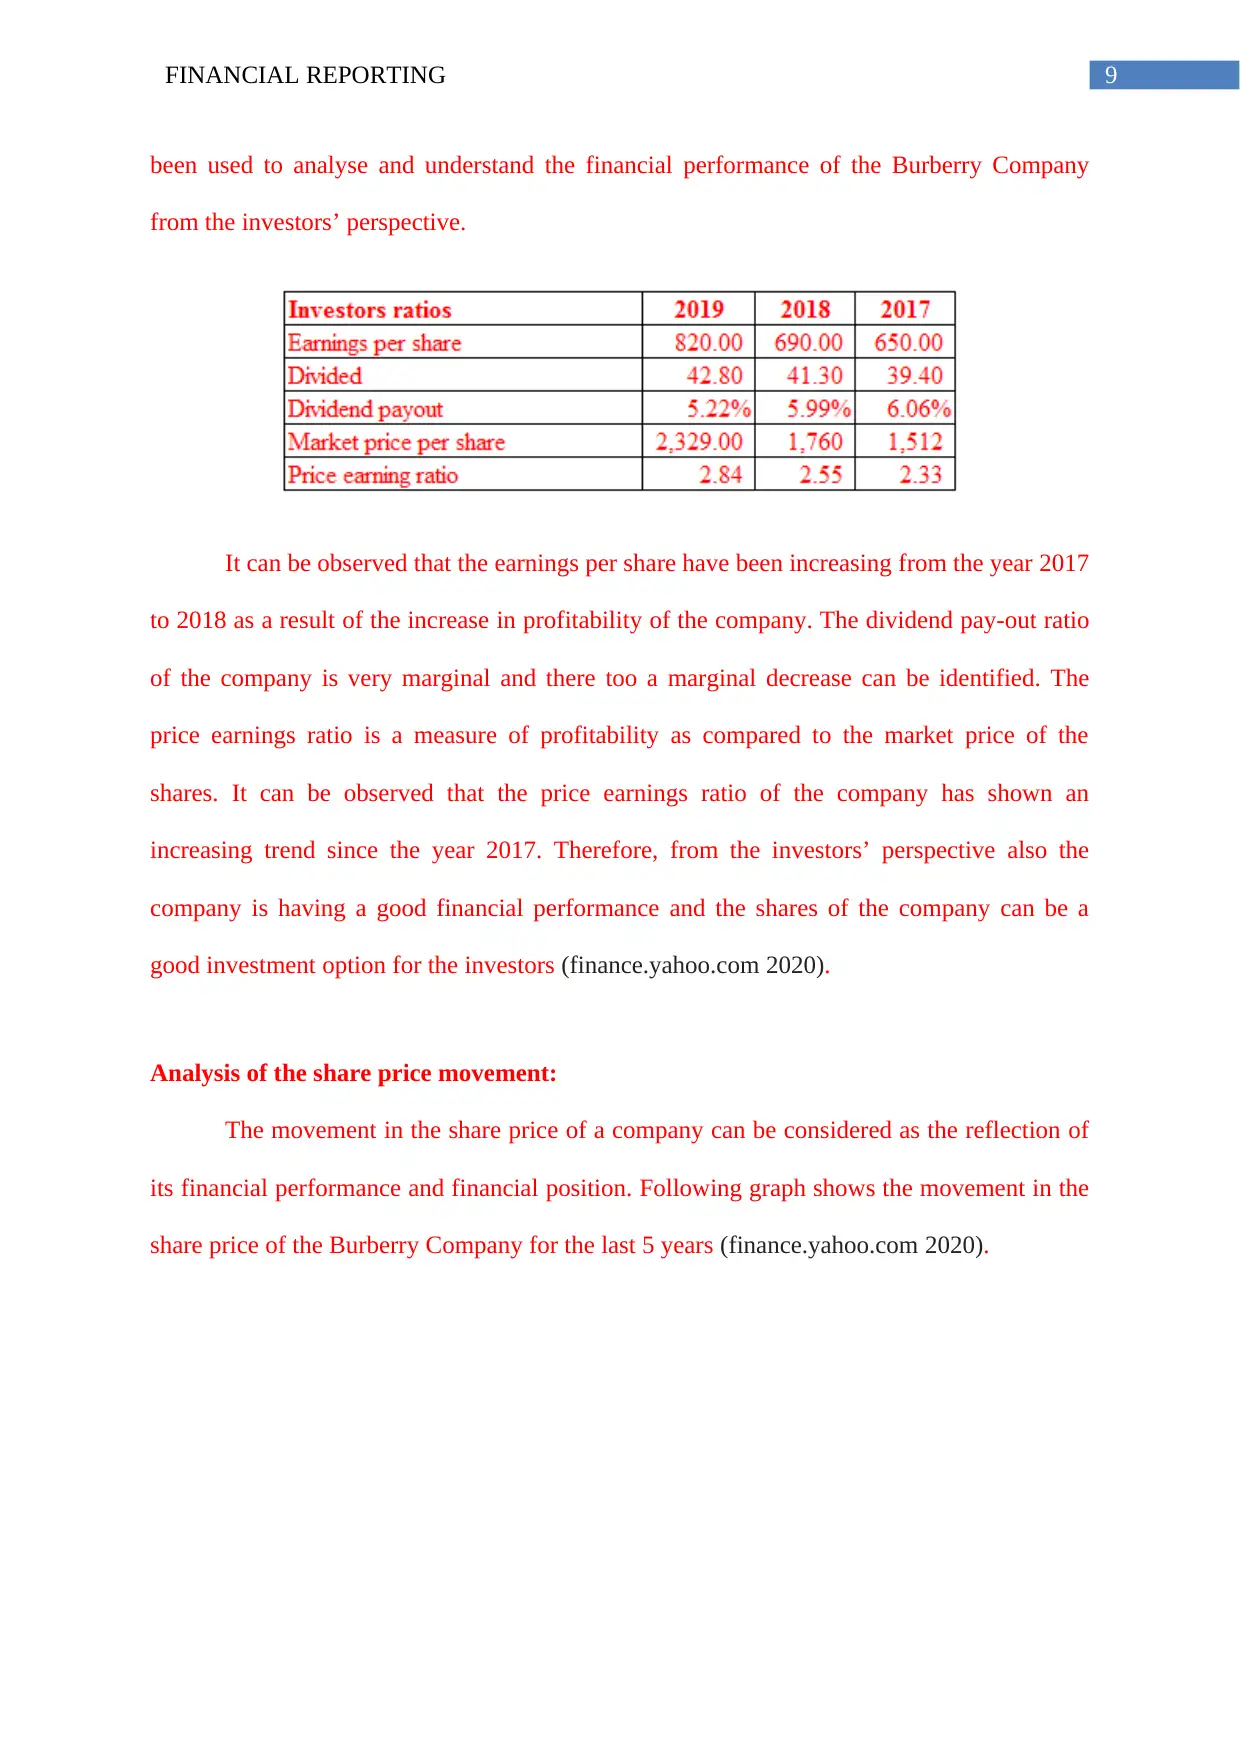
Solvency analysis:
Solvency is the long term measure of the liquidity of the company. Following ratios
can be used for analysing the solvency of the Burberry Company. Solvency is the capability
of the company to pay off all the liabilities of the company using its resources.
From the debt to equity ratio, it can be concluded that the company is assuming more
debts in recent years as compared to the previous years. In terms of the interest coverage, it
can be concluded that that company is having a good capability of paying off the interest
expenses from their revenues.
Investor ratios
To analyse the financial performance and financial position of the business from the
investors’ perspective various ratios indicating returns and the profitability of the company
can be used. Some example of such ratios are the price to earnings ratio, earnings per share
and dividend pay-out or divided yield ratio. In the following part some of such ratios have
In terms of inventory turnover they have a good management efficiency and
sustainability in managing the supply chain of the company. In terms of receivables turnover
they are well enough to collect and manage receivables. And in terms of payables payment
period, it can be said that they are enjoying a high and flexible credit terms.
Solvency analysis:
Solvency is the long term measure of the liquidity of the company. Following ratios
can be used for analysing the solvency of the Burberry Company. Solvency is the capability
of the company to pay off all the liabilities of the company using its resources.
From the debt to equity ratio, it can be concluded that the company is assuming more
debts in recent years as compared to the previous years. In terms of the interest coverage, it
can be concluded that that company is having a good capability of paying off the interest
expenses from their revenues.
Investor ratios
To analyse the financial performance and financial position of the business from the
investors’ perspective various ratios indicating returns and the profitability of the company
can be used. Some example of such ratios are the price to earnings ratio, earnings per share
and dividend pay-out or divided yield ratio. In the following part some of such ratios have
⊘ This is a preview!⊘
Do you want full access?
Subscribe today to unlock all pages.
Trusted by 1+ million students worldwide
9FINANCIAL REPORTING
been used to analyse and understand the financial performance of the Burberry Company
from the investors’ perspective.
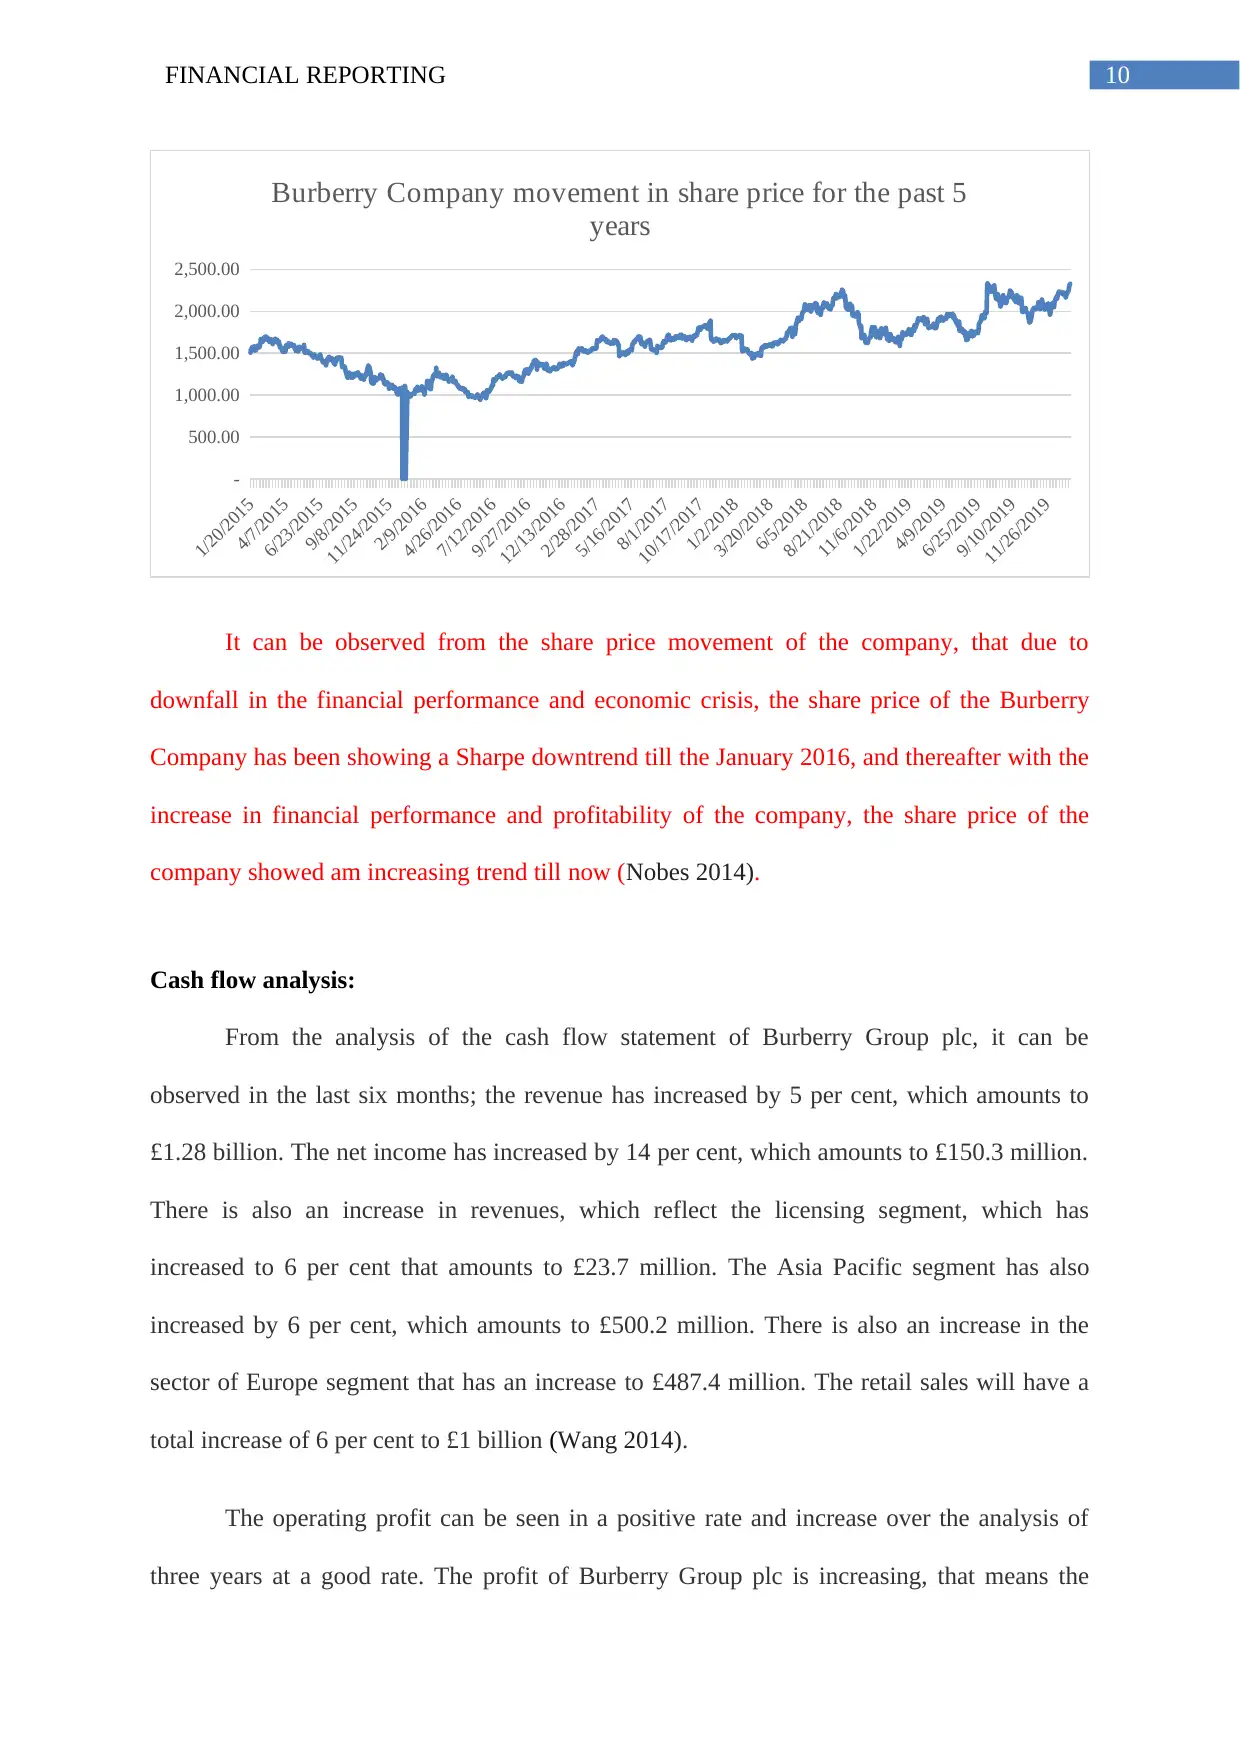
It can be observed that the earnings per share have been increasing from the year 2017
to 2018 as a result of the increase in profitability of the company. The dividend pay-out ratio
of the company is very marginal and there too a marginal decrease can be identified. The
price earnings ratio is a measure of profitability as compared to the market price of the
shares. It can be observed that the price earnings ratio of the company has shown an
increasing trend since the year 2017. Therefore, from the investors’ perspective also the
company is having a good financial performance and the shares of the company can be a
good investment option for the investors (finance.yahoo.com 2020).
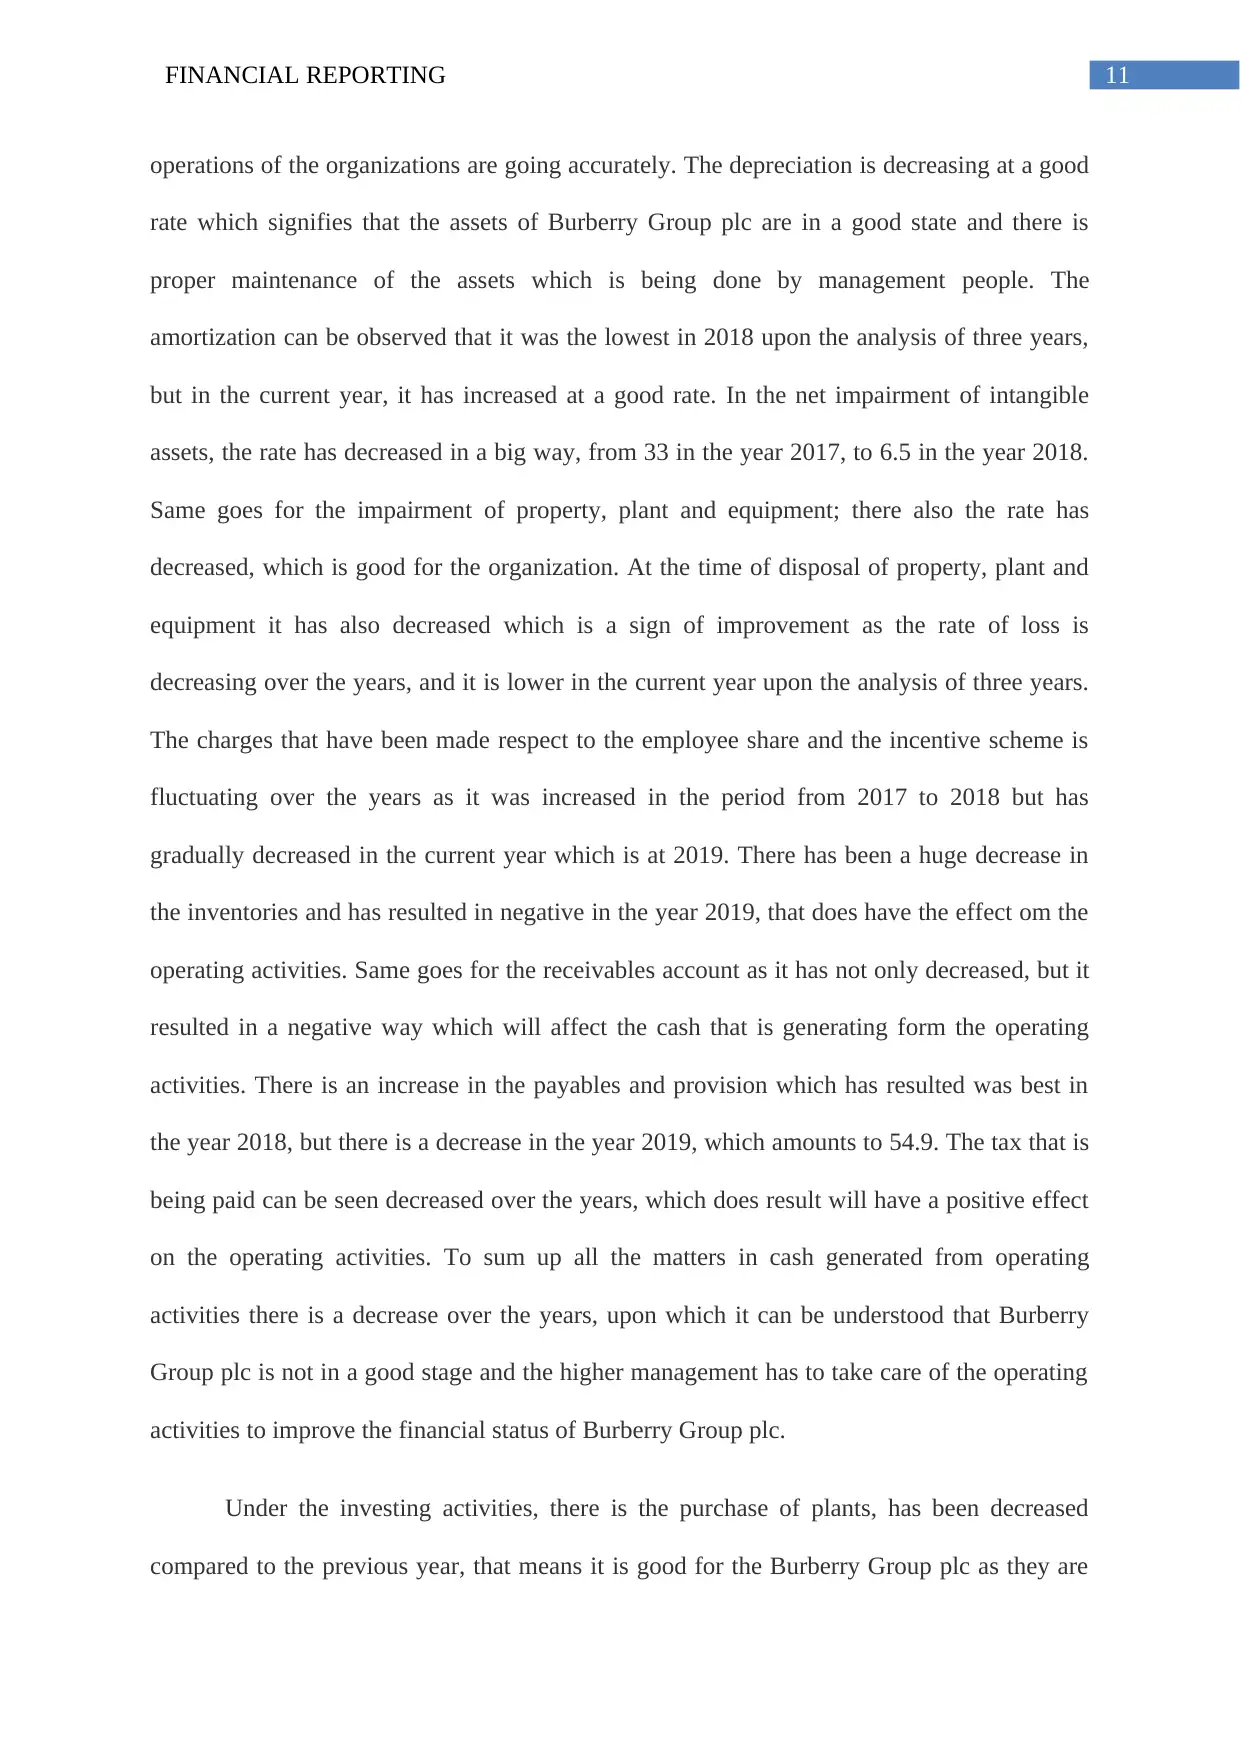
Analysis of the share price movement:
The movement in the share price of a company can be considered as the reflection of
its financial performance and financial position. Following graph shows the movement in the
share price of the Burberry Company for the last 5 years (finance.yahoo.com 2020).
been used to analyse and understand the financial performance of the Burberry Company
from the investors’ perspective.
It can be observed that the earnings per share have been increasing from the year 2017
to 2018 as a result of the increase in profitability of the company. The dividend pay-out ratio
of the company is very marginal and there too a marginal decrease can be identified. The
price earnings ratio is a measure of profitability as compared to the market price of the
shares. It can be observed that the price earnings ratio of the company has shown an
increasing trend since the year 2017. Therefore, from the investors’ perspective also the
company is having a good financial performance and the shares of the company can be a
good investment option for the investors (finance.yahoo.com 2020).
Analysis of the share price movement:
The movement in the share price of a company can be considered as the reflection of
its financial performance and financial position. Following graph shows the movement in the
share price of the Burberry Company for the last 5 years (finance.yahoo.com 2020).
Paraphrase This Document
Need a fresh take? Get an instant paraphrase of this document with our AI Paraphraser
10FINANCIAL REPORTING
1/20/2015
4/7/2015
6/23/2015
9/8/2015
11/24/2015
2/9/2016
4/26/2016
7/12/2016
9/27/2016
12/13/2016
2/28/2017
5/16/2017
8/1/2017
10/17/2017
1/2/2018
3/20/2018
6/5/2018
8/21/2018
11/6/2018
1/22/2019
4/9/2019
6/25/2019
9/10/2019
11/26/2019
-
500.00
1,000.00
1,500.00
2,000.00
2,500.00
Burberry Company movement in share price for the past 5
years
It can be observed from the share price movement of the company, that due to
downfall in the financial performance and economic crisis, the share price of the Burberry
Company has been showing a Sharpe downtrend till the January 2016, and thereafter with the
increase in financial performance and profitability of the company, the share price of the
company showed am increasing trend till now (Nobes 2014).
Cash flow analysis:
From the analysis of the cash flow statement of Burberry Group plc, it can be
observed in the last six months; the revenue has increased by 5 per cent, which amounts to
£1.28 billion. The net income has increased by 14 per cent, which amounts to £150.3 million.
There is also an increase in revenues, which reflect the licensing segment, which has
increased to 6 per cent that amounts to £23.7 million. The Asia Pacific segment has also
increased by 6 per cent, which amounts to £500.2 million. There is also an increase in the
sector of Europe segment that has an increase to £487.4 million. The retail sales will have a
total increase of 6 per cent to £1 billion (Wang 2014).
The operating profit can be seen in a positive rate and increase over the analysis of
three years at a good rate. The profit of Burberry Group plc is increasing, that means the
11FINANCIAL REPORTING
operations of the organizations are going accurately. The depreciation is decreasing at a good
rate which signifies that the assets of Burberry Group plc are in a good state and there is
proper maintenance of the assets which is being done by management people. The
amortization can be observed that it was the lowest in 2018 upon the analysis of three years,
but in the current year, it has increased at a good rate. In the net impairment of intangible
assets, the rate has decreased in a big way, from 33 in the year 2017, to 6.5 in the year 2018.
Same goes for the impairment of property, plant and equipment; there also the rate has
decreased, which is good for the organization. At the time of disposal of property, plant and
equipment it has also decreased which is a sign of improvement as the rate of loss is
decreasing over the years, and it is lower in the current year upon the analysis of three years.
The charges that have been made respect to the employee share and the incentive scheme is
fluctuating over the years as it was increased in the period from 2017 to 2018 but has
gradually decreased in the current year which is at 2019. There has been a huge decrease in
the inventories and has resulted in negative in the year 2019, that does have the effect om the
operating activities. Same goes for the receivables account as it has not only decreased, but it
resulted in a negative way which will affect the cash that is generating form the operating
activities. There is an increase in the payables and provision which has resulted was best in
the year 2018, but there is a decrease in the year 2019, which amounts to 54.9. The tax that is
being paid can be seen decreased over the years, which does result will have a positive effect
on the operating activities. To sum up all the matters in cash generated from operating
activities there is a decrease over the years, upon which it can be understood that Burberry
Group plc is not in a good stage and the higher management has to take care of the operating
activities to improve the financial status of Burberry Group plc.
Under the investing activities, there is the purchase of plants, has been decreased
compared to the previous year, that means it is good for the Burberry Group plc as they are
⊘ This is a preview!⊘
Do you want full access?
Subscribe today to unlock all pages.
Trusted by 1+ million students worldwide
1 out of 24
Related Documents


Your All-in-One AI-Powered Toolkit for Academic Success.
+13062052269
info@desklib.com
Available 24*7 on WhatsApp / Email
![[object Object]](/_next/static/media/star-bottom.7253800d.svg)
Unlock your academic potential
Copyright © 2020–2026 A2Z Services. All Rights Reserved. Developed and managed by ZUCOL.