Financial Performance Analysis and Reporting: Finance for Business

Verified

Added on  2020/05/28

|9
|1585
|48
Report
AI Summary
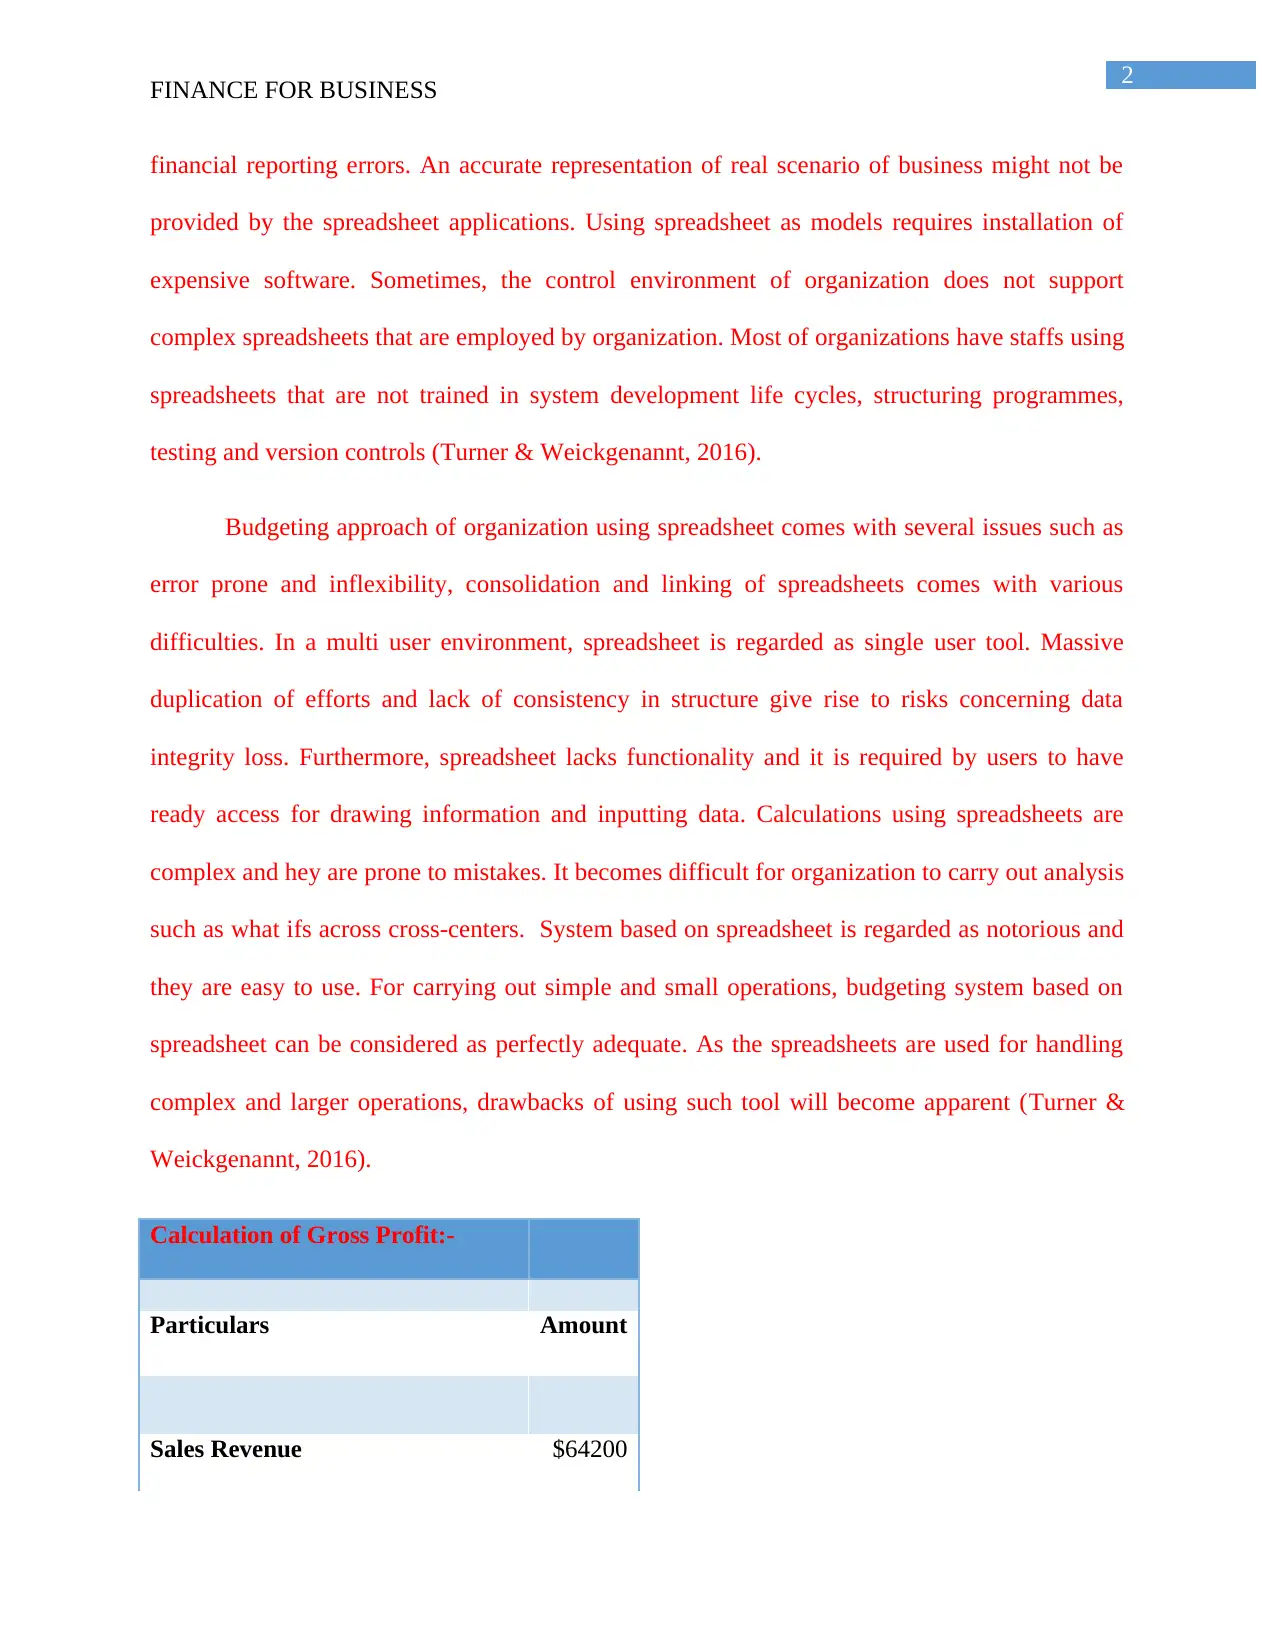
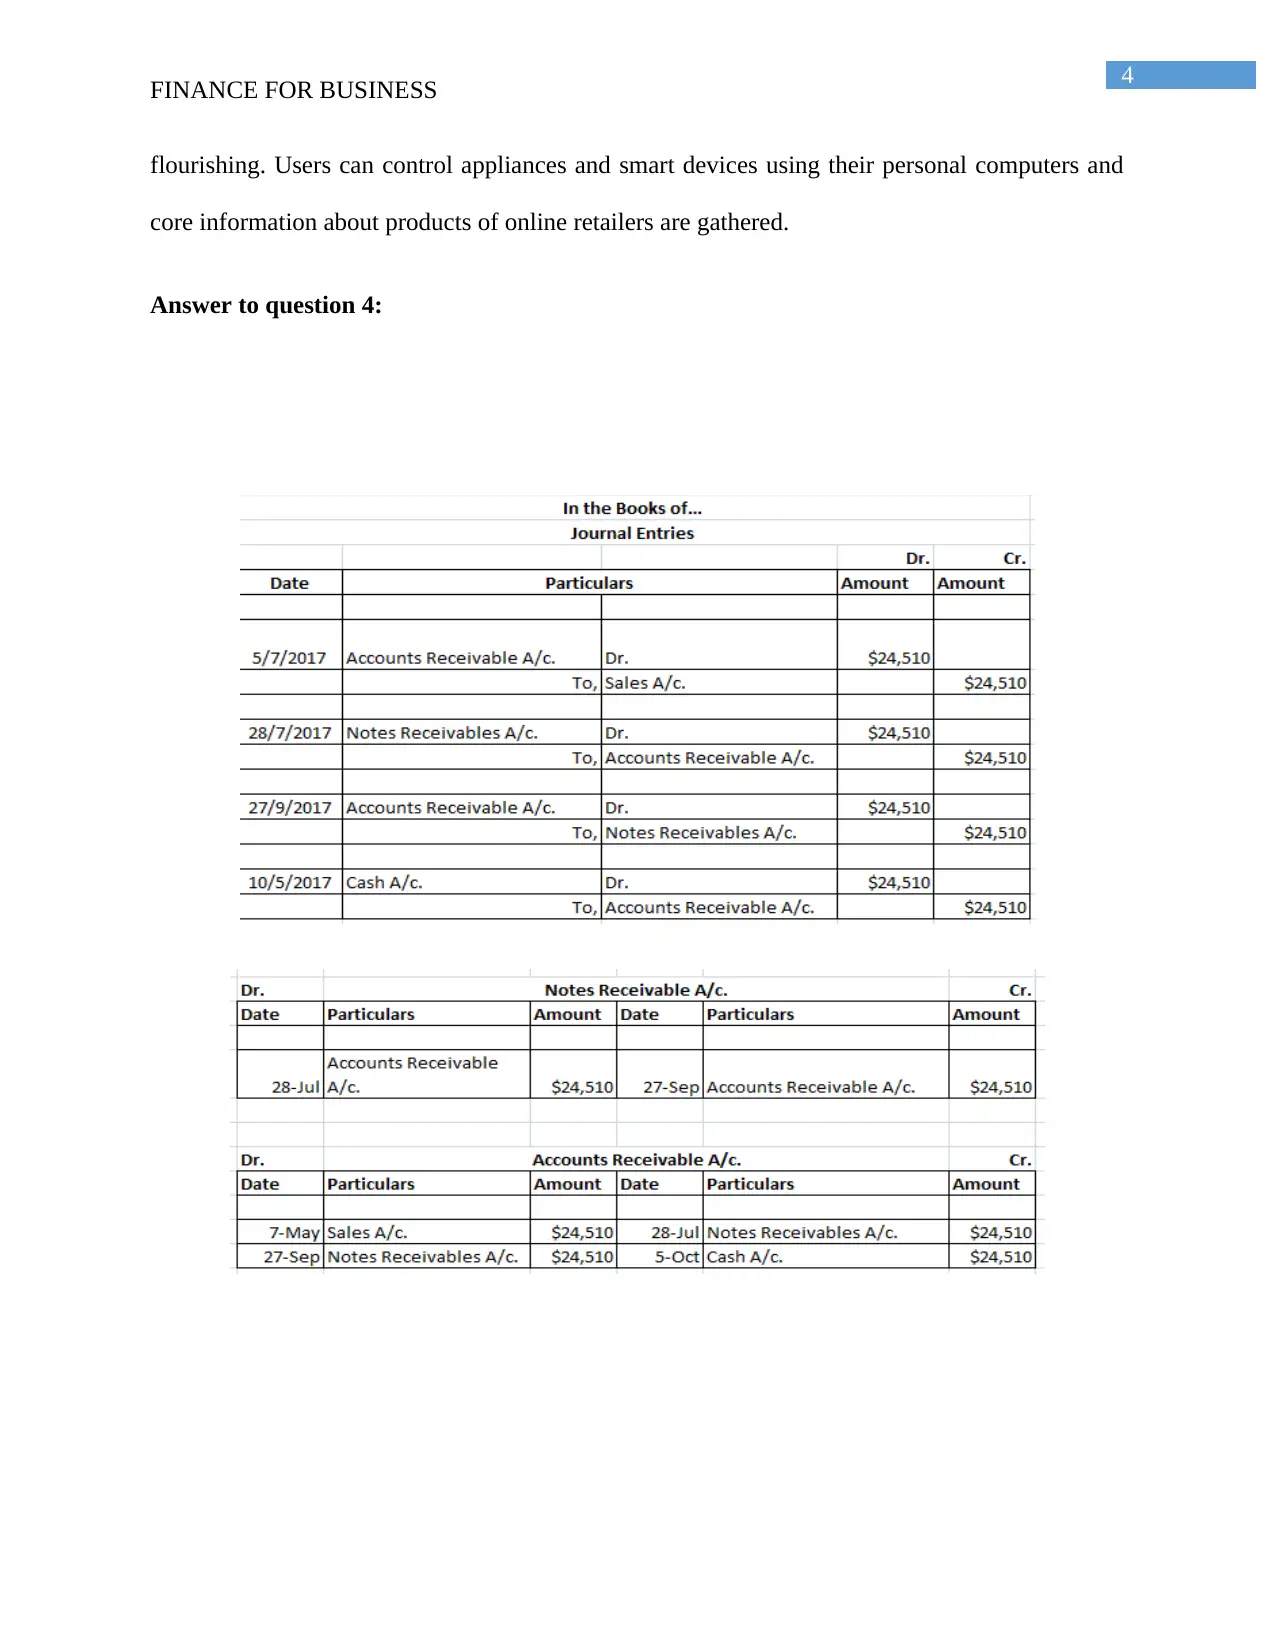
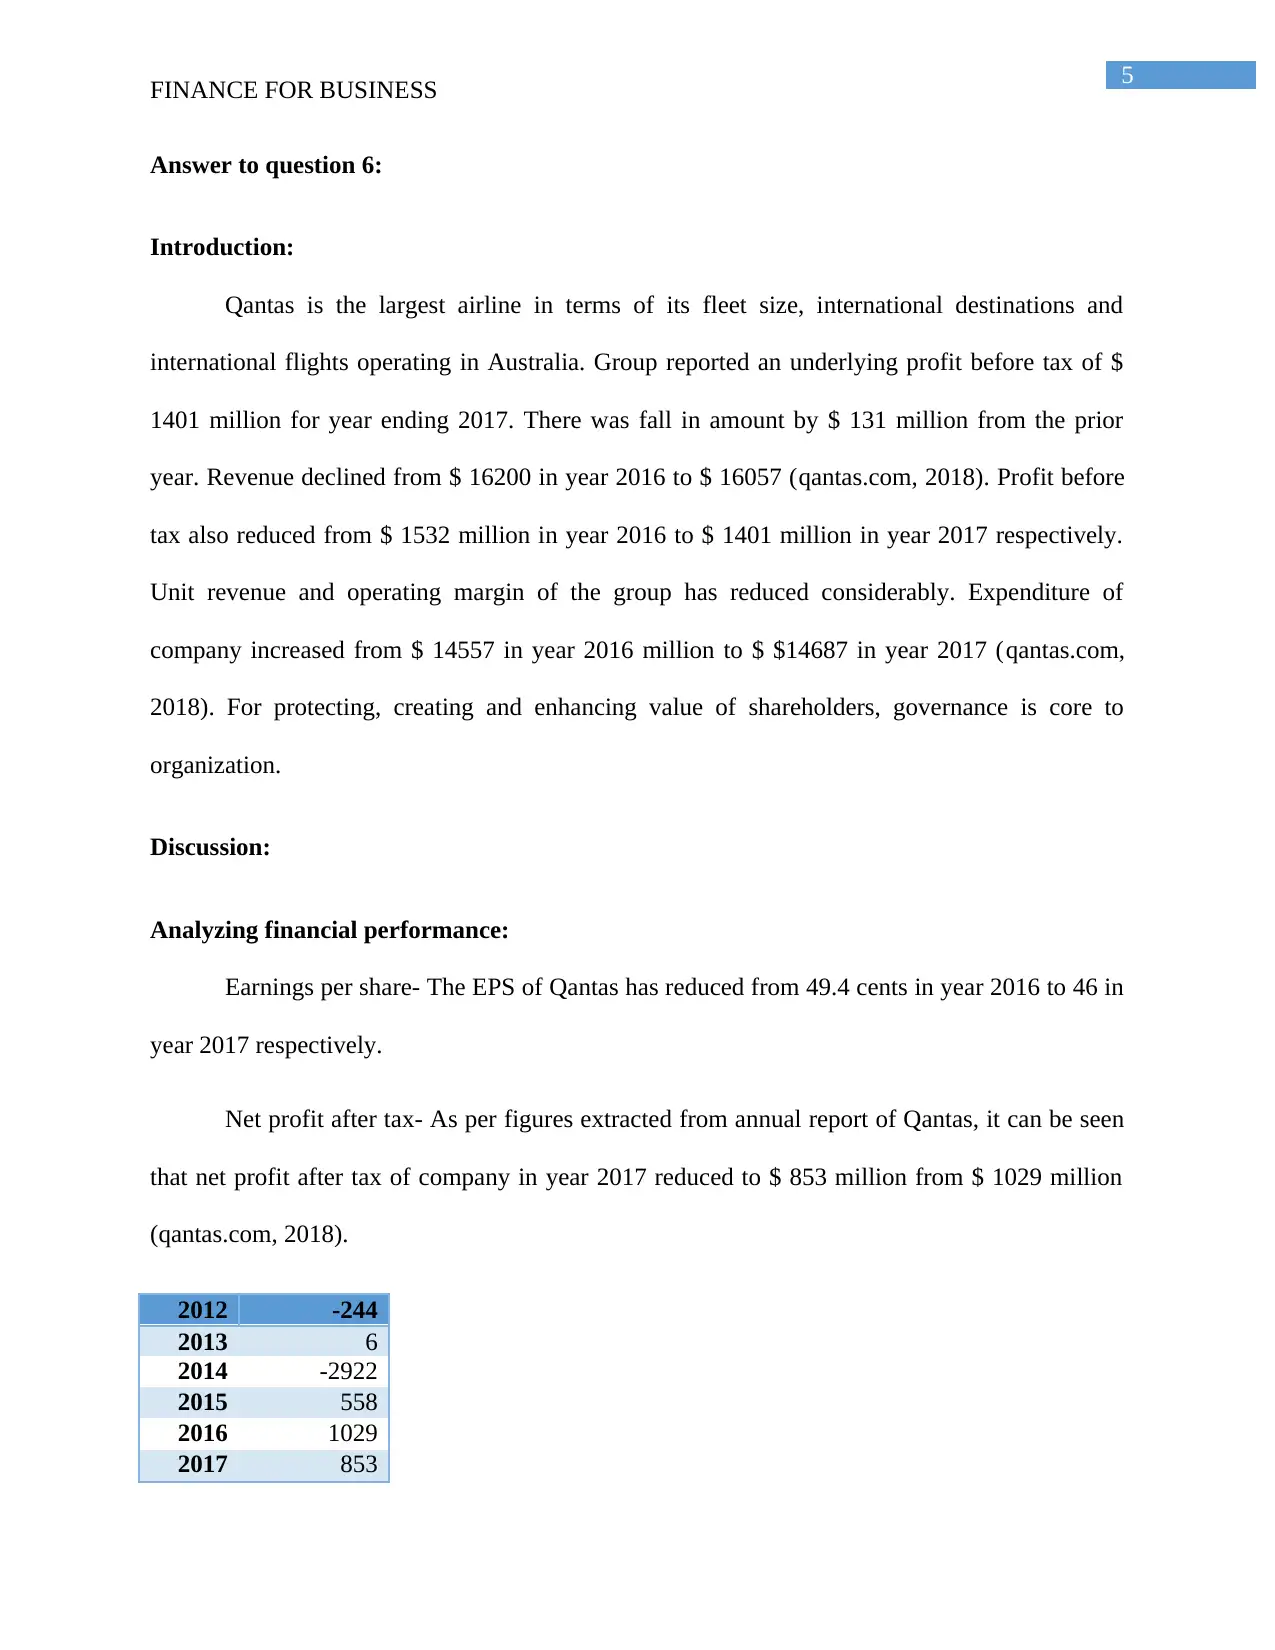
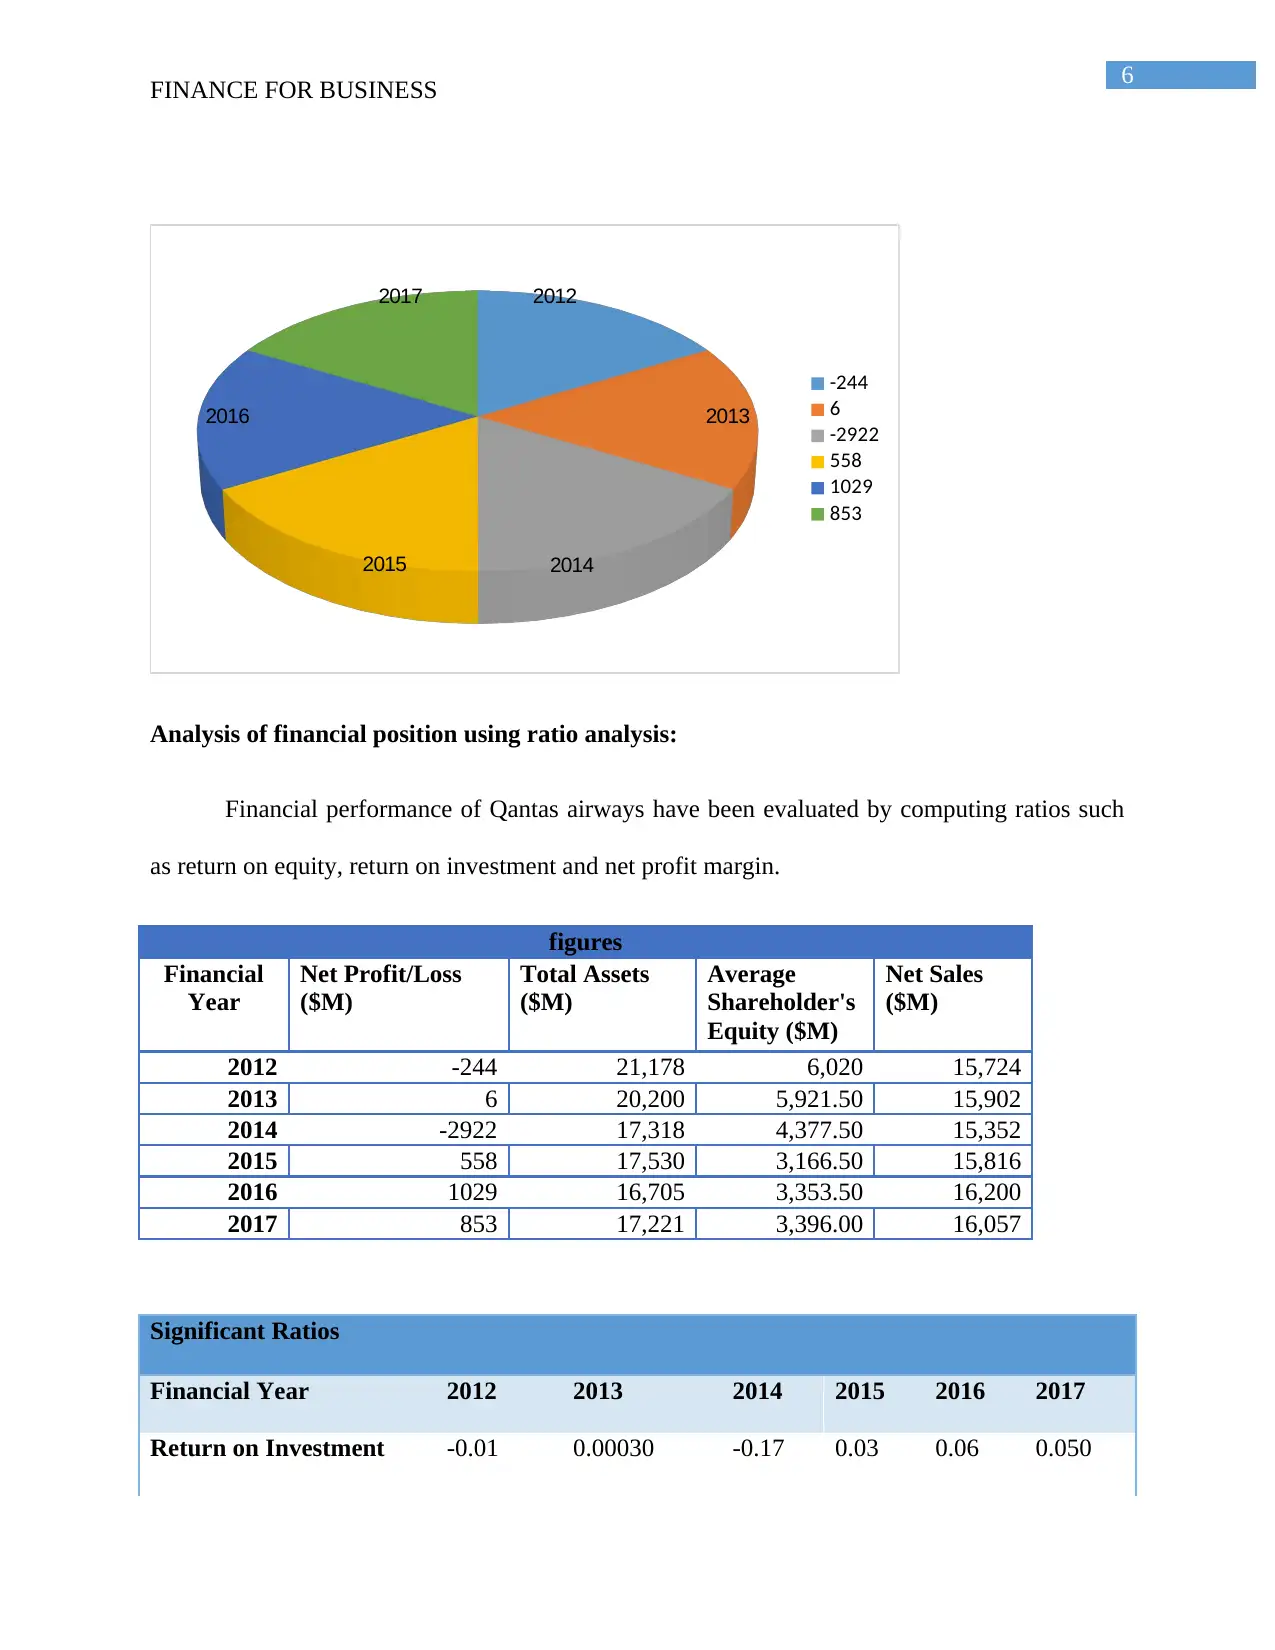
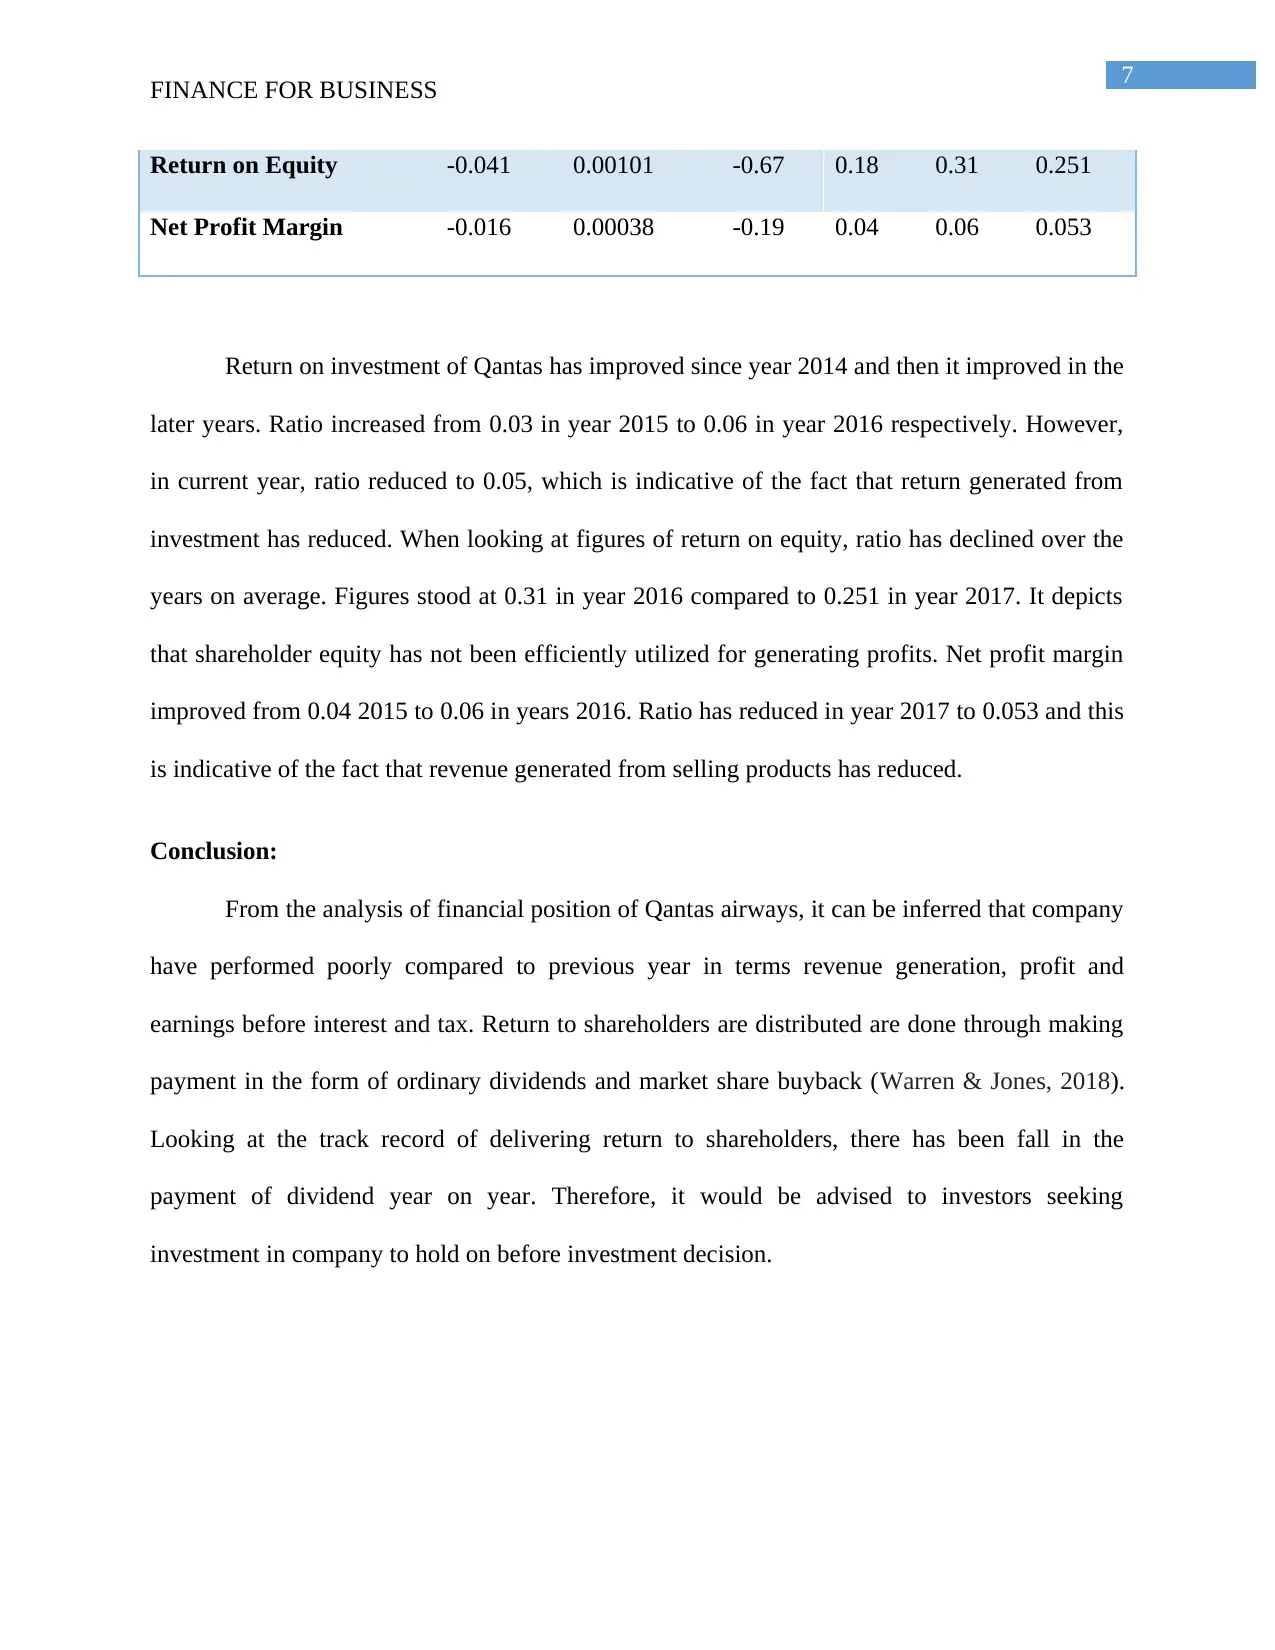
This report delves into the application of financial analysis in a business context, emphasizing the use of spreadsheets in financial reporting and decision-making. It explores the advantages and disadvantages of spreadsheets, including their role in tracking, budgeting, and complex financial modeling. The report includes a calculation of Gross Profit and proceeds to analyze the financial performance of Qantas Airways. The analysis covers key financial metrics such as Earnings per Share (EPS), Net Profit After Tax, Return on Investment (ROI), Return on Equity (ROE), and Net Profit Margin. The report concludes with an assessment of Qantas' financial position, offering insights into its revenue generation, profitability, and shareholder returns, providing recommendations for investors. The document is contributed by a student to be published on the website Desklib, a platform which provides all the necessary AI based study tools for students.
tabler-icon-diamond-filled.svg

Contribute Materials

Your contribution can guide someone’s learning journey. Share your documents today.
Document Page
Running head: FINANCE FOR BUSINESS
Finance for Business
Name of the university
Name of the student
Authors note
tabler-icon-diamond-filled.svg

Secure Best Marks with AI Grader

Need help grading? Try our AI Grader for instant feedback on your assignments.
Document Page
1
FINANCE FOR BUSINESS
Answer to question 1:
Spreadsheet is one of the key tools in the operational and financial reporting process for
any business. It is regarded as an integral part of decision making and information framework for
companies. Use of applications of spreadsheets has become sophisticated. The application of
spreadsheet is incorporated in the innumerable number of business functions such as tracking
process of workflow, estimating accounting and key financial reporting. Organization is able to
critical decisions by the benefits offered by spreadsheets. Spreadsheet management comes with
the risk intelligent approach that helps in substantial mitigation of application and systematic
flaws. Organization can have direct impact on compliance and financial reporting by the
installation of audible and effective controls. Every business day accounting of organizations are
revolutionized by electronic spreadsheets. Spreadsheets help in supporting simple functions such
as tracking, logging and totaling information (Lopez-Valeiras et al., 2015). On other hand,
spreadsheets with enhanced formulas help in supporting complex business functions such as
valuation models as it comes with more advanced features. Accounting business and accountants
together as a whole receives many benefits from spreadsheet such as better linking of data, easy
tracking of payment and they provide useful format for the formatting purpose. Most of
organizations use spreadsheet as a tool for planning business and budgeting purpose. Spreadsheet
is developed as a tool for aiding productivity (Laudon & Laudon, 2016).
Disadvantages of spreadsheets are associated with its complexities and its associated
issues and potential risks. It is certainly possible that spreadsheets will make some errors such as
logic errors, input errors and some other errors. One of the greatest risk posed by spreadsheets
are modifying the files, ostensible simplicity and the ability to share. When there is lack of
control over spreadsheets, then it has the likelihood of becoming contributing factor in making
Document Page
2
FINANCE FOR BUSINESS
financial reporting errors. An accurate representation of real scenario of business might not be
provided by the spreadsheet applications. Using spreadsheet as models requires installation of
expensive software. Sometimes, the control environment of organization does not support
complex spreadsheets that are employed by organization. Most of organizations have staffs using
spreadsheets that are not trained in system development life cycles, structuring programmes,
testing and version controls (Turner & Weickgenannt, 2016).
Budgeting approach of organization using spreadsheet comes with several issues such as
error prone and inflexibility, consolidation and linking of spreadsheets comes with various
difficulties. In a multi user environment, spreadsheet is regarded as single user tool. Massive
duplication of efforts and lack of consistency in structure give rise to risks concerning data
integrity loss. Furthermore, spreadsheet lacks functionality and it is required by users to have
ready access for drawing information and inputting data. Calculations using spreadsheets are
complex and hey are prone to mistakes. It becomes difficult for organization to carry out analysis
such as what ifs across cross-centers. System based on spreadsheet is regarded as notorious and
they are easy to use. For carrying out simple and small operations, budgeting system based on
spreadsheet can be considered as perfectly adequate. As the spreadsheets are used for handling
complex and larger operations, drawbacks of using such tool will become apparent (Turner &
Weickgenannt, 2016).
Calculation of Gross Profit:-
Particulars Amount
Sales Revenue $64200
Document Page
3
FINANCE FOR BUSINESS
Less: Cost of Goods Sold $3200
GROSS PROFIT $61000
Answer to question 2:
Answer to question 3:
A quicker way of information is provided to customers using computer as they help in
providing internet access. Online retailer such as Ebay have evolved and expanded over years by
making their activities popular among customers through internet platform. Customers surfing
websites of company such as Ebay are prepared to trust them and take confidence in buying their
products. Computers are very essential for enabling business to become popular among
customers and rapid advancement in technology helps online retailers such as Ebay in
Dr. Cr.
Date Amount Amount
04-12-2017 Accounts Receivable A/c. Dr. $8,560
To, Sales A/c. $8,560
30/4/2017 Cash A/c. Dr. $4,280
To, Accounts Receivable A/c. $4,280
30-05-2017 Bad Debts Expenses A/c. Dr. $4,280
To, Accounts Receivable A/c. $4,280
15/6/2017 Cash A/c. Dr. $4,280
To, Bad Debt Recoveree A/c. $4,280
Particulars
In the Books of…
Journal Entries
tabler-icon-diamond-filled.svg

Secure Best Marks with AI Grader

Need help grading? Try our AI Grader for instant feedback on your assignments.
Document Page
4
FINANCE FOR BUSINESS
flourishing. Users can control appliances and smart devices using their personal computers and
core information about products of online retailers are gathered.
Answer to question 4:
Document Page
5
FINANCE FOR BUSINESS
Answer to question 6:
Introduction:
Qantas is the largest airline in terms of its fleet size, international destinations and
international flights operating in Australia. Group reported an underlying profit before tax of $
1401 million for year ending 2017. There was fall in amount by $ 131 million from the prior
year. Revenue declined from $ 16200 in year 2016 to $ 16057 (qantas.com, 2018). Profit before
tax also reduced from $ 1532 million in year 2016 to $ 1401 million in year 2017 respectively.
Unit revenue and operating margin of the group has reduced considerably. Expenditure of
company increased from $ 14557 in year 2016 million to $ $14687 in year 2017 (qantas.com,
2018). For protecting, creating and enhancing value of shareholders, governance is core to
organization.
Discussion:
Analyzing financial performance:
Earnings per share- The EPS of Qantas has reduced from 49.4 cents in year 2016 to 46 in
year 2017 respectively.
Net profit after tax- As per figures extracted from annual report of Qantas, it can be seen
that net profit after tax of company in year 2017 reduced to $ 853 million from $ 1029 million
(qantas.com, 2018).
2012 -244
2013 6
2014 -2922
2015 558
2016 1029
2017 853
Document Page
6
FINANCE FOR BUSINESS
2012
2013
20142015
2016
2017
-244
6
-2922
558
1029
853
Analysis of financial position using ratio analysis:
Financial performance of Qantas airways have been evaluated by computing ratios such
as return on equity, return on investment and net profit margin.
figures
Financial
Year
Net Profit/Loss
($M)
Total Assets
($M)
Average
Shareholder's
Equity ($M)
Net Sales
($M)
2012 -244 21,178 6,020 15,724
2013 6 20,200 5,921.50 15,902
2014 -2922 17,318 4,377.50 15,352
2015 558 17,530 3,166.50 15,816
2016 1029 16,705 3,353.50 16,200
2017 853 17,221 3,396.00 16,057
Significant Ratios
Financial Year 2012 2013 2014 2015 2016 2017
Return on Investment -0.01 0.00030 -0.17 0.03 0.06 0.050
tabler-icon-diamond-filled.svg

Paraphrase This Document

Need a fresh take? Get an instant paraphrase of this document with our AI Paraphraser
Document Page
7
FINANCE FOR BUSINESS
Return on Equity -0.041 0.00101 -0.67 0.18 0.31 0.251
Net Profit Margin -0.016 0.00038 -0.19 0.04 0.06 0.053
Return on investment of Qantas has improved since year 2014 and then it improved in the
later years. Ratio increased from 0.03 in year 2015 to 0.06 in year 2016 respectively. However,
in current year, ratio reduced to 0.05, which is indicative of the fact that return generated from
investment has reduced. When looking at figures of return on equity, ratio has declined over the
years on average. Figures stood at 0.31 in year 2016 compared to 0.251 in year 2017. It depicts
that shareholder equity has not been efficiently utilized for generating profits. Net profit margin
improved from 0.04 2015 to 0.06 in years 2016. Ratio has reduced in year 2017 to 0.053 and this
is indicative of the fact that revenue generated from selling products has reduced.
Conclusion:
From the analysis of financial position of Qantas airways, it can be inferred that company
have performed poorly compared to previous year in terms revenue generation, profit and
earnings before interest and tax. Return to shareholders are distributed are done through making
payment in the form of ordinary dividends and market share buyback (Warren & Jones, 2018).
Looking at the track record of delivering return to shareholders, there has been fall in the
payment of dividend year on year. Therefore, it would be advised to investors seeking
investment in company to hold on before investment decision.
Document Page
8
FINANCE FOR BUSINESS
References lists:
Collier, P. M. (2015). Accounting for managers: Interpreting accounting information for
decision making. John Wiley & Sons.
Investor.qantas.com. (2018). Qantas | 2017 Annual Report. [online] Available at:
http://investor.qantas.com/annual-report-2017/ [Accessed 15 Jan. 2018].
Laudon, K. C., & Laudon, J. P. (2016). Management information system. Pearson Education
India.
Lopez-Valeiras, E., Gomez-Conde, J., & Naranjo-Gil, D. (2015). Sustainable innovation,
management accounting and control systems, and international
performance. Sustainability, 7(3), 3479-3492.
Turner, L., & Weickgenannt, A. B. (2016). Accounting Information Systems: The Processes and
Controls. John Wiley & Sons.
Warren, C. S., & Jones, J. (2018). Corporate financial accounting. Cengage Learning.
Weygandt, J. J., Kimmel, P. D., & Kieso, D. E. (2015). Financial & Managerial Accounting.
John Wiley & Sons.
chevron_up_icon
1 out of 9
circle_padding
hide_on_mobile
zoom_out_icon
logo.png

Your All-in-One AI-Powered Toolkit for Academic Success.

Available 24*7 on WhatsApp / Email

[object Object]