Analysis of Financial Performance: Caltex Australia Limited 2017-2018
VerifiedAdded on 2022/11/22
|20
|2763
|445
Report
AI Summary
This report presents a comprehensive financial analysis of Caltex Australia Limited, focusing on its performance in the fiscal years 2017 and 2018. The analysis begins with an introduction to the company, followed by an examination of its financial statements, including the income statement, statement of financial position, and cash flow statement. The report conducts both horizontal and vertical analyses to compare the two years and identify trends. Furthermore, the report delves into financial ratio analysis, covering profitability, liquidity, efficiency, and capital structure ratios. The findings reveal insights into Caltex's financial health, including changes in revenue, expenses, profitability margins, and debt levels. The analysis highlights improvements and deteriorations in key financial metrics, providing a detailed understanding of the company's financial performance over the specified period. The report concludes with a summary of the key findings and includes appendices with detailed financial statements and ratio calculations, supported by APA-style referencing.
Accounting for managers
Name of the student
Name of the university
Student ID
Author note
Name of the student
Name of the university
Student ID
Author note
Paraphrase This Document
Need a fresh take? Get an instant paraphrase of this document with our AI Paraphraser
Executive summary
Aim of the task is to focus on the financial performance of the ASX listed company Caltex
Australia Limited for the year closed for 2018 and compare the same with the previous year. For
analysing the performance the report will analyse the set f financial statements including cash
flow statement, statement of financial position and income statement. Further, report will analyse
the performances using different financial ratios.
Table of Contents
Introduction......................................................................................................................................4
Analysis of financial statement........................................................................................................4
Income statement.........................................................................................................................4
Statement of financial position....................................................................................................5
Cash flow statement.....................................................................................................................6
Financial ratio analysis....................................................................................................................6
Profitability ratio..........................................................................................................................7
Liquidity ratio..............................................................................................................................8
Efficiency ratio............................................................................................................................9
Capital structure ratios.................................................................................................................9
Conclusion.....................................................................................................................................10
Reference.......................................................................................................................................11
Appendix........................................................................................................................................13
Income statement.......................................................................................................................13
Statement of financial position..................................................................................................15
Cash flow statement...................................................................................................................18
Ratio analysis.............................................................................................................................19
⊘ This is a preview!⊘
Do you want full access?
Subscribe today to unlock all pages.
Trusted by 1+ million students worldwide
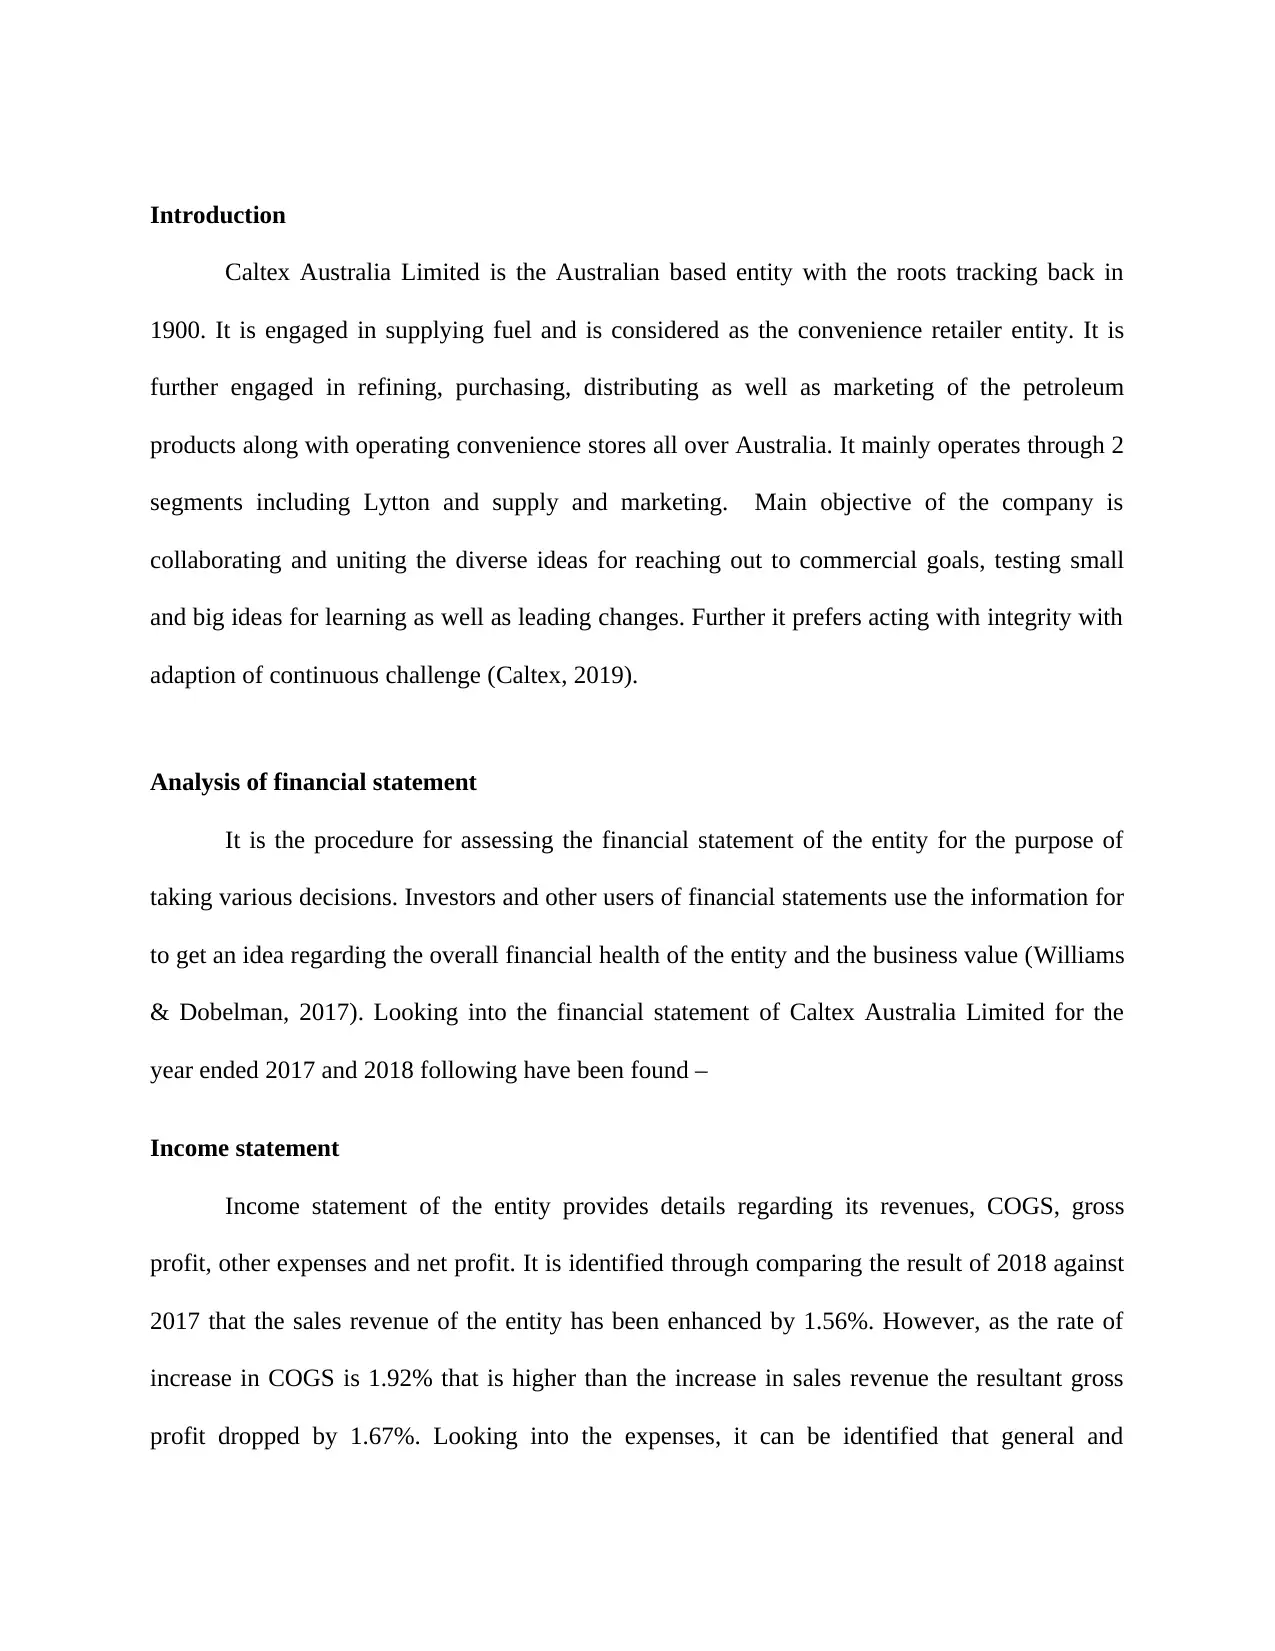
Introduction
Caltex Australia Limited is the Australian based entity with the roots tracking back in
1900. It is engaged in supplying fuel and is considered as the convenience retailer entity. It is
further engaged in refining, purchasing, distributing as well as marketing of the petroleum
products along with operating convenience stores all over Australia. It mainly operates through 2
segments including Lytton and supply and marketing. Main objective of the company is
collaborating and uniting the diverse ideas for reaching out to commercial goals, testing small
and big ideas for learning as well as leading changes. Further it prefers acting with integrity with
adaption of continuous challenge (Caltex, 2019).
Analysis of financial statement
It is the procedure for assessing the financial statement of the entity for the purpose of
taking various decisions. Investors and other users of financial statements use the information for
to get an idea regarding the overall financial health of the entity and the business value (Williams
& Dobelman, 2017). Looking into the financial statement of Caltex Australia Limited for the
year ended 2017 and 2018 following have been found –
Income statement
Income statement of the entity provides details regarding its revenues, COGS, gross
profit, other expenses and net profit. It is identified through comparing the result of 2018 against
2017 that the sales revenue of the entity has been enhanced by 1.56%. However, as the rate of
increase in COGS is 1.92% that is higher than the increase in sales revenue the resultant gross
profit dropped by 1.67%. Looking into the expenses, it can be identified that general and
Paraphrase This Document
Need a fresh take? Get an instant paraphrase of this document with our AI Paraphraser
administrative expenses has been went up by significant amount of $ 56,011 that is 33.30%
(Zainudin & Hashim, 2016). Owing to this and increase in COGS net profit reduced in 2018 as
against 2017 by 9.53%. If the earnings and expenses are vertically compared it can be identified
that profit in the 2018 has been deteriorated against 2017. Same can be established through the
fact that gross profit reduced to 9.78% as against 10.10% for 2017, operational profit reduced to
3.77% as against 4.35% for 2017 and finally net profit reduced to 2.58% as against 2.90% for
2017. Hence not only the bottom line, overall profitability position of the entity in 2018
deteriorated it is compared with the profitability position for the year 2017 (Caltex, 2019).
Statement of financial position
Balance sheet of the entity provides details regarding its assets, liabilities and equity.
Analysing the balance sheet of the entity it can be identified that the current assets of the entity
have been enhanced by $ 143,962 or by 5.28%. On the contrary, current liabilities of the entity
have been reduced by $ 164,475 or by 6.97%. This is signifying that the liquidity position of the
entity has been improved and it will have more amounts available for paying off the short term
dues (Caltex, 2019). However, it has been found that the long term payables as well as long term
interest bearing liabilities had been significantly went up that is signifying that the company is
efficient in paying its short term dues however need long term credit for its business operation.
Over the years it did not issue any share capital however amount of treasury stock as well as
reserves and retained earnings both went up by significant amount. Further, out of total liability
and equity 49.62% consists of liabilities and 50.38% consists of equity in 2018 as compared to
51.10% of liability and 48.90% of equity in 2017. Hence, it can be determined that the company
has improved its leverage position as debt portion has been reduced as compared to the equity
(Caltex, 2019).
Cash flow statement
Cash flow statement of the entity represents the details of cash generated and cash
expenses for different activities and is segregated into 3 parts – cash inflow or outflow for
operational activities, cash inflow or outflow for investing activities and cash inflow and cash
inflow or outflow for financing activities. Looking into the 1st part it can be identified that the
cash generated from operating activities has been reduced from $ 735,032 to $ 596,504. Major
reason behind the drop is the increase in the amount of payment made to suppliers, governments
and employees. However owing to payment made towards borrowing the interest expenses
reduced from $ 57,693 to $ 52,000 (Caltex, 2019). Looking forward to the cash outflows towards
investing activities it can be identified that the same has been dropped significantly from $
800,348 to $ 425,573. Major reason behind the drop in cash outflows towards investing activities
is the reduction in the amount of purchases of non-current assets like plant and property in 2018
as compared to 2017. Looking into the cash outflows for financing activities it can be
recognised that the same went up from $ 135,020 to $ 222,933 over the period from 2017 to
2018. Reason behind increase in amount of cash outflows towards financing activities is the
repayment of borrowing made amounting to $ 73,78,557 in 2018 against $ 48,42,447 in 2017.
This is signifying that the entity on liquid terms is viable and is in a position to make payment
towards its obligations (Caltex, 2019).
Financial ratio analysis
Financial ratios are used to indicate the key performances of the entity and the data are
generally obtained from the set of financial statements released by the entity for its stakeholders.
These ratios help in analysing the entity’s profitability, efficiency, liquidity and leverage position
(Boyas & Teeter, 2017).
⊘ This is a preview!⊘
Do you want full access?
Subscribe today to unlock all pages.
Trusted by 1+ million students worldwide
Profitability ratio
Profitability ratios are used to measure the efficiency of the firm with which it transforms
its business activities into profits. It further evaluates the ability of the firm to convert its sales
revenue into profits. Among various profitability ratios most widely used ratios are as follows –
Gross profit margin – it is one of the major margin that is derived using the data from
income statement. It is computed through dividing the gross profit by the sales revenue.
Generally it represents the ability of the entity in making good amount of money from
selling of its products or services after taking out the amount of COGS (Cantele &
Zardini, 2018). Increasing trend of gross profit denoted that in context of financial health
the entity and increases the entity’s potential for bottom line earnings. Analysing the
gross profit trend of the entity for 2017 and 2018 it can be established that the same for
the entity has been reduced from 10.10% to 9.78%.
Net profit margin – apart from gross profit margin, net profit margin is another crucial
profitability ratios that is used for analyse the entity’s bottom line profit. It is the profit
margin after making payment entire operating expenses, dividends on preferred stocks,
taxes from the sales revenue generated by it (Faello, 2015). It is computed through
dividing the net profit of the entity by its sales revenue. Analysing the net profit trend of
the entity for 2017 and 2018 it can be established that the same for the entity has been
reduced from 2.90% to 2.58%.
Hence, it can be determined that the overall profitability position of the entity has been
deteriorated over the years from 2017 to 2018. However, it still has adequate amount to provide
return to its shareholders.
Paraphrase This Document
Need a fresh take? Get an instant paraphrase of this document with our AI Paraphraser
Liquidity ratio
Liquidity ratio determines the ability of the firm in paying-off its short term obligation as
and when the same become due. To be more specific, liquidity ratios states how quickly the
current assets of the entity can be converted into cash for paying off the liabilities in timely
manner. It has direct impact on the entity’s credibility as well as its credit rating (De Carvalho et
al., 2016). Among various liquidity ratios most widely used ratios are as follows –
Current ratio – it is also referred as the banker’s ratio or working capital ratio. It
expresses relationship of current assets against current liabilities. Comparing the current
ratio of current period against previous period determine whether the liquidity position of
the entity has been enhanced or deteriorated. It is computed through dividing the current
assets by the current liabilities (Robinson et al., 2015). Though the ideal ratio depends on
the type of industry under which the entity is dealing, generally 2:1 is considered as ideal.
Analysing the current ratio of the entity for 2017 and 2018 it can be established that the
same for the entity has been increased from 1.16 to 1.31.
Quick ratio – current ratio is used for evaluating the overall short term liquidity or
solvency status, however, it is also desirable to know instant debt paying ability of the
entity through considering only the most liquid assets. Looking into the quick ratio of the
entity for 2017 and 2018 it can be established that the same for the entity has been
increased from 0.44 to 0.57(Caltex, 2019).
Hence, it can be determined that though the overall liquidity position of the entity has
been enhanced over the years from 2017 to 2018, higher amount of current assets are blocked in
inventories that take some time to get converted into cash. Hence, the entity shall try to replace
or sell the inventories faster that will make higher amount of liquid asset in form of cash
(Rodrigues & Rodrigues, 2018).
Efficiency ratio
It is used to determine the efficiency with which the assets are utilized and liquidities are
managed by the entity for generating sales. Among various efficiency ratios most widely used
ratios are as follows –
Receivable turnover ratio – it determines the efficiencies of the entity in context of
providing credit facility and collecting the dues from debtors. To be more specific it
determines the time taken by the entity in collecting its dues from debtors (Marsha &
Murtaqi, 2017). Looking into the trade receivables ratio of the entity for 2017 and 2018 it
can be established that the same for the entity has been reduced from 25.63 times to 20.63
times.
Inventory turnover ratio - it determines the efficiencies of the entity in context of selling
its entire stock during the concerned period. Looking into the trade receivables ratio of
the entity for 2017 and 2018 it can be established that the same for the entity has been
reduced from 13.86 times to 11.84 times (O’Neill, Sohal & Teng, 2016).
Hence, considering the overall efficiency position it can be stated that the efficiency of
the entity over the years has been deteriorated.
Capital structure ratios
It determined the entity’s leverage position considering the debt proportion and equity
proportion of the entity. Most widely used capital structure ratios are –
⊘ This is a preview!⊘
Do you want full access?
Subscribe today to unlock all pages.
Trusted by 1+ million students worldwide
Debt ratio and equity ratio – these ratios determines the proportion of debt and equity
used for acquiring assets. For Caltex proportion of debt and equity used for acquiring
assets are almost equal.
Debt to equity ratio – it determines the proportion of debt and equity in the capital
structure. High portion of debt signifies high leverage and solvency risk. For Caltex
proportion of debt and equity used for acquiring assets are almost equal (Rakićević et al.,
2016).
Overall capital structure is denoting that the entity has balanced capital structure as the
proportion of debt and equity are approximately equal.
Conclusion
Analysing the financial performance of Caltex Australia Limited it is concluded that the
though overall profitability position of the entity has been deteriorated over the years it still has
adequate amount to provide return to its shareholders. Further, though the liquidity position
deteriorated it has sufficient current assets to pay off current obligation. Further, it is lower
leveraged as it has balanced capital structure.
Paraphrase This Document
Need a fresh take? Get an instant paraphrase of this document with our AI Paraphraser
Reference
Boyas, E., & Teeter, R. (2017). Teaching Financial Ratio Analysis using XBRL.
In Developments in Business Simulation and Experiential Learning: Proceedings of the
Annual ABSEL conference (Vol. 44, No. 1).
Caltex. (2019). Caltex Australia | Fuels, Lubricants & Convenience Retail. Retrieved 9
September 2019, from https://www.caltex.com.au/
Cantele, S., & Zardini, A. (2018). Is sustainability a competitive advantage for small businesses?
An empirical analysis of possible mediators in the sustainability–financial performance
relationship. Journal of cleaner production, 182, 166-176.
De Carvalho, A. O., Ribeiro, I., Cirani, C. B. S., & Cintra, R. F. (2016). Organizational
resilience: A comparative study between innovative and non-innovative companies based
on the financial performance analysis. International Journal of Innovation, 4(1), 58-69.
Faello, J. (2015). Understanding the limitations of financial ratios. Academy of Accounting and
Financial Studies Journal, 19(3), 75.
Marsha, N., & Murtaqi, I. (2017). The effect of financial ratios on firm value in the food and
beverage sector of the idx. Journal of Business and Management, 6(2), 214-226.
O’Neill, P., Sohal, A., & Teng, C. W. (2016). Quality management approaches and their impact
on firms׳ financial performance–An Australian study. International Journal of
Production Economics, 171, 381-393.
Rakićević, A., Milošević, P., Petrović, B., & Radojević, D. G. (2016). DuPont financial ratio
analysis using logical aggregation. In Soft computing applications (pp. 727-739).
Springer, Cham.
Robinson, T. R., Henry, E., Pirie, W. L., & Broihahn, M. A. (2015). International financial
statement analysis. John Wiley & Sons.
Rodrigues, L., & Rodrigues, L. (2018). Economic-financial performance of the Brazilian
sugarcane energy industry: An empirical evaluation using financial ratio, cluster and
discriminant analysis. Biomass and bioenergy, 108, 289-296.
Williams, E. E., & Dobelman, J. A. (2017). Financial statement analysis. World Scientific Book
Chapters, 109-169.
Zainudin, E. F., & Hashim, H. A. (2016). Detecting fraudulent financial reporting using financial
ratio. Journal of Financial Reporting and Accounting, 14(2), 266-278.
⊘ This is a preview!⊘
Do you want full access?
Subscribe today to unlock all pages.
Trusted by 1+ million students worldwide
1 out of 20
Related Documents


Your All-in-One AI-Powered Toolkit for Academic Success.
+13062052269
info@desklib.com
Available 24*7 on WhatsApp / Email
![[object Object]](/_next/static/media/star-bottom.7253800d.svg)
Unlock your academic potential
Copyright © 2020–2026 A2Z Services. All Rights Reserved. Developed and managed by ZUCOL.