Financial Analysis of Canadian Tire Corporation (ACCT3410)

Verified

Added on  2022/11/13

|6
|979
|114
Report
AI Summary
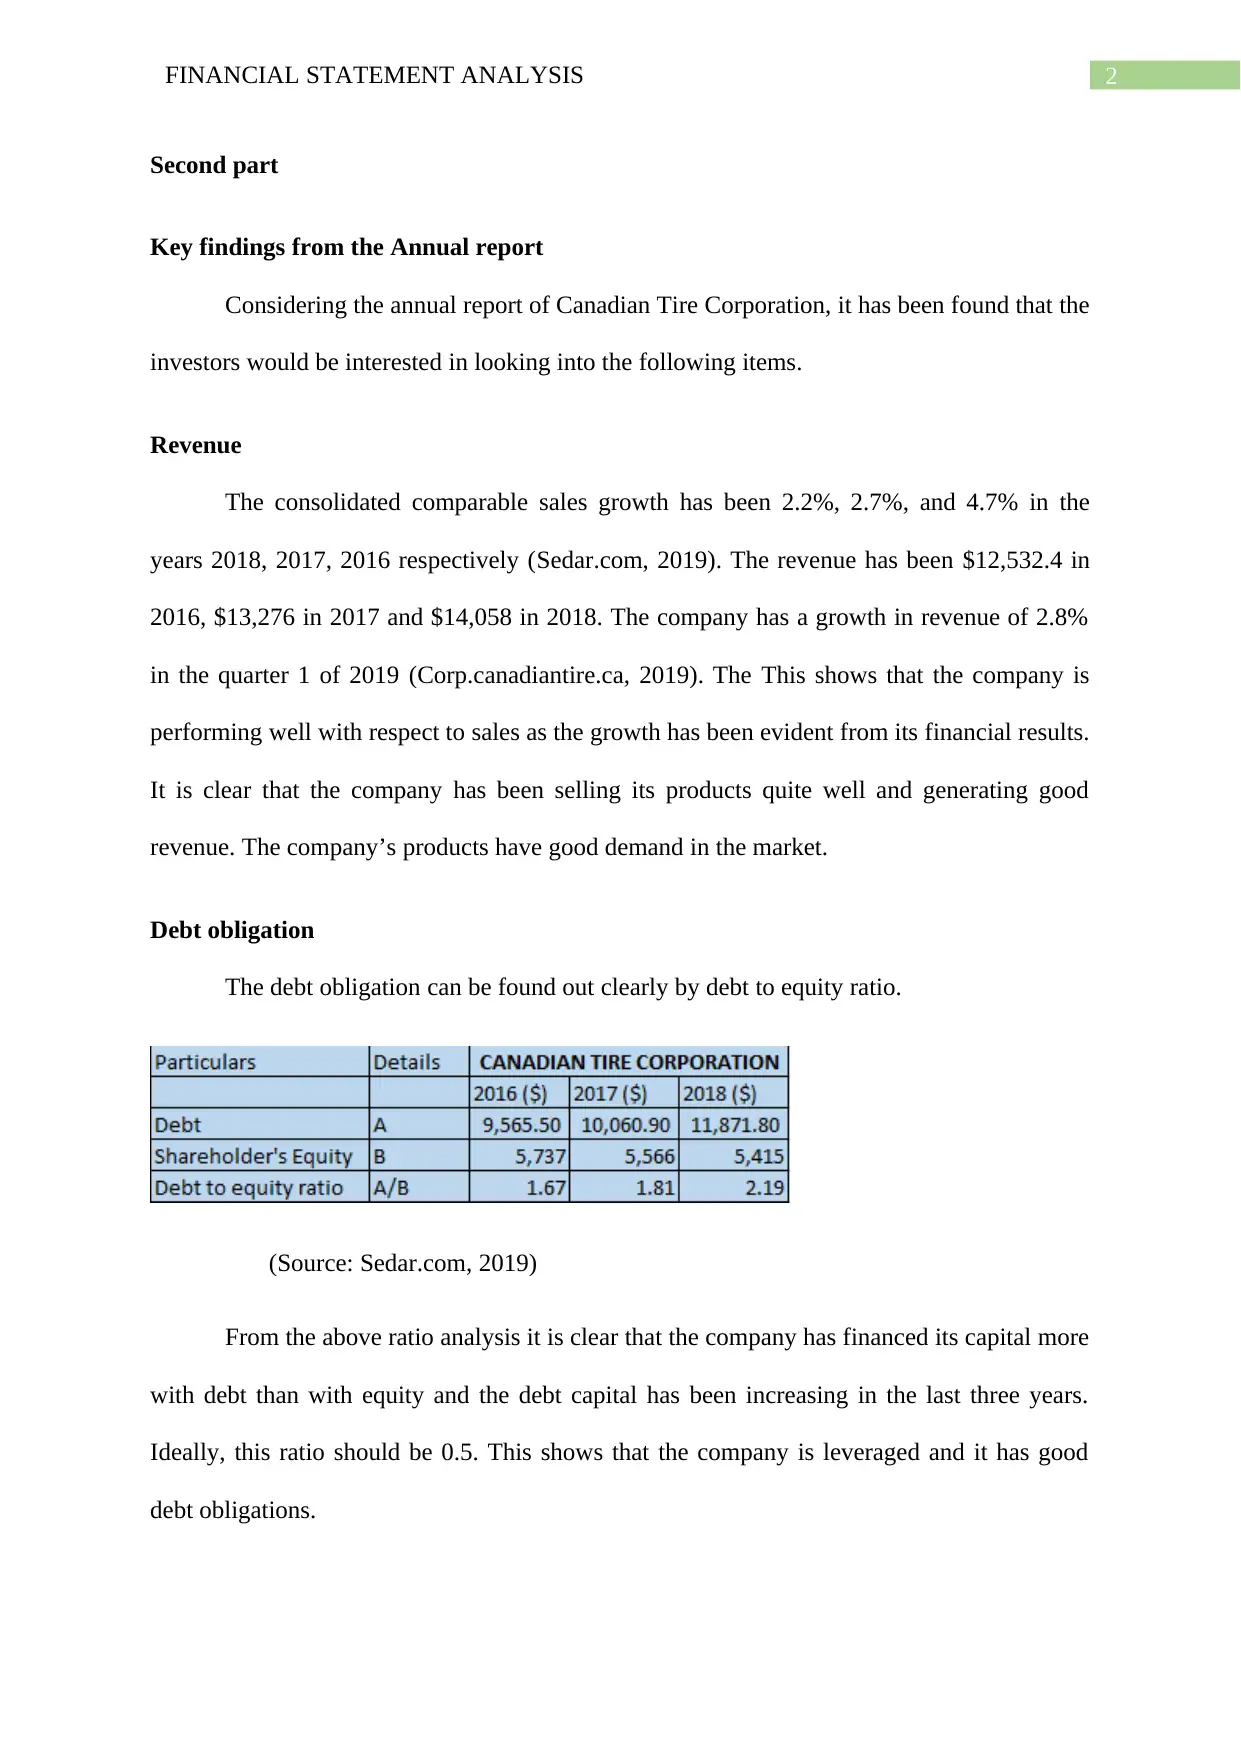
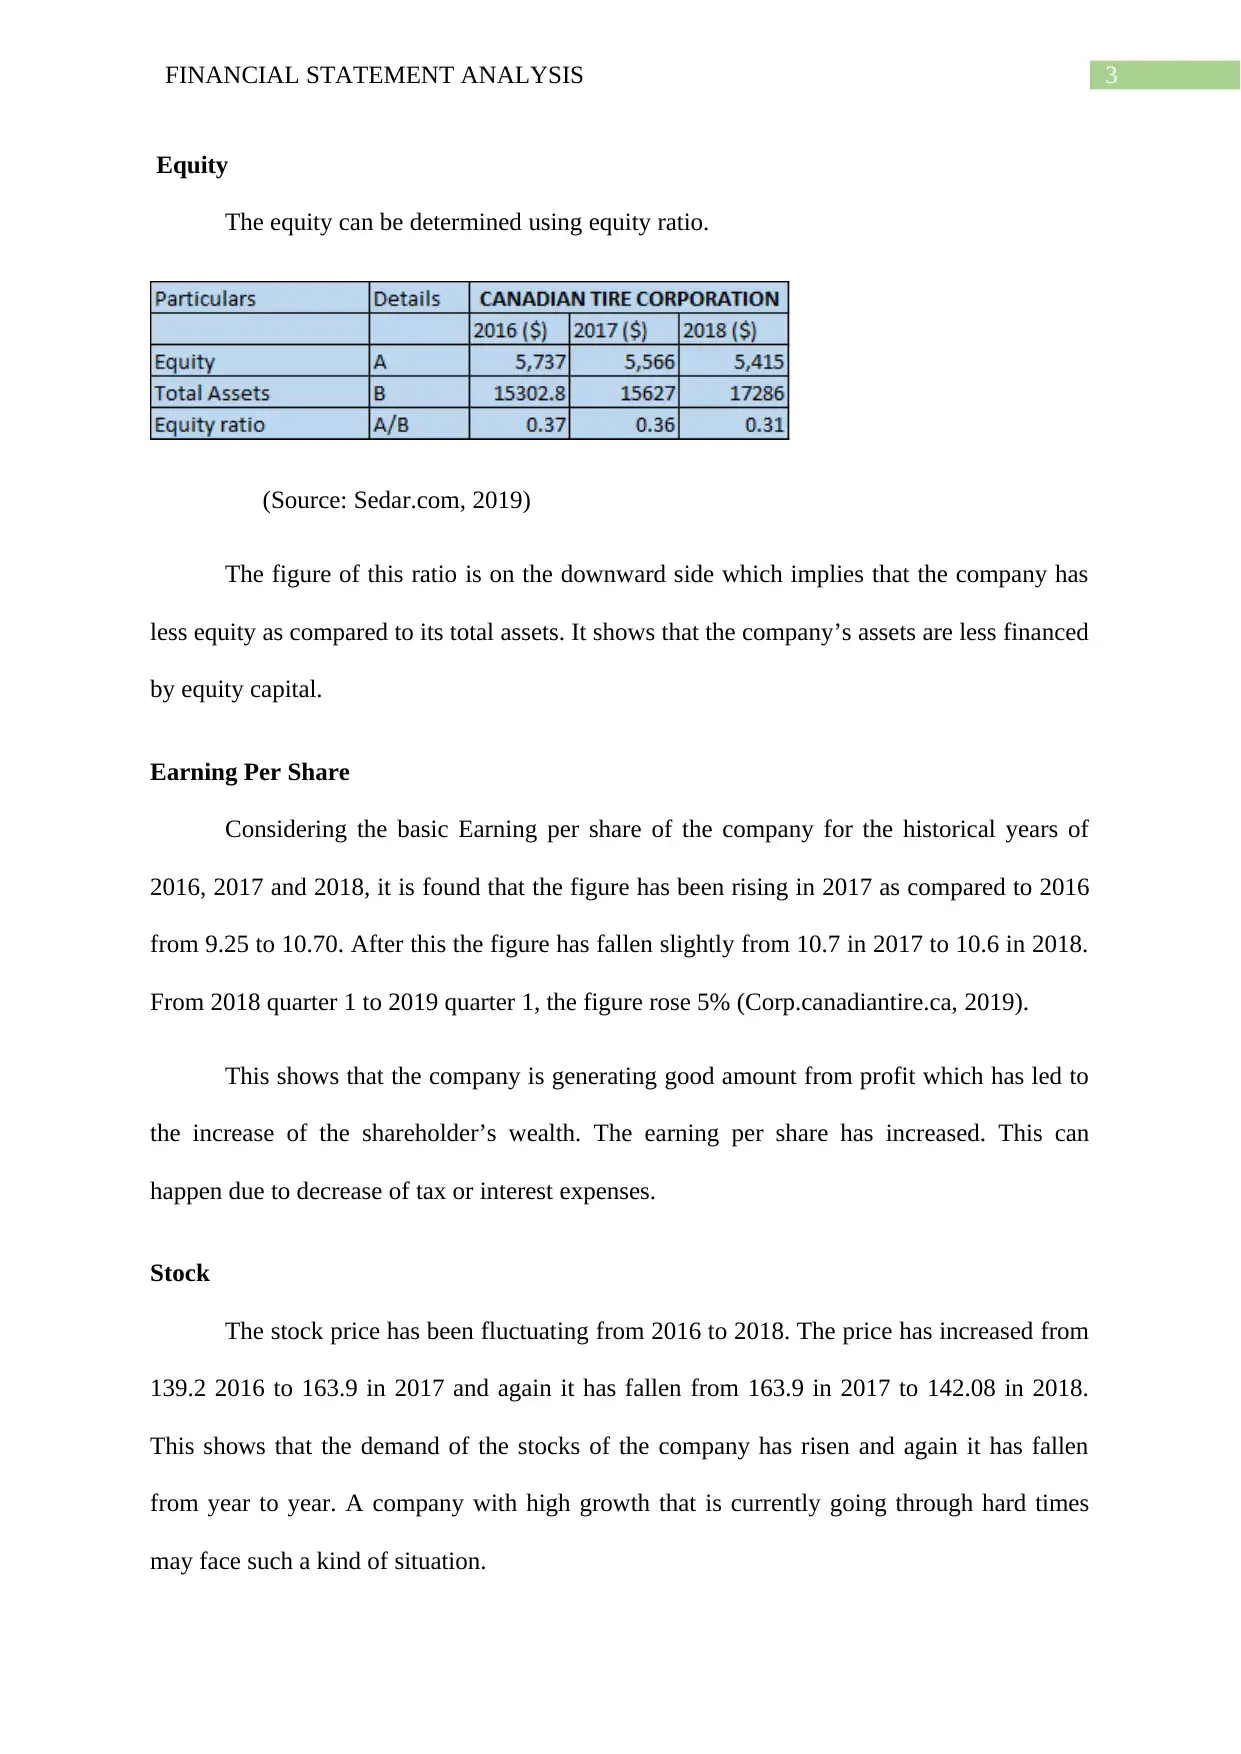
This report presents a financial statement analysis of Canadian Tire Corporation, evaluating its performance based on key financial metrics. The analysis examines revenue growth, debt obligations, equity position, earnings per share, and stock price fluctuations from 2016 to 2018, and Q1 2019. The report highlights significant findings such as the company's revenue growth, debt-to-equity ratio, and earning per share trends. The report also discusses the impact of events after the reporting period (IAS 10), focusing on contingent assets and liabilities, and their implications for investors. The analysis incorporates information from Canadian Tire Corporation's annual reports and financial statements, along with relevant accounting standards to assess the reliability of financial data. The report concludes with an assessment of the company's investment potential.
Document Page
Running head: FINANCIAL STATEMENT ANALYSIS
Financial Statement Analysis
Name of the Student
Name of the University
Author’s note
tabler-icon-diamond-filled.svg

Paraphrase This Document

Need a fresh take? Get an instant paraphrase of this document with our AI Paraphraser
Document Page
1FINANCIAL STATEMENT ANALYSIS
Table of Contents
Second part.................................................................................................................................1
Key findings from the Annual report.........................................................................................1
Revenue......................................................................................................................................1
Debt obligation...........................................................................................................................1
Equity.........................................................................................................................................2
Earning Per Share.......................................................................................................................2
Stock...........................................................................................................................................2
Fifth part.....................................................................................................................................3
Events after the reporting period (IAS 10).................................................................................3
References..................................................................................................................................4
Document Page
2FINANCIAL STATEMENT ANALYSIS
Second part
Key findings from the Annual report
Considering the annual report of Canadian Tire Corporation, it has been found that the
investors would be interested in looking into the following items.
Revenue
The consolidated comparable sales growth has been 2.2%, 2.7%, and 4.7% in the
years 2018, 2017, 2016 respectively (Sedar.com, 2019). The revenue has been $12,532.4 in
2016, $13,276 in 2017 and $14,058 in 2018. The company has a growth in revenue of 2.8%
in the quarter 1 of 2019 (Corp.canadiantire.ca, 2019). The This shows that the company is
performing well with respect to sales as the growth has been evident from its financial results.
It is clear that the company has been selling its products quite well and generating good
revenue. The company’s products have good demand in the market.
Debt obligation
The debt obligation can be found out clearly by debt to equity ratio.
(Source: Sedar.com, 2019)
From the above ratio analysis it is clear that the company has financed its capital more
with debt than with equity and the debt capital has been increasing in the last three years.
Ideally, this ratio should be 0.5. This shows that the company is leveraged and it has good
debt obligations.
Document Page
3FINANCIAL STATEMENT ANALYSIS
Equity
The equity can be determined using equity ratio.
(Source: Sedar.com, 2019)
The figure of this ratio is on the downward side which implies that the company has
less equity as compared to its total assets. It shows that the company’s assets are less financed
by equity capital.
Earning Per Share
Considering the basic Earning per share of the company for the historical years of
2016, 2017 and 2018, it is found that the figure has been rising in 2017 as compared to 2016
from 9.25 to 10.70. After this the figure has fallen slightly from 10.7 in 2017 to 10.6 in 2018.
From 2018 quarter 1 to 2019 quarter 1, the figure rose 5% (Corp.canadiantire.ca, 2019).
This shows that the company is generating good amount from profit which has led to
the increase of the shareholder’s wealth. The earning per share has increased. This can
happen due to decrease of tax or interest expenses.
Stock
The stock price has been fluctuating from 2016 to 2018. The price has increased from
139.2 2016 to 163.9 in 2017 and again it has fallen from 163.9 in 2017 to 142.08 in 2018.
This shows that the demand of the stocks of the company has risen and again it has fallen
from year to year. A company with high growth that is currently going through hard times
may face such a kind of situation.
tabler-icon-diamond-filled.svg

Paraphrase This Document

Need a fresh take? Get an instant paraphrase of this document with our AI Paraphraser
Document Page
4FINANCIAL STATEMENT ANALYSIS
Fifth part
Events after the reporting period (IAS 10)
According to Capkun, Collins and Jeanjean (2016), IAS 10 defines the adjustments
for the set of events reported after the reporting period in the balance sheet of that company.
Generally such events include contingent assets and liabilities and provisions.
The investors can assess the financial position, cash flows and performance through
the events which are adjusted later after reporting. Contingent assets are of importance to the
investors as these assets may occur due to uncertain events and boost up a company’s
finances. Investors may get benefitted due to occurrence of such assets.
For example – Canadian Tire Corporation decides to file a lawsuit against another
company for infringing on the patent of Canadian Tire Corporation and then wins the case,
the lawsuit gained by Canadian Tire Corporation will be shown as a contingent asset in the
adjustment section of its Financial Statement. The investors are likely to have good
impression from such a situation.
Contingent liabilities may be of disadvantage to the investors if a company tries to
pay too much interest on credit or do not expand due to risk of loss (Hennes, 2014).
For example – Canadian Tire Corporation has a pending investigation put upon it
and it is required to pay a certain amount, then it separately sets aside the amount required to
be paid. Such liabilities are paid when the liability arises and are reported accordingly in the
financial statement. Due to occurrence of such liabilities the investors are likely to shift from
their investment decisions in this company.
Document Page
5FINANCIAL STATEMENT ANALYSIS
References
Corp.canadiantire.ca. . (2019). Canadian Tire Corporation, Limited - Investors - Financial
Reporting - Quarterly Results Retrieved 18 July 2019, from
corp.canadiantire.ca/English/investors/financials-reporting/quarterly-results/
default.aspx
Capkun, V., Collins, D., & Jeanjean, T. (2016). The effect of IAS/IFRS adoption on earnings
management (smoothing): A closer look at competing explanations. Journal of
Accounting and Public Policy, 35(4), 352-394.
Hennes, K. M. (2014). Disclosure of contingent legal liabilities. Journal of Accounting and
Public Policy, 33(1), 32-50.
Sedar.com. (2019). Search for Company Documents. Retrieved 18 July 2019, from
sedar.com/search/search_form_pc_en.htm
chevron_up_icon
1 out of 6
circle_padding
hide_on_mobile
zoom_out_icon
[object Object]